

I. INTRODUCTION
Clay particles have the ability to change and improve many physical properties, e.g., mechanical strength, thermal stability, conductivity, etc. of the medium in which they are suspended.Reference Walls, Riley, Singhal, Spontak, Fedkiw and Khan1–Reference Ratna, Divekar, Samui, Chakraborty and Banthia3 Some of these properties can be anisotropically enhanced if the particles are orientationally aligned in the host medium. Such a particle organization can be utilized as a molecular barrier, i.e., the permeability of gas molecules in polymer–clay composites are significantly reduced in the direction normal to clay platelet surfaces, whereas no change is expected for molecules propagating along the oriented clay surfaces. Yano et al.Reference Yano, Usuki, Okada, Kurauchi and Kamigaito4 report that only a 2 wt% addition of montmorillonite clay particles into polyimide may lower the gas permeability down to a value less than half of the pure polyimide gas permeability. Alignment of clay particles can be induced by planar shearing,Reference Okamoto, Nam, Maiti, Kotaka, Nakayama, Takada, Ohshima, Usuki, Hasegawa and Okamoto5 extrusion,Reference He, Yang, Zhu, Wang, Sun, Lv, Phang and Liu6 gravity,Reference Hemmen, Ringdal, De Azevedo, Engelsberg, Hansen, Méheust, Fossum and Knudsen7 and magneticReference De Azevedo, Engelsberg, Fossum and de Souza8 or electric field.Reference Fossum, Méheust, Parmar, Knudsen, Måløy and Fonseca9
An electric field is often used to produce anisotropic structures to obtain desirable physical properties. When polarizable particles are exposed to an electric field of either alternating current or direct current, dipoles will be induced and result in a rotational force on the particles in accordance with the Clausius–Mossotti relation.Reference Huang, Lee, Yang and Chen10 The particle alignment can be monitored by means of x-ray or neutron diffraction,Reference Rozynek, Knudsen, Fossum, Méheust, Wang and Zhou11,Reference Knudsen, Fossum, Helgesen and Haakestad12 and the degree of anisotropy can be quantified and expressed in terms of an order parameter S 2 (Refs. Reference Hemmen, Ringdal, De Azevedo, Engelsberg, Hansen, Méheust, Fossum and Knudsen7,Reference Méheust, Knudsen and Fossum13) (for details see Sec. III. A).
In previous studies by our group, the average orientational clay distribution was measured in a silicone oil system.Reference Fossum, Méheust, Parmar, Knudsen, Måløy and Fonseca9,Reference Rozynek, Knudsen, Fossum, Méheust, Wang and Zhou11 In the present study, the clay particles are instead dispersed in melted paraffin wax. There are some important differences between this system and the silicone oil system: the paraffin wax viscosity is significantly higher since the paraffin molecules are longer than the oil molecules, thus clay alignment is achieved at higher temperatures, i.e., between 65 and 100 °C, and is slower than for the silicone oil case. Therefore, in the present case of paraffin wax, we are able to monitor the increase of orientational order dynamically.
We are here also concerned with studying the amount of water that is intercalated inside clay galleries. It is well known that the swelling/shrinking of layered clay particles consists of changes in the basal spacing (d-spacing), and these changes can be monitored by means of x-ray diffraction. The amount of intercalated water is a function of temperature and relative humidity (RH) of the clay surroundings. Hemmen et al.Reference Hemmen, Alme, Fossum and Méheust14,Reference Hemmen, Alme, Fossum and Méheust15 showed that by measuring the basal spacing d, it is possible to (i) estimate a local humidity surrounding the clay particles, and thus (ii) monitor quasi-one-dimensional diffusion of water through the bulk sample, and finally (iii) extract profiles of RH along the sample. Here, we investigate the time-dependent changes in the intercalated water content of clays in both the melted state and the crystallized paraffin. This is the initial step for further measurements of anisotropic water diffusion through paraffin matrices with aligned clay particles.
The layout of this article is as follows: first, the sample preparation and the experimental procedures are explained in Sec. II. Wide-angle x-ray scattering results are presented in Sec. III, including alignment of clay particles in electric field and the development of the system anisotropy during melting and crystallization (Sec. III. A), time-dependent one-to-zero water layer transition (Sec. III. B), and finally, zero-to-one water layer transition (Sec. III. C). Conclusions and suggestions for further work are presented in Sec. IV.
II. SAMPLE DESCRIPTION, PREPARATION, AND EXPERIMENTAL PROCEDURES
A. Li-Fh clay particles
In this work, we have studied the synthetic clay fluorohectorite. There are several reasons for this choice. First, fluorohectorite is a 2:1 type clay with a crystallographic structure similar to that of some natural clay minerals such as montmorillonite.Reference Kaviratna, Pinnavaia and Schroeder16 Second, our group has studied fluorohectorite as a model system for claysReference Fossum17–Reference Hansen, Hemmen, Fonseca, Coutant, Knudsen, Plivelic, Bonn and Fossum19 for many years and this system is thus understood and characterized in great detail.
Lithium fluorohectorite (Li-Fh) was purchased from Corning Inc., New York, in the form of a white powder. Li-Fh is a synthetic 2:1 smectite clay having the nominal chemical formula Li+1.2[Mg4.8Li1.2Si8O20F4]−1.2 per unit cell, where Li+ is an interlayer exchangeable cation. Li-Fh has a surface charge of 1.2 e−/unit cell and is a polydisperse clay with platelet diameters ranging from a few 100 nm up to a few µm.Reference Fossum18 A “single” particle consists of about 80–100 platelets (crystalline sheets)Reference Hemmen, Alme, Fossum and Méheust14,Reference Hemmen, Alme, Fossum and Méheust15 that stack on top of one another. Since the thickness of such a stack is approximately 0.1 μm, the resulting particle has a diameter-to-height ratio on average close to 20:1. However, the single particles tend to agglomerate when dispersed into a nonpolar medium (oils, polymeric matrices, etc.) unless chemically modified.Reference Wang, Zhou, Rozynek and Fossum20 Both the shape and the size of aggregated structures may vary, and in general, they depend on the clay type and sample preparation.Reference Rozynek, Zacher, Janek, Čaplovičová and Fossum21–Reference Rozynek, Mauroy, Castberg, Knudsen and Fossum23 The Li-Fh clay mineral swells when it absorbs water. The swelling of layered 2:1 smectite clay particles is caused by a change in the basal spacing between crystalline sheets (d-spacing).Reference Silva, Fossum, DiMasi, Måløy and Lutnæs24
B. Paraffin wax
Paraffin wax normally refers to a mixture of n-alkanes (chemical formula CnH2n+2) with n ranging between 20 and 40 determining the characteristic length of the molecules and also the melting temperature of the paraffin matrix. The material used for the present composite preparation was purchased from Sigma-Aldrich (ASTM D 127, batch: MKBC6750, Sigma-Aldrich Norway AS, Oslo, Norway). This particular type of paraffin wax has its melting point around 65 °C and was chosen due to the following reasons: (i) the x-ray peak positions related to the characteristic molecule dimensions should not overlap with clay reflections related to the interlamellar distance, (ii) optimal melting and crystallization temperatures providing both the ease of composite preparation and appropriate stiffness of the composite when in a solid form at room temperature, and (iii) the relatively nonpolar and nonconductive materials that can be used as an electrorheological carrier fluid for clay particles when in the melted state.
The characterization of the pure paraffin wax by means of x-ray scattering and rheometry is presented in the supporting materials (see Figs. S1 and S2).
C. Preparation of paraffin–clay composites
The first sample batch was prepared to monitor the dynamic alignment of clay particles during the composite melting and crystallization inside a custom-made heating cell. The sample batch was made as follows: 1.4 g of Li-Fh clay powder was slowly added into 7 g of premelted (90 °C) paraffin wax. After 10 min of stirring, the solution was left to rest for 3 min to allow the biggest clay particles to sediment. The top part (80% of the solution), consisting of the smallest clay particles, was then poured into a 10 mL glass phial (Procedure 1).
The solution was then kept at a temperature between 80 °C and 90 °C and stirred for 1 h to disperse clay particles within the paraffin. Finally, the solution was cooled down, and the solid cast was cut into small pieces that could fit inside the sample holder of the heating cell (see Fig. S3 in supporting material).
The second sample batch was prepared for in situ monitoring of the water content in clays embedded in paraffin matrix. In the first step, the composites were made following the Procedure 1 and then the solution was stabilized at a temperature around 120–130 °C under stirring. The temperature was higher for this batch compared with the first sample batch since we wish to monitor the time-dependent dehydration in clays, i.e., the one-to-zero water transition. Every hour, around 0.5 mL of solution was taken out to make a solid cast and x-rayed immediately after each composite had solidified. The same samples (stored in a solid form at room temperature and RH between 20% and 30%) were reexamined by x-ray scattering 6 months later to monitor changes in the water content. The dimensions of composites are 30 × 6.5 × 1.5 mm3. An example of a solid cast is shown in supporting Fig. S4. In all samples, the clay concentration was estimated to be around 5% by weight.
D. Wide-angle x-ray scattering experimental procedures
Investigations of the dynamic alignment of clay particles (Sample Batch 1) were performed at the European Synchrotron Radiation Facility (ESRF) in Grenoble, France. An x-ray beam with a wave length of 0.9 Å and a beam size of 0.3 × 0.3 mm2 at the sample was used. The beamline BM01A is equipped with a two-dimensional (2D) MAR345 image plate detector with a diameter of 345 mm. The available scattering q-range is 0.03–1.6 Å−1, where the scattering vector q = 4πsin(θ/2)/λ, given by the wave length λ of the incident beam and the scattering angle θ. The custom-made sample cell (Fig. S3) enabled precise control of heating and cooling in temperature range between 20 °C and 100 °C.
The second sample batch was investigated at our home laboratory (NTNU, Trondheim, Norway) using NanoSTAR from Bruker AXS setup in a wide-angle x-ray scattering (WAXS) mode. The instrument is equipped with a Cu Kα Xenocs microsource emitting x-rays at a wave length of 1.5418 Å and a 2D gas detector. The beam size at the sample is about 0.4 mm in diameter and the available scattering q-range for the setup is 0.08–1 Å−1. The sample-to-detector distance was calibrated using a silver behenate standard.
III. RESULTS
A. Electric-field-induced alignment of clay particles
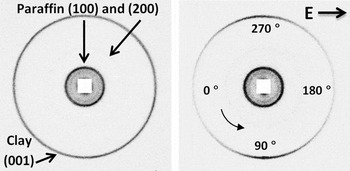
Figure 1 shows two examples of the 2D WAXS patterns from paraffin–clay composites without (left) and with (right) an applied external electric field. The outermost ring originates from the Bragg 001 reflection that corresponds to the distance between clay’s crystalline layers. It becomes anisotropic in the presence of an electric field due to clay particle alignment.
2D WAXS patterns from paraffin–clay composites without (left) and with (right) an applied external electric field of 250 V/mm. The outermost ring from clay becomes anisotropic indicating that clay particles are aligned with their stacking direction perpendicular to the electric field lines.

To quantify the degree of anisotropy of the system, i.e., how well the clay platelets align with respect to the electric field direction, one needs to integrate the 2D WAXS patterns (corresponding to the width of the 001 clay peak) radially over a narrow q-range and fit the obtained azimuthal plot to a parametric function. The Maier-Saupe function is commonly used for characterizing the orientational order in the field of liquid crystals.Reference De Gennes25,Reference Maier and Saupe26 It has previously been utilized for nematic-like dispersions of clay mineral particles,Reference Lemaire, Panine, Gabriel and Davidson27,Reference Bihannic, Baravian, Duval, Paineau, Meneau, Levitz, de Silva, Davidson and Michot28 and it has also been used successfully for characterizing electrorheological alignment of clay particles.Reference Fossum, Méheust, Parmar, Knudsen, Måløy and Fonseca9,Reference Rozynek, Knudsen, Fossum, Méheust, Wang and Zhou11,Reference Méheust, Knudsen and Fossum13,Reference Rozynek, Mauroy, Castberg, Knudsen and Fossum23 Use of the Maier-Saupe function in the present case thus gives a direct comparison between the present system and the related previous work in this field. In short, the fitting parameter is a measure of the peak full width at half maximum, i.e., a smaller value equals a higher degree of anisotropy and can be expressed as the nematic order parameter S 2. The values of this parameter ranges from −1/2 to 1, where 1 indicates perfectly oriented platelet particles in the nematic configuration, 0 states no orientational order, and −1/2 indicates perfectly oriented platelets in the so-called antinematic configuration.Reference Rozynek, Knudsen, Fossum, Méheust, Wang and Zhou11,Reference Méheust, Knudsen and Fossum13,Reference Dozov, Paineau, Davidson, Antonova, Baravian, Bihannic and Michot29
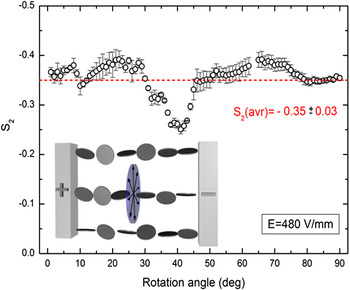
We are expecting the clay particles to align in the antinematic fashion when an external electric field is applied. The validity of such an assumption is tested here by investigation of the clay particle alignment as a function of the rotation angle, i.e., the rotation axis is in the direction parallel to electric field lines. Ninety 2D WAXS images of the solidified sample were captured at different rotation angles with the rotation axis parallel to the electric field direction. Remark: we lack data points at angles 63° and 64°. The nematic order parameters were calculated for each sample position. The results are presented in Fig. 2, where S 2 values are plotted against the rotation angle. For measurements performed at rotational angles between 36° and 44°, the nematic order parameter displays a rather systematic deviation from the average observed S 2 values. Since the sample was cubic shaped, it is possible that the effective sample thickness in the x-ray beam direction is significantly larger at these rotational angles, thus contributing to more multiple scattering. For the measurements performed at other rotation angles, the S 2 values do not change considerably, indicating that there is no preferential orientation along the rotation angle, as represented by the arrowed disc being part of the plane normal to the electric field direction (see Fig. 2 inset). Thus, we can assume that the antinematic configuration applies for the clay particles in the present case.
The nematic order parameter calculated for different rotation angles. The average S 2 value is indicated as a dashed line. The inset shows a sketch of the clay alignment in a so-called antinematic configuration (see text for details).

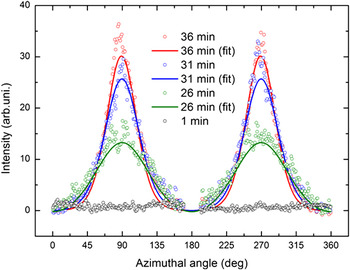
To examine whether the alignment of clay particles may be disrupted during paraffin crystallization, the nanoparticles’ dispersion state was monitored during heating and cooling using the custom-made sample cell. X-ray diffractograms were first collected for samples at room temperature with no preferential orientation. Electric field (250 V/mm, 100 Hz, square wave) was applied from the beginning of the measurements, and it did not affect the samples while in solid form. Figure 3 shows 1D azimuthal plots (only 4 out of 64 measurements are shown for sake of clarity), where the 001 Bragg peak amplitudes (clay stacking) increase when paraffin melts and clay particles start aligning.
Azimuthal plots of the first Bragg peak amplitude (001) measured at different times during the paraffin melting.

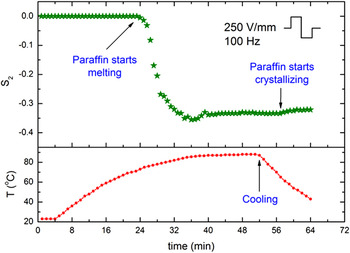
The scattered points are the experimental data, whereas the lines are the Maier-Saupe fits. The results of fitting are presented in Fig. 4. The nematic order parameter S 2 = 0 was ascribed by default for data points measured from 0 to 23 min since it was impossible to converge the 1D azimuthal plots with the fitting curve (as the black open circles in Fig. 3). The red curve shows the temperature measured 2 mm away from the sample.
Development of the anisotropy in the system expressed by changes in the nematic order parameter S 2.

The degree of anisotropy in the system increases when the paraffin starts melting and S 2 reaches a maximum value −0.36 at t = 36 min. Interestingly, as time passes, the anisotropy starts decreasing slightly and the value of S 2 changes by ∼15%, and it thus seems like a better particle alignment is achieved before individual particles start forming column-like structures. After 54 min, the sample was cooled down. It took around 5 min for paraffin to start crystallizing. A small drop in S 2 was observed during that time. This might be caused by the paraffin crystallization. The final measured nematic order parameter value (last minutes − solid sample) is −0.32. More measurements are needed to be more conclusive on these points.
Compared with particle alignment in clay/silicone oil-suspension (at room temperature) studied by our group previously, the characteristic rotation time τR (alignment of clay particles along the electric field lines) is longer in the present case since the paraffin wax is significantly more viscous than the silicone oil used in the previous work.Reference Rozynek, Knudsen, Fossum, Méheust, Wang and Zhou11 Recently, this rotation time has been shown to be proportional to E 2 and inversely proportional to the viscosity of the carrier fluid.Reference Castberg, Rozynek, Fossum, Måløy, Dommersnes and Flekkøy30 As reported in,Reference Castberg, Rozynek, Fossum, Måløy, Dommersnes and Flekkøy30 when particle is immersed in castor oil with the viscosity of ∼1 Pa s and exposed to E = 250 V/mm, it takes typically few seconds for a Fh clay aggregate (size: ∼1 × 0.1 × 0.05 mm) to rotate around 90° and align with its major axis along the electric field lines. Figure S1 shows that the viscosity of paraffin wax is significantly higher than that of the castor oil used in,Reference Castberg, Rozynek, Fossum, Måløy, Dommersnes and Flekkøy30 thus the rotation time is expected to be in range of minutes (before paraffin reaches T above 70 °C).
B. One-to-zero water layer transition
Water can intercalate in between each fluorohectorite platelet in the stack, causing the clay particle stack to swell. For Li-Fh, the intercalation process, which is temperature and RH dependent, yields four stable hydration states.Reference Tenorio, Engelsberg, Fossum and da Silva31,Reference Tambach, Bolhuis, Hensen and Smith32 The structures, referred to as having 0, 1, 1.5, or 2 intercalated water layers, respectively, are quite well ordered along the stacking direction. The unit cell along the stacking direction is given by the distance between the stacked platelets, and the d-spacing in this direction is close to 10, 12, 13.5, and 1.5 Å for the case of 0 water layer (WL), 1 WL, 1.5 WL, and 2 WL, respectively.
The samples from the second batch were measured to investigate the time-dependent changes in the water content intercalated between the clay’s crystalline sheets. The recorded x-ray data allow monitoring of the evolution of one-to-zero and zero-to-one WL transitions.
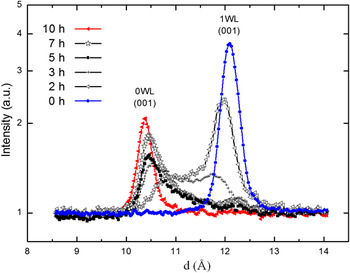
Figure 5 shows azimuthally integrated 2D WAXS patterns from six samples prepared at different times, namely for 0, 2, 3, 5, 7, and 10 h of stirring at elevated temperature around 120–130 °C. Initially, the clay particles (kept at room temperature and ambient humidity, in a form of powder) were in the pure 1 WL hydration state (first measurement − blue dotted curve). The corresponding 001 Bragg peak is located at 12.1 Å. After 2 h, the 1 WL peak intensity decreased and a new, broad and not yet distinct peak appeared at the q-value corresponding to the 0 WL hydration state. Both peaks are shifted from their initial (d 1001WL = 12.1 Å) and final (d 1000WL = 10.3 Å) positions toward lower and higher values (d 1001WL = 11.9 Å and d 1000WL =10.7 Å), respectively. The intensity of the peak related to the 0 WL state increases with time and becomes sharper. After 5 h, the population of clay particles in the scattering volume contains a significantly higher proportion of 0 WL over 1 WL spacing. The clay particles need almost 10 h to reach the nearly pure 0 WL hydration final state (red curve with triangles). A minor population of clay particles possessing the intercalated water is still present but is hardly detectable by our instrument.
The interlayer hydration states occurring in smectite clays are pure water layer states [i.e., 0 WL, 1 WL, (1.5 WL), and 2 WL], and in addition Hendricks–Teller mixed hydration states occur as reported by Michels et al.Reference Michels, Hemmen, Droppa Junior, Grassi, Silva and Fossum33 Recently, Hemmen et al.Reference Hemmen, Alme, Fossum and Méheust14,Reference Hemmen, Alme, Fossum and Méheust15 thoroughly mapped systematic changes in the d-spacing values within the pure WL states as a function of RH and investigated the 1-to-2 WL transition. In the present case, the 1-to-0 WL transition was monitored. The maximum values of the smooth changes in the d-spacing, with respect to both the initial and the final states (1 WL → 0 WL), are in the order of approximately 0.3 Å for deviation from 1 WL and 0.5 Å for deviation from 0 WL. These values are similar to those that reported by Hemmen et al.Reference Hemmen, Alme, Fossum and Méheust14,Reference Hemmen, Alme, Fossum and Méheust15 .
C. Zero-to-one water layer transition
The samples described in Sec. III. B (dehydrated to a different extend) were stored at room temperature and RH between 20% and 30% for 6 months and then x-rayed to monitor the water contents.
The time 2:1 smectite clays require to hydrate depends on RH and temperature together with the size and charge of the exchangeable cation in the interlayer space. For powdered samples, the time evolution magnitude is in the order of hours.Reference DiMasi, Fossum, da Silva, Dominguez, Mas and Cravero34–Reference Løvoll, Sandnes, Méheust, Måløy, Fossum, da Silva, Mundim, Droppa and Fonseca37 However, the time needed for the entire clay population (inside the paraffin wax) to reach the 1 WL state is considerably longer. The effective RH around embedded clay particles is low since the water penetration through the oligomer matrix is restrained.
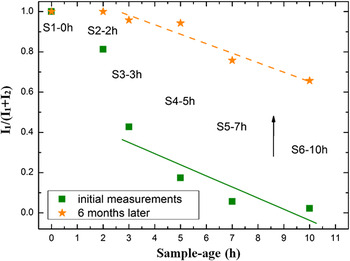
Figure 6 shows I 1/(I 1 + I 2) magnitude ratios for 0 WL and 1 WL peak intensities for six samples from the second sample batch. The ratio values are in the range of 0–1, where 0 indicates a pure dehydrated state, 0.5 is obtained when the number of clay particles in the two states is equal, and 1 depicts the pure monohydrated state. Green squared data points were acquired from measuring samples right after their preparation (as shown also in Fig. 5). Orange star data points were obtained from the same samples, measured 6 months later. For all samples (S1–0 h omitted in this discussion), water molecules intercalate into the clay galleries. However, the complete recovery from a partially dehydrated state (0 WL) to a monohydrated state (1 WL) was only accomplished by the sample labeled S2–2 h. By comparing the intensity ratio values, it can be concluded that the remaining four samples absorbed comparable amounts of water. The two lines in Fig. 6 were obtained by fitting the data points to a linear function I 1/(I 1 + I 2) = a + bx. The calculated values of the slope b were very similar for the two sets, i.e., −0.05 ± 0.02 and −0.06 ± 0.02 for the (dashed) orange and (solid) green curves, respectively.
Time evolution of the one-to-zero WL transition (Sample Batch 2).

The ratios I 1/(I 1 + I 2) between magnitudes of 0 WL and 1 WL peak intensities for six samples (Sample Batch 2). Their values are in the range of 0–1, where 0 indicates the pure dehydrated state, 0.5 is obtained when the number of clay particles in the two states are equal, and 1 depicts the pure monohydrated state.

IV. CONCLUSIONS
We have investigated the electric field-induced alignment of fluorohectorite clay particles in oligomeric matrices, and the development of the system anisotropy was observed during paraffin melting and crystallization. Interestingly, it was found that on average, the clay particles loose some of their orientational order to accommodate chain formation.
The dehydration of clay particles as a function of time was also investigated, and our observations show that it takes almost 10 h for the clay particles in the melted wax to reach the pure 0 WL hydration final state. However, the zero-to-one WL transition for clay particles being embedded in crystallized paraffin is very slow. This is due to a very low water penetration through the oligomer matrix. Even after 6 months with air exposure, the sample still contains a population of clay particles possessing no or very little intercalated water. This suggests that such embedded clay particles can be used as “meso-detectors” for monitoring the local water content in such bulk carrier matrices. We plan future work in this direction including investigations of possibly anisotropic water diffusion through paraffin matrices with aligned clay particles.
ACKNOWLEDGMENTS
The authors would like to thank Kenneth Dahl Knudsen and Elisabeth Lindbo Hansen for their helpful comments on the manuscript, and also D. Chernyshov for his assistance while performing experiments at the Swiss-Norwegian Beam Lines at ESRF. Yves Méheust and Henrik Hemmen are acknowledged as creators of the script for fitting the data to the Maier-Saupe function. The 2D WAXS diffractograms were analyzed using Fit2D created by A. P. Hammersley. This work was supported by the Research Council of Norway through the FRINAT Program: NFR project number 171300, the NANOMAT Program: NFR project number 182075, and the SYNKNØYT Program.