





Introduction
Late childhood is increasingly recognized as a sensitive developmental period for the emergence of mental health problems. Recent global evidence indicates that mental disorders are prevalent during this period, with an estimated prevalence of 12.40% among 10- to 14-year-olds worldwide (Kieling et al., Reference Kieling, Buchweitz, Caye, Silvani, Ameis, Brunoni, Cost, Courtney, Georgiades, Merikangas, Henderson, Polanczyk, Rohde, Salum and Szatmari2024). Moreover, childhood psychopathology is a strong predictor of subsequent mental health issues and functional impairments across adolescence and adulthood (Fusar-Poli et al., Reference Fusar-Poli, Correll, Arango, Berk, Patel and Ioannidis2021). This highlights the importance of timely prevention and intervention at this critical stage. The family environment is one of the most influential contexts for children’s development (Bronfenbrenner, Reference Bronfenbrenner1986), acting as both a risk and protective factor in the emergence of psychological problems (Repetti et al., Reference Repetti, Taylor and Seeman2002). Empirical studies have consistently shown that family environment variables, such as higher levels of family conflict (Edwards & Hans, Reference Edwards and Hans2015; Tetzner et al., Reference Tetzner, Bondü and Krahé2022), reduced parental monitoring (Gryczkowski et al., Reference Gryczkowski, Jordan and Mercer2010; Stevens et al., Reference Stevens, Vollebergh, Pels and Crijnen2007), and lower parental acceptance (Li & Meier, Reference Li and Meier2017; Putnick et al., Reference Putnick, Bornstein, Lansford, Malone, Pastorelli, Skinner, Sorbring, Tapanya, Uribe Tirado, Zelli, Alampay, Al-Hassan, Bacchini, Bombi, Chang, Deater-Deckard, Di Giunta, Dodge and Oburu2015; Rothenberg et al., Reference Rothenberg, Ali, Rohner, Lansford, Britner, Di Giunta, Dodge, Malone, Oburu, Pastorelli, Skinner, Sorbring, Steinberg, Tapanya, Uribe Tirado, Yotanyamaneewong, Alampay, Al-Hassan, Bacchini and Deater-Deckard2022), are significantly associated with increased internalizing and externalizing problems in children. As such, identifying and addressing adverse family environments is crucial for mental health prevention and intervention.
Research on family environment and psychological problems has employed two primary approaches: variable-centered and individual-centered. Although variable-centered analyses, which examine associations between specific family environment variables and psychological outcomes, have predominated in the literature, individual-centered methods provide a complementary perspective with notable clinical relevance (Howard & Hoffman, Reference Howard and Hoffman2018; Lanza & Cooper, Reference Lanza and Cooper2016). Family systems theory posits that the family possesses a complex and multifaceted nature, which cannot be fully captured through the analysis of a single variable in isolation (Cox & Paley, Reference Cox and Paley2003). In line with this theory, individual-centered approaches capture heterogeneity by integrating multiple dimensions simultaneously to identify structurally distinct family profiles. These profiles reflect highly complex patterns across multiple variables that are often difficult to detect through variable-centered analyses. Such a typological framework may facilitate the identification of differentiated risk subgroups and inform stratified intervention strategies. Therefore, adopting an individual-centered approach that combines multiple family factors to distinguish adaptive from maladaptive family profiles is crucial for developing a more integrated approach to identifying at-risk children and guiding targeted prevention and intervention strategies (Jobe-Shields et al., Reference Jobe-Shields, Andrews, Parra and Williams2015).
Family is not static or unchanged but is subject to dynamic changes (Combrinck-Graham, Reference Combrinck-Graham1985; Gutman & Eccles, Reference Gutman and Eccles2007). Several prior studies have identified the dynamic changes of specific family environment variables as individuals develop during childhood and adolescence using a variable-centered approach. For example, emotional closeness and time spent with parents (Larson et al., Reference Larson, Richards, Moneta, Holmbeck and Duckett1996), parental warmth and rejection (Sijtsema et al., Reference Sijtsema, Oldehinkel, Veenstra, Verhulst and Ormel2014), and family conflict (Kouros et al., Reference Kouros, Cummings and Davies2010; Laursen et al., Reference Laursen, Coy and Collins1998), have all been shown to fluctuate and vary over time. Additionally, research has shown that changes in individual family environment variables are associated with subsequent psychological issues (e.g., Kouros et al., Reference Kouros, Cummings and Davies2010; Sijtsema et al., Reference Sijtsema, Oldehinkel, Veenstra, Verhulst and Ormel2014). Specifically, Kouros et al. (Reference Kouros, Cummings and Davies2010) found that increases in interparental conflict were associated with more externalizing problems. Sijtsema et al. (Reference Sijtsema, Oldehinkel, Veenstra, Verhulst and Ormel2014) revealed that increases in paternal warmth were linked to fewer depressive problems over time. Based on the evidence from these individual family environment variables, it can be inferred that, when considering the family environment as a whole and integrating multiple family factors simultaneously, the identified profile of a given family environment is not necessarily stable but may also evolve dynamically over time. Capturing longitudinal changes in family environment profiles and systematically examining their associations with the development of children’s psychological issues could provide new insights for early screening and ongoing monitoring of children’s mental health.
To the best of our knowledge, no previous study has examined the longitudinal association of changes in family environment profiles and psychological problems in children. While some studies have adopted an individual-centered approach to analyze family environment profiles in child and adolescent samples (e.g., Al Ghriwati et al., Reference Al Ghriwati, Winter and Everhart2017; Doyle et al., Reference Doyle, Clark Goings, Cryer-Coupet, Lombe, Stephens and Nebbitt2017; Elam et al., Reference Elam, Sandler, Wolchik and Tein2016), only three studies have specifically examined changes in family environment profiles over time (Gao et al., Reference Gao, Liang, Li, Su, Mei, Zhou and Meng2022; Lee & Han, Reference Lee and Han2021; Yang et al., Reference Yang, Zhang, Xie, Li and Wang2023). Specifically, Lee and Han (Reference Lee and Han2021) identified significant changes in parental attitude profiles, Gao et al. (Reference Gao, Liang, Li, Su, Mei, Zhou and Meng2022) observed significant changes in family conflict and cohesion profiles, and Yang et al. (Reference Yang, Zhang, Xie, Li and Wang2023) found significant changes in caregiver involvement profiles. However, none of these studies have explored the relationship between changes in family environment profiles and psychological symptoms, leaving the potential impact of these changes on children’s psychopathology unclear. Furthermore, although these studies have used an individual-centered approach, they have typically examined only a single dimension of the family environment (i.e., parental attitudes, family conflict, caregiver involvement) at a time. Given the complex and multifaceted nature of the family environment, which operates as an integrated system, a more comprehensive approach that considers multiple dimensions simultaneously is necessary (Cox & Paley, Reference Cox and Paley2003). Additionally, many of these studies have been limited by small sample sizes. Given the diversity of family environment profiles and the multiple transition pathways they may generate, larger sample sizes are essential to more accurately capture these dynamic changes (Nylund-Gibson et al., Reference Nylund-Gibson, Garber, Carter, Chan, Arch, Simon, Whaling, Tartt and Lawrie2023).
To address these limitations, we employed an individual-centered latent modeling approach to characterize trajectories of children’s perceived family environment profiles and investigate their significance in relation to psychological problems during late childhood. Data from the Adolescent Brain Cognitive Development (ABCD) study, the largest population-based cohort in the United States tracking a representative sample of 9 to 10-year-old children, were utilized for this analysis. We employed latent profile analysis (Williams & Kibowski, Reference Williams, Kibowski, Jason and Glenwick2016) to identify distinct perceived family environment profiles at baseline and 1-year follow-up based on four indicators: family conflict, parental monitoring, and the acceptance of both primary and secondary caregivers. These indicators were selected because they reflect relatively distinct yet complementary dimensions of the family environment, each theoretically linked to the development of child psychopathology. Specifically, caregiver acceptance reflects emotional support, warmth, and positive caregiver–child interactions. It aligns with parental acceptance–rejection theory, which emphasizes perceived caregiver warmth and acceptance as central to children’s psychological adjustment (Rohner, Reference Rohner2004), as well as attachment theory, which views responsive caregiving as a foundation for emotional security and regulation (Bowlby, Reference Bowlby1969). Parental monitoring reflects caregivers’ knowledge, oversight, and involvement in children’s daily activities and social contexts, which may help guide and protect children. According to ecodevelopmental theory, it may reduce risk exposure across family, peer, and school contexts and support positive academic and behavioral outcomes (Hill & Taylor, Reference Hill and Taylor2004; Pantin et al., Reference Pantin, Schwartz, Sullivan, Prado and Szapocznik2004; Szapocznik & Coatsworth, Reference Szapocznik, Coatsworth, Glantz and Hartel1999). Family conflict reflects negative family dynamics that may create a stressful home environment, disrupt family functioning, and weaken children’s coping resources, thereby increasing risk for emotional and behavioral difficulties from the perspectives of family systems theory and the stress-buffering model (Cohen & Wills, Reference Cohen and Wills1985; Cox & Paley, Reference Cox and Paley2003; Cummings & Davies, Reference Cummings and Davies2002). Additionally, these indicators have shown robust longitudinal associations with youth internalizing and externalizing outcomes, reflecting key dimensions of family functioning that influence children’s psychological development (e.g., Edwards & Hans, Reference Edwards and Hans2015; Rothenberg et al., Reference Rothenberg, Ali, Rohner, Lansford, Britner, Di Giunta, Dodge, Malone, Oburu, Pastorelli, Skinner, Sorbring, Steinberg, Tapanya, Uribe Tirado, Yotanyamaneewong, Alampay, Al-Hassan, Bacchini and Deater-Deckard2022; Stevens et al., Reference Stevens, Vollebergh, Pels and Crijnen2007). Notably, acceptance from both caregivers was included, as the interactions between different caregivers and children may vary, with each potentially exerting a unique influence on children’s development (Ohannessian et al., Reference Ohannessian, Flannery, Simpson and Russell2016; Verhoeven et al., Reference Verhoeven, Bögels and van der Bruggen2012). The cross-sectional and longitudinal associations between these profiles and psychological outcomes were first examined. More importantly, latent transition analysis (Nylund, Reference Nylund2007; Nylund-Gibson et al., Reference Nylund-Gibson, Garber, Carter, Chan, Arch, Simon, Whaling, Tartt and Lawrie2023) was utilized to assess the stability and changes in these profiles over time. Finally, we focused on the longitudinal association between these dynamic changes and internalizing and externalizing symptoms at follow-up.
Methods
Participants
We utilized data from Curated Annual Release 5.1 of the ABCD study, a large, nationally representative sample recruited from 21 U.S. research sites. The study received ethical approval from the central institutional review board at the University of California, San Diego, with local IRB approvals obtained at each site. Written informed consent was provided by parents or legal guardians, and verbal assent was obtained from participating children. Detailed methodology can be found in Garavan et al. (Reference Garavan, Bartsch, Conway, Decastro, Goldstein, Heeringa, Jernigan, Potter, Thompson and Zahs2018), with additional study information available at https://abcdstudy.org/.
The baseline sample included 11,868 children, a subset of whom (11,220 children) was followed up for 1 year. To ensure both caregivers were included in analyses, participants who reported not having a secondary caregiver at baseline or 1-year follow-up were excluded (N = 1,374). Further exclusions were made for participants with incomplete data for family environment variables at either baseline or 1-year follow-up (N = 708). This ensured that profile estimation at each wave and longitudinal transition analyses were based on the same individuals, thereby facilitating direct comparability across analytic steps. Finally, a total of 9,786 participants were included in the study, with an average age of 9.92 years (SD = 0.63) and 4,677 females (47.8%) at baseline. Regarding caregiver structure at baseline, the primary caregiver was most commonly the biological mother (85.1%), followed by the biological father (10.7%). The most common secondary caregiver was the father (70.7%), followed by the mother (10.2%). Secondary caregiver categories were coded consistently across waves, allowing all secondary-caregiver changes to be summarized. Overall, 2,403 children (24.6%) experienced a change in their secondary caregiver, with the most common transitions being from father to mother (3.9%) and from father to grandmother (2.9%). For completeness, we considered reporting primary caregiver changes; however, the coding schemes differed across waves: at baseline, caregivers were classified as biological mother, biological father, adoptive parent, custodial parent, or other, whereas at the 1-year follow-up, caregivers were classified by their relationship to the child (mother, father, grandmother, grandfather, aunt, uncle, or other). Consequently, primary caregiver changes are not reported. Demographic characteristics of the sample are presented in Table 1.
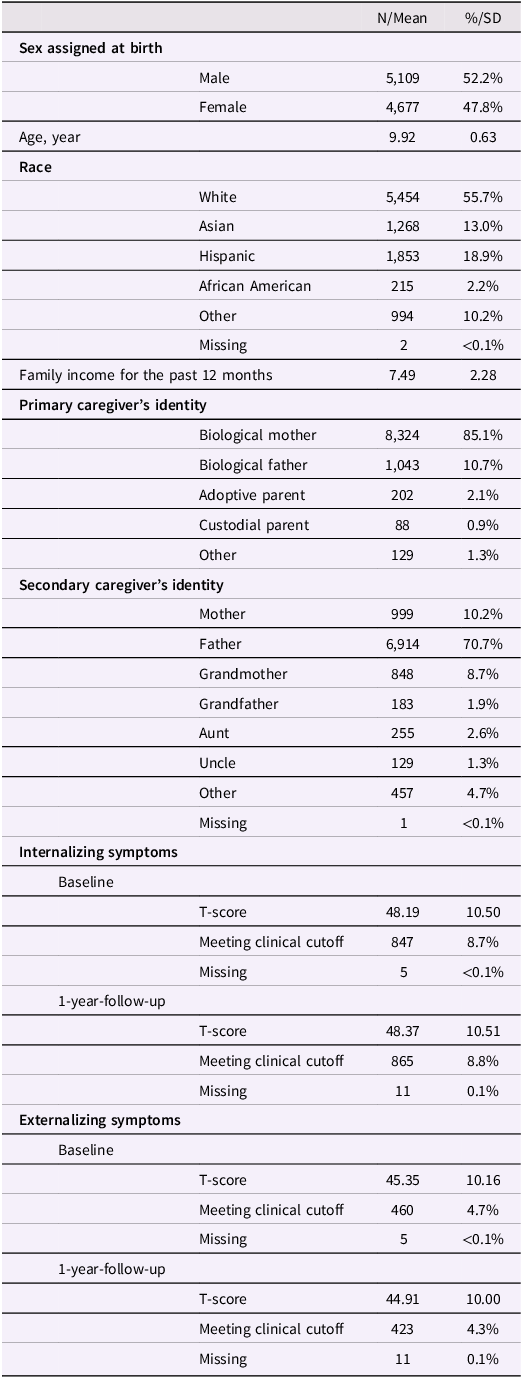
Demographic and clinical characteristics of participants at baseline (N = 9,786)

Table 1. Long description
Table 1 summarizes demographic and clinical characteristics of the 9,786 children at baseline. The sample was 52.2% male and 47.8% female, with a mean age of 9.92 years. Race was reported as 55.7% White, 13.0% Asian, 18.9% Hispanic, 2.2% African American, and 10.2% other. Mean family income on a 10-point scale was 7.49. The primary caregiver was most often the biological mother, at 85.1%, followed by the biological father, at 10.7%. The secondary caregiver was most often the father, at 70.7%, followed by the mother, at 10.2%, and the grandmother, at 8.7%. Mean internalizing T-scores were 48.19 at baseline and 48.37 at 1-year follow-up, with 8.7% and 8.8% meeting the clinical cutoff. Mean externalizing T-scores were 45.35 at baseline and 44.91 at 1-year follow-up, with 4.7% and 4.3% meeting the clinical cutoff.
Note. Family income was rated on a 10-point scale: 1= Less than $5,000; 2 = $5,000 through $11,999; 3 = $12,000 through $15,999; 4 = $16,000 through $24,999; 5 = $25,000 through $34,999; 6 = $35,000 through $49,999; 7 = $50,000 through $74,999; 8 = $75,000 through $99,999; 9 = $100,000 through $199,999; 10=$200,000 and greater. Clinical cutoff indicated by a T-score of 65 or more. Percentages are rounded to one decimal place, and nonzero percentages below 0.1% are reported as <0.1%.
Measurements
Family environment variables
In this study, we focused on family environment variables as perceived by children, with all data being self-reported by the participants. The emphasis on children’s perceptions is based on research demonstrating a significant discrepancy between parent-reported and child-perceived family environments, with each showing distinct associations with children’s developmental outcomes (Leung et al., Reference Leung, Shek and Li2016).
Family conflict. Children’s perceptions of family conflict were evaluated using the 9-item family conflict subscale of the Family Environment Scale (FES; Moos & Moos, Reference Moos and Moos1986). This subscale gauges the prevalence of various conflict-related behaviors within the family, including fighting, anger expression, criticism, competitiveness, yelling, and loss of temper. An example item is “We have frequent arguments in our family.” Each item was dichotomously coded, with 1 indicating the presence of the behavior and 0 indicating its absence. Sum scores of the responses were computed for analysis. Higher ratings indicated more family conflict. The FES has previously been used as a self-report measure in children aged 8–12 years, supporting its developmental appropriateness in late childhood (Vanager, Reference Vanager2012). In the present sample, Cronbach’s α was 0.67 at both baseline and the 1-year follow-up.
Parental monitoring. The degree of parental tracking and monitoring was reported by the children themselves using the 5-item Parental Monitoring Questionnaire (Zucker et al., Reference Zucker, Gonzalez, Feldstein Ewing, Paulus, Arroyo, Fuligni, Morris, Sanchez and Wills2018), a brief measure derived by the ABCD Study from prior empirical studies on parental monitoring (Chilcoat & Anthony, Reference Chilcoat and Anthony1996; DiClemente et al., Reference DiClemente, Wingood, Crosby, Sionean, Cobb, Harrington, Davies and Oh2001; Karoly et al., Reference Karoly, Callahan, Schmiege and Feldstein Ewing2016; Shillington et al., Reference Shillington, Lehman, Clapp, Hovell, Sipan and Blumberg2005; Stattin & Kerr, Reference Stattin and Kerr2000). These studies assessed perceived parental monitoring among children and adolescents, supporting its developmental appropriateness for assessing parental monitoring in late childhood. This scale was designed to capture parental monitoring as a multidimensional construct, including parental supervision (e.g., tracking children’s whereabouts and companions), child disclosure (i.e., sharing plans regarding daily activities), and family time (i.e., shared dinners). These dimensions provide a more comprehensive view of parental monitoring, where supervision is complemented by child disclosure, a key source of parent knowledge about children, and family time, which offers opportunities for both supervision and disclosure (Eisenberg et al., Reference Eisenberg, Neumark-Sztainer, Fulkerson and Story2008; Stattin & Kerr, Reference Stattin and Kerr2000). Items on the scale were rated on a 5-point Likert scale ranging from 1 (Never) to 5 (Always or Almost Always). One representative item asked, “How frequently do your parents/guardians know your whereabouts?” The mean score of the responses was computed for analysis. Cronbach’s α in the present sample was 0.45 at baseline and 0.46 at the 1-year follow-up. Given this low internal consistency, we conducted item-deletion analyses to determine whether deleting any item would improve reliability. The resulting Cronbach’s α values ranged from 0.35 to 0.46 at baseline and from 0.38 to 0.45 at the 1-year follow-up, indicating that no item deletion produced a meaningful or consistent improvement. One possible explanation for the relatively low internal consistency is the multidimensional nature of parental monitoring as defined in the ABCD protocol (Zucker et al., Reference Zucker, Gonzalez, Feldstein Ewing, Paulus, Arroyo, Fuligni, Morris, Sanchez and Wills2018). Given this low internal consistency, the mean score may be better understood as a brief composite indicator of overall parental monitoring/oversight across different monitoring-related dimensions, rather than a precise indicator of a single latent construct.
Caregiver acceptance. Perceived caregiver acceptance was assessed via five items selected from the caregiver acceptance subscale of the Children’s Report of Parent Behavior Inventory (CRPBI; Schaefer, Reference Schaefer1965). An illustrative item is “My caregiver makes me feel better after discussing my concerns with him/her.” Each item was rated on a 3-point Likert scale (1 = “Not like him/her”, 2 = “Somewhat like him/her”, 3 = “A lot like him/her”). The mean score of the responses was computed for analysis. Children provided separate reports on the acceptance received from their primary and secondary caregivers. The CRPBI has previously been administered as a child-report measure in 9–12-year-old children and has shown good internal consistency (Wolchik et al., Reference Wolchik, Tein, Winslow, Minney, Sandler and Masten2021). In the present sample, internal consistency was acceptable for both the primary and secondary caregiver acceptance scales, with Cronbach’s α values of 0.70 and 0.77 at baseline and 0.71 and 0.74 at the 1-year follow-up, respectively.
Psychopathology symptoms
The children’s internalizing and externalizing problems over the past six months were measured using the Child Behavior Checklist for Ages 6–18 (CBCL/6–18; Achenbach & Rescorla, Reference Achenbach and Rescorla2001), with reports provided by the primary caregiver. The CBCL includes 119 items across eight syndrome scales, contributing to composite scores for internalizing, externalizing, and total problems. Caregivers rated each item on a 3-point scale (0 = “not true,” 1 = “somewhat true,” 2 = “very true”). In the present study, we only focused on the internalizing and externalizing domains. The internalizing domain captures emotional problems and includes the withdrawn/depressed, somatic complaints, and anxious/depressed scales. The externalizing domain reflects behavioral problems, incorporating the rule-breaking and aggressive behavior scales. The remaining syndrome scales – social problems, thought problems, and attention problems – are not included in the internalizing or externalizing composites but contribute to the total problems score. The raw scores were converted into T-scores, where a T-score below 60 indicates typical functioning, scores from 60 to 64 suggest a risk for clinical symptoms, and a score of 65 or above indicates clinical symptoms. In the present sample, Cronbach’s α was 0.86 for internalizing symptoms and 0.89 for externalizing symptoms at both baseline and the 1-year follow-up.
Statistical analysis
Identifying latent profiles of perceived family environment
Latent profile analyses were conducted at baseline and 1-year follow-up to identify latent family environment profiles, using family conflict, parental monitoring, primary caregiver’s acceptance, and secondary caregiver’s acceptance as indicators. Prior to analysis, each variable was standardized to z-scores (mean = 0, SD = 1). Solutions consisting of 2–6 latent classes were tested. To assess and compare the model fit indices of these class solutions, we relied on five indicators (Johnson, Reference Johnson2021; Nylund, Reference Nylund2007): the Akaike information criterion (AIC), the Bayesian information criterion (BIC), the sample-size-adjusted BIC (ssaBIC), the Lo-Mendell-Rubin adjusted likelihood ratio test (LMR-LRT), and the entropy criterion. Lower AIC, BIC, and ssaBIC values indicate better model fit. The LMR-LRT compares a k-class solution with a k-1 class solution, where a significant p-value suggests that the k-class model provides a better fit. The entropy criterion assesses classification accuracy, with values closer to 1 reflecting higher accuracy. Models with classes comprising less than 5% of the sample may compromise solution stability (Hipp & Bauer, Reference Hipp and Bauer2006) and are considered inadequate, irrespective of fit statistics.
In addition, differences in baseline demographic characteristics across the latent profiles identified at baseline and at the 1-year follow-up were examined using the Bolck, Croon, and Hagenaars (BCH) method for continuous variables and the categorical distal outcome (DCAT) method for categorical variables (Asparouhov & Muthén, Reference Asparouhov and Muthén2014; Bakk & Vermunt, Reference Bakk and Vermunt2016). To control for multiple comparisons, a false discovery rate (FDR) of 5% (Benjamini & Hochberg, Reference Benjamini and Hochberg1995) was applied separately to the six pairwise comparisons for each demographic characteristic.
Association of perceived family environment profiles with internalizing and externalizing symptoms
We further examined the associations of profile membership with internalizing and externalizing psychopathology, both cross-sectionally and longitudinally. Specifically, we modeled the relationship between profiles and psychopathology symptoms cross-sectionally at both baseline and 1-year follow-up. Additionally, we assessed the prospective predictive utility of baseline family profiles for follow-up psychopathology symptoms, controlling for baseline levels of the corresponding symptom. The BCH method, recognized for its robustness in analyzing the relationship between continuous outcome variables and categorical latent variables (Bakk & Vermunt, Reference Bakk and Vermunt2016), was utilized to evaluate varied outcomes across the identified profiles. Cohen’s d was computed by dividing the BCH-estimated mean difference by the total sample standard deviation in cross-sectional analyses. For longitudinal analyses controlling for baseline symptoms, Cohen’s d was calculated as a covariate-adjusted standardized mean difference by dividing the adjusted mean difference in 1-year follow-up symptoms by the residual standard deviation of the corresponding follow-up symptom outcome from the same covariate-adjusted model, consistent with approaches for standardized contrasts in covariate-adjusted models (Shieh, Reference Shieh2023). To control for multiple comparisons, FDR correction at 5% was applied separately to internalizing and externalizing outcomes, each comprising six statistical comparisons, to determine significance.
Assessing transitions in latent family environment profiles from baseline to 1-year follow-up
Latent transition analysis, a longitudinal extension of latent profile analysis, was employed to examine the stability and trajectories of perceived family environment profiles from baseline to 1-year follow-up. The latent transition analysis was specified and estimated following the established procedures and recommendations outlined in the extant literature (Nylund, Reference Nylund2007; Nylund-Gibson et al., Reference Nylund-Gibson, Garber, Carter, Chan, Arch, Simon, Whaling, Tartt and Lawrie2023). To enable a more straightforward interpretation of the transition probabilities, measurement invariance across time points was tested (Nylund, Reference Nylund2007). This involves comparing the fit of two models: one assuming measurement invariance (i.e. item means are held equal over time) and the other not assuming measurement invariance (i.e., item means are free to vary). The Log Likelihood Ratio Test (LRT) was used to formally test the fit of these models (Nylund, Reference Nylund2007; Satorra & Bentler, Reference Satorra and Bentler2010). However, in the context of latent transition analysis, this method may be considered conservative as it is sensitive to sample size and the quantity of parameters being tested for invariance (Nylund-Gibson et al., Reference Nylund-Gibson, Garber, Carter, Chan, Arch, Simon, Whaling, Tartt and Lawrie2023). Therefore, we also considered the AIC, BIC, and ssaBIC metrics, which impose adjustments for sample size and the number of parameters.
Longitudinal association of latent transition pathways of perceived family environment profiles with follow-up psychological symptoms
To examine whether latent transition pathways of perceived family environment profiles were associated with internalizing and externalizing symptoms at the 1-year follow-up, analyses were conducted using a manual three-step approach in Mplus (Asparouhov & Muthén, Reference Asparouhov and Muthén2014). First, the unconditional LTA model was estimated to identify the latent profiles and transition probabilities. Second, the classification parameters from the LTA model were saved. Third, these saved parameters were incorporated into subsequent models so that comparisons of symptom outcomes across transition pathways could be conducted while accounting for classification uncertainty. Within each baseline profile, children who transitioned to different profiles at the 1-year follow-up were compared with those who remained in the same profile across both time points, who served as the reference group. Internalizing and externalizing symptoms were examined separately in different models, with the corresponding baseline symptom score included as a covariate in each model. Using the MODEL CONSTRAINT command, the adjusted mean of the 1-year follow-up symptom outcome for each transition pathway was freely estimated and labeled within each model, and new parameters were specified to represent adjusted mean differences between each transition pathway and the stable pathway within the same baseline profile. Statistical significance of these comparisons was evaluated based on the estimated standard errors, following the delta method (Raykov & Marcoulides, Reference Raykov and Marcoulides2004). Consistent with the effect-size calculation used for the longitudinal profile comparisons, Cohen’s d values for transition pathway comparisons were computed by dividing each adjusted mean difference by the residual standard deviation of the corresponding 1-year follow-up symptom outcome from the same covariate-adjusted model (Shieh, Reference Shieh2023). FDR correction at 5% was applied separately within each family of tests, defined as the three transition comparisons for a given symptom domain within the same baseline profile.
Missing data were addressed through full information maximum likelihood (FIML) estimation. However, missing data on the baseline symptom covariate could not be handled automatically by FIML. Therefore, cases with missing baseline internalizing or externalizing symptom data were excluded from the corresponding analyses (n = 5 for each). All analyses were conducted using Mplus version 8.0 (Muthén & Muthén, Reference Muthén and Muthén2019).
Results
Perceived family environment profiles
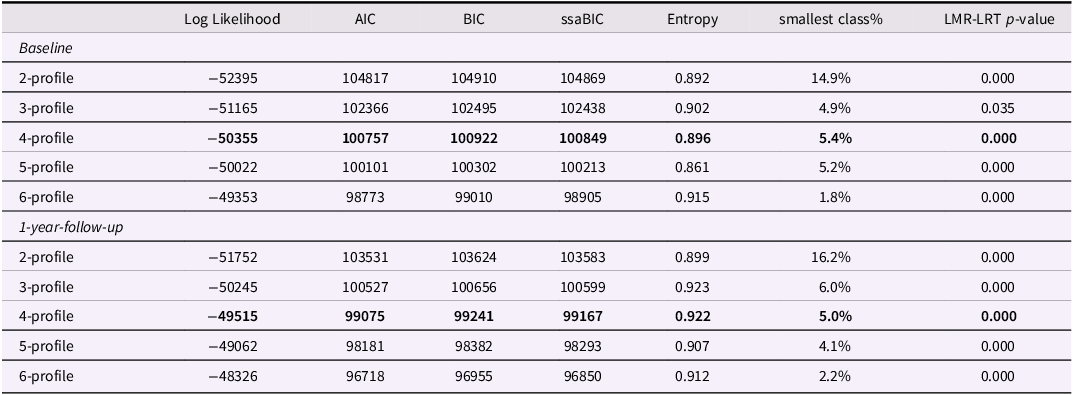
At both time points, a four-profile model was considered optimal (see Table 2 for fit indices). The LMR-LRT, together with the AIC, BIC, and ssaBIC values, indicated that model fit improved with an increasing number of profiles, favoring solutions with a greater number of profiles. However, at both baseline and 1-year follow-up, the six-profile solution contained a smallest class with less than 5% of the sample. Therefore, the six-profile solution was excluded. Additionally, at baseline, the five-profile solution exhibited the lowest entropy among all models, while the four-profile solution achieved entropy close to the highest observed values. At the 1-year follow-up, the five-profile solution again included a class with less than 5% of the sample. Consequently, the four-profile solution was selected at both time points based on a balance of model fit, entropy, class size, and interpretability.
Model fit statistics for latent profile analyses at baseline and 1-year follow-up
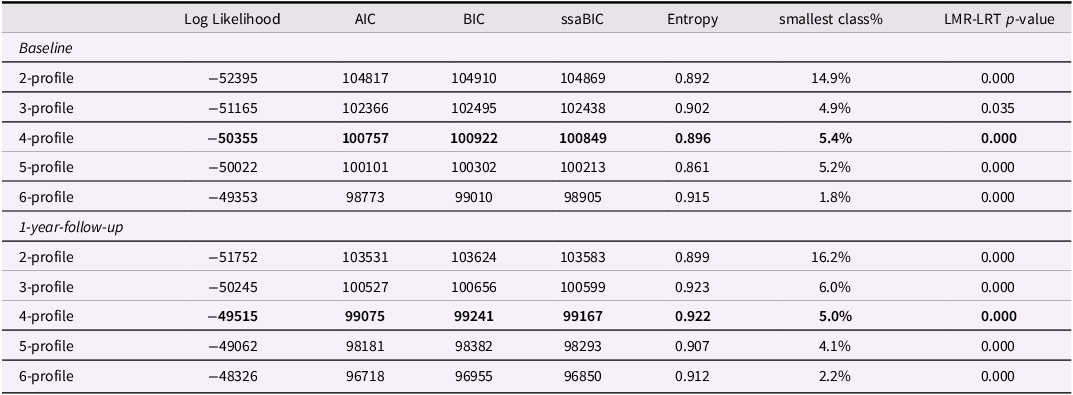
Table 2. Long description
Table 2 presents model fit statistics for latent profile analyses with two to six profiles at baseline and 1-year follow-up. Columns include log likelihood, AIC, BIC, sample-size-adjusted BIC, entropy, smallest class percentage, and the p-value of the Lo-Mendell-Rubin adjusted likelihood ratio test. At baseline, the four-profile solution had a log likelihood of -50355, an AIC of 100757, a BIC of 100922, a sample-size-adjusted BIC of 100849, an entropy of 0.896, and a smallest class of 5.4%. At follow-up, the four-profile solution had a log likelihood of -49515, an AIC of 99075, a BIC of 99241, a sample-size-adjusted BIC of 99167, an entropy of 0.922, and a smallest class of 5.0%. Although fit generally improved with more profiles, solutions with very small classes were excluded. The four-profile solution was selected at both time points based on fit, entropy, class size, and interpretability.
Note. AIC, Akaike Information Criterion; BIC, Bayesian Information Criterion; ssaBIC, Sample-Size Adjusted Bayesian Information Criterion; LMR-LRT p-value, Lo-Mendell-Rubin Adjusted Likelihood Ratio Test. Values in bold indicate the selected model used in subsequent analyses.
Figure 1 presents the standardized mean scores of perceived family environment variables for the four profiles identified at baseline, with follow-up profiles displaying similar patterns (see Figure S1). The mean raw scores for each profile at baseline and follow-up are shown in the Supplement Content (Figures S2 and S3). Consequently, the same labels were applied to profiles at both time points. The proportion of individuals in each profile is presented in Figure 2. Profile 1 (N T1 = 6,797, 69%; N T2 = 6,932, 71%) was labeled as ‘Harmonious Profile’ and reflected low perceived family conflict, high levels of parental monitoring and acceptance from both primary and secondary caregivers. Profile 2 (N T1 = 1,834, 19%; N T2 = 1,774, 18%), labeled as ‘Moderate with Two Loving Caregivers Profile’, was characterized by moderate levels of perceived family conflict, parental monitoring, and acceptance from two caregivers. Individuals in profile 3 (N T1 = 674, 7%; N T2 = 575, 6%) perceived moderate family conflict, parental monitoring, and acceptance from primary caregivers, with limited acceptance from secondary caregivers. Accordingly, this profile was labeled ‘Moderate with One Loving Caregiver Profile’. Profile 4 (N T1 = 481, 5%; N T2 = 505, 5%) was labeled as ‘Adverse Profile’, reflecting high family conflict and low levels of parental monitoring and acceptance from both caregivers.
Standardized mean scores on family environment variables for each profile at baseline. Note. All scores were converted to z scores to enable comparisons across variables. For visualization only, family conflict was reverse scored, such that greater scores indicate less family conflict.

Figure 1. Long description
Figure 1 shows the baseline profile patterns using z-scores for four indicators: family conflict, parental monitoring, primary caregiver acceptance, and secondary caregiver acceptance. The Harmonious Profile combines low conflict with high monitoring and high acceptance from both caregivers. The Moderate with Two Loving Caregivers Profile shows middle-range values across indicators. The Moderate with One Loving Caregiver Profile shows generally moderate family environment scores, except for notably lower acceptance from the secondary caregiver. The Adverse Profile shows the least favorable pattern, with higher conflict and lower monitoring and caregiver acceptance.
Transitions between perceived family environment profiles from baseline to 1-year follow-up. Note. Percentages and line thickness represent the proportions of each profile that remained in the same profile over time or transitioned to a different profile.

Figure 2. Long description
Figure 2 summarizes transitions between four perceived family environment profiles from baseline to the 1-year follow-up. Boxes show profile membership at each time point, and the widths of the connecting bands indicate the estimated probability of remaining in the same profile or moving to another profile. The Harmonious Profile was highly stable, with 85% remaining Harmonious and 11% moving to Moderate with Two Loving Caregivers. The other profiles showed more change: 42% of children in Moderate with Two Loving Caregivers remained in that profile, while 44% moved to Harmonious; 43% of children in Moderate with One Loving Caregiver remained in that profile, while 33% moved to Harmonious; and 39% of children in the Adverse Profile remained Adverse, while 30% moved to Moderate with Two Loving Caregivers and 25% moved to Harmonious.
Significant between-profile differences were observed in baseline age, sex, race, and family income. At both time points, children in the Harmonious Profile were slightly older than those in the Moderate with Two Loving Caregivers Profile, showed a higher proportion of females and higher family income than all other profiles, and had a lower proportion of non-White children than those in the Moderate with Two Loving Caregivers and Adverse profiles. By contrast, the other three profiles did not show consistent demographic differences across time points. Detailed demographic characteristics for each profile at baseline and 1-year follow-up are presented in the Supplement Content (Tables S1 and S2).
Association of perceived family environment profiles with internalizing and externalizing symptoms
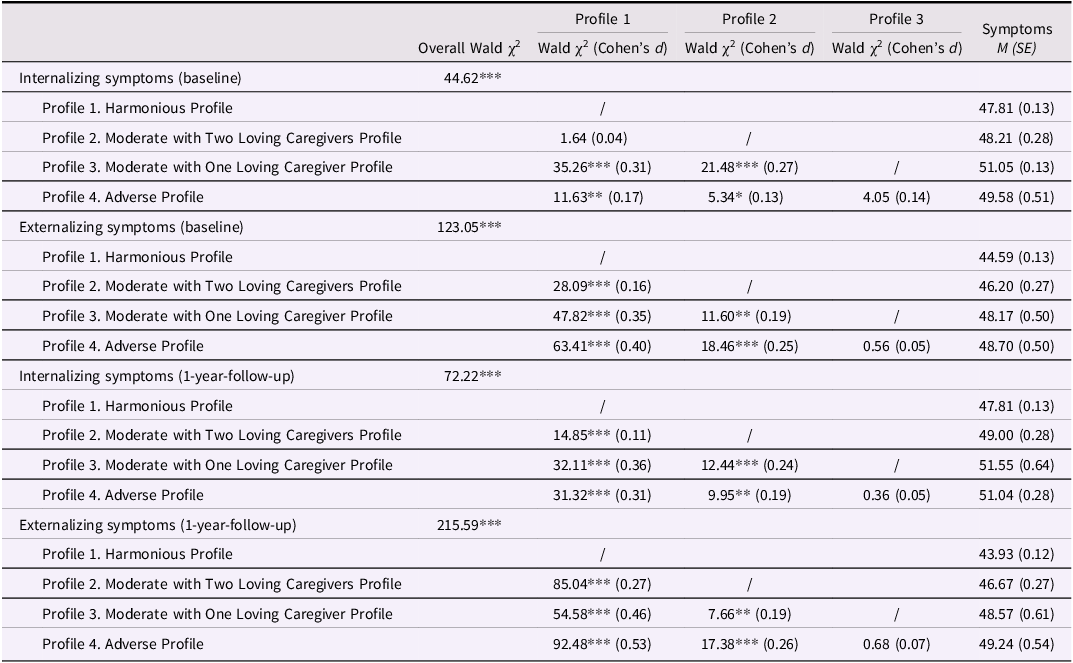
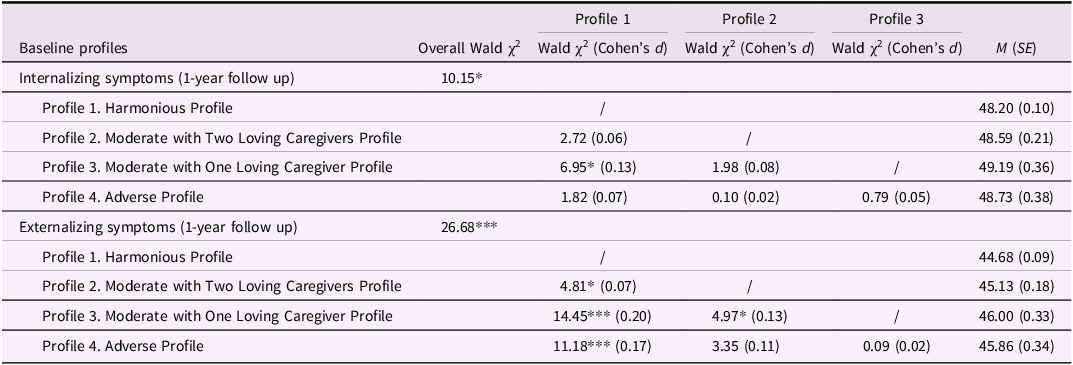
Perceived family environment profiles were both concurrently and longitudinally associated with internalizing and externalizing symptoms. The concurrent associations between perceived family environment profiles and psychological symptoms are presented in Table 3. At both time points, children in the Harmonious Profile exhibited the lowest levels of internalizing and externalizing symptoms, followed by those in the Moderate with Two Loving Caregivers Profile. For internalizing symptoms, the difference between these two profiles was significant at follow-up (d = 0.11, p < .001) but not at baseline (d = 0.04); for externalizing symptoms, the difference was significant at both time points (ds = 0.16 and 0.27, ps < .001). Meanwhile, children in the Moderate with One Loving Caregiver Profile and Adverse Profile had significantly greater severity of psychological symptoms compared to those in the preceding two profiles (ds = 0.13–0.53, ps < .05), with no significant differences between these two profiles (ds = 0.05–0.14). This pattern was consistent for both internalizing and externalizing symptoms at both time points.
Cross-sectional associations between profiles of perceived family environment and internalizing and externalizing symptoms

Table 3. Long description
Table 3 reports cross-sectional associations between perceived family environment profiles and internalizing and externalizing symptoms at baseline and 1-year follow-up. For each symptom domain and time point, the table gives the overall Wald chi-square test, pairwise Wald chi-square tests with Cohen’s d values, and estimated mean symptom T-scores for each profile. Across both time points, children in the Harmonious Profile had the lowest internalizing and externalizing symptoms, followed by children in the Moderate with Two Loving Caregivers Profile. Children in the Moderate with One Loving Caregiver and Adverse profiles generally showed higher symptom levels. Overall Wald tests were significant for internalizing and externalizing symptoms at both baseline and follow-up.
Note. * p < .05, ** p < .01, *** p < .001. The p-value here is the p-value after correction for a false discovery rate (FDR) of 5%, with the correction applied separately for internalizing and externalizing symptoms. Cohen’s d was calculated by dividing the mean difference between profiles by the total sample standard deviation of the corresponding symptom at the time of assessment (i.e., baseline SD for baseline comparisons and 1-year SD for follow-up comparisons).
There were also longitudinal associations between baseline family environment profiles and 1-year follow-up symptoms, controlling for baseline symptom levels (Table 4). For internalizing symptoms, children in the Harmonious Profile at baseline had significantly fewer internalizing symptoms at 1-year follow-up compared to the Moderate with One Loving Caregiver Profile (d = 0.13, p < .05). All other pairwise comparisons did not yield statistically significant differences. Regarding externalizing symptoms, children in the Harmonious Profile at baseline exhibited significantly fewer externalizing symptoms at 1-year follow-up compared to all other profiles (ds = 0.07–0.20, ps < .05). Children in the Moderate with Two Loving Caregivers Profile at baseline also showed significantly fewer externalizing symptoms at 1-year follow-up than those in the Moderate with One Loving Caregiver Profile (d = 0.13, p < .05), whereas children in the Adverse Profile did not differ significantly from those in either of these two profiles (ds = 0.11 and 0.02).
Longitudinal associations between profile of perceived family environment and subsequent internalizing and externalizing symptoms after controlling for baseline symptom levels

Table 4. Long description
Table 4 reports longitudinal associations between baseline perceived family environment profiles and 1-year follow-up internalizing and externalizing symptoms after controlling for baseline symptom levels. The table includes overall Wald chi-square tests, pairwise Wald chi-square tests with Cohen’s d values, and adjusted mean follow-up symptom T-scores. For internalizing symptoms, the overall effect was significant, and children in the Harmonious Profile had fewer follow-up internalizing symptoms than children in the Moderate with One Loving Caregiver Profile, with d = 0.13. For externalizing symptoms, the overall effect was significant. Children in the Harmonious Profile had fewer follow-up externalizing symptoms than children in all other profiles, with d values ranging from 0.07 to 0.20. Children in the Moderate with Two Loving Caregivers Profile also had fewer follow-up externalizing symptoms than children in the Moderate with One Loving Caregiver Profile, with d = 0.13.
Note. *p < .05, ** p < .01, *** p < .001. The p-value here is the p-value after correction for a false discovery rate (FDR) of 5%, with the correction applied separately for internalizing and externalizing symptoms. Cohen’s d was calculated by dividing the mean difference between profiles (estimated via the BCH method) by the residual standard deviation of the 1-year follow-up symptom outcome after controlling for baseline symptoms.
Test for measurement invariance across time
Fit indices for models testing measurement invariance are presented in the Supplement Content (Table S3). Although the LRT for measurement invariance test was significant (Δχ 2 = 39.8, df = 16, p <.05), the BIC and ssaBIC for the model assuming full parameter invariance (BIC: 198,002, ssaBIC: 197,878) were better than those of the measurement non-invariance model (BIC: 198,075, ssaBIC: 197,900). As such, full measurement invariance was assumed and used in subsequent steps of analysis for simplicity and interpretability (Muthén & Asparouhov, Reference Muthén and Asparouhov2022).
Transitions in perceived family environment profiles from baseline to 1-year follow-up
The transition probabilities for each profile from baseline to 1-year follow-up are presented in Figure 2. There was high stability for the Harmonious Profile, with 85% of children staying in the same profile. Individuals in the Harmonious Profile at baseline were more likely to transition to the Moderate with Two Loving Caregivers Profile (11%). Stability was much lower for the other three profiles, with fewer than half of those members at baseline (39%–43%) remaining in that same status at 1-year follow-up. Those in the Moderate with Two Loving Caregivers Profile (44%) and the Moderate with One Loving Caregiver Profile (33%) were most likely to transition to the Harmonious Profile among the transition pathways. Children in the Adverse Profile had the highest likelihood of transitioning to the Moderate with Two Loving Caregivers Profile (30%).
Longitudinal associations of latent transition pathways of perceived family environment profiles with follow-up psychological symptoms
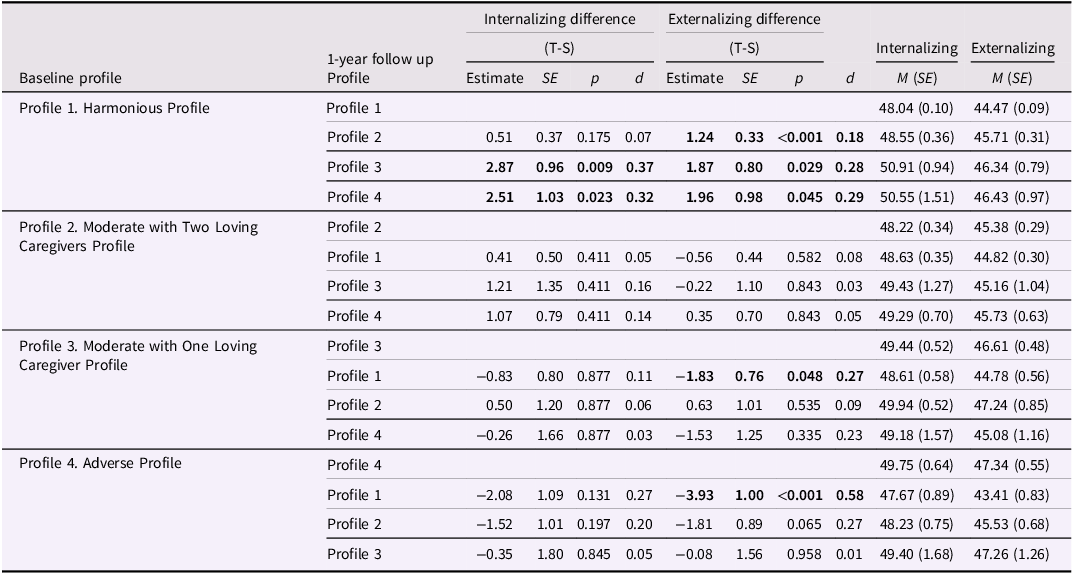
Table 5 presents the longitudinal associations between transition pathways in perceived family environment profiles and psychological symptoms at the 1-year follow-up, controlling for baseline symptom levels. All comparisons were made by comparing individuals who transitioned out of a given profile with those who remained in the same profile. The results showed that children who transitioned from the Harmonious Profile to the Moderate with One Loving Caregiver Profile or the Adverse Profile exhibited significantly greater severity of internalizing symptoms (d = 0.37, p = .009; d = 0.32, p = .023, respectively), whereas children who transitioned from the Harmonious Profile to any other profile exhibited significantly greater severity of externalizing symptoms (ds = 0.18–0.29, ps < .05). Conversely, transitions from the Adverse Profile to the Harmonious Profile, as well as from the Moderate with One Loving Caregiver Profile to the Harmonious Profile, were significantly associated with fewer externalizing symptoms (d = 0.58, p < .001; d = 0.27, p = .048, respectively).
Adjusted difference values and standard errors of internalizing and externalizing symptoms between different transitional patterns

Table 5. Long description
Table 5 reports adjusted differences in 1-year follow-up internalizing and externalizing symptoms between latent transition pathways, controlling for baseline symptom levels. For each baseline profile, children who transitioned to another profile were compared with children who remained in the same profile. From the Harmonious Profile, transitions to the Moderate with One Loving Caregiver Profile and Adverse Profile were associated with higher internalizing symptoms, with Cohen’s d values of 0.37 and 0.32. Transitions from the Harmonious Profile to any other profile were associated with higher externalizing symptoms, with d values ranging from 0.18 to 0.29. Transitions from the Moderate with One Loving Caregiver Profile or the Adverse Profile to the Harmonious Profile were associated with lower externalizing symptoms, with d values of 0.27 and 0.58. Other transitions among less favorable profiles were not significantly associated with symptoms.
Note. Significant pairwise differences (p < .05) are bolded. T-S represents the mean difference in psychological symptoms between individuals in a specific transition pathway (T) and those who remained in the same baseline profile (S, the reference group) at 1-year follow-up. The p-values reported here were adjusted to control the false discovery rate at 5%, with the correction applied separately to each set of three transition comparisons within the same baseline profile. Cohen’s d values were computed by dividing the adjusted (T–S) mean difference by the residual standard deviation of the 1-year follow-up symptom outcome from the corresponding model controlling for baseline symptoms.
Discussion
This is the largest prospective population-based study to examine the longitudinal associations between the dynamic changes in perceived family environment profiles and psychological problems in children. Our analysis identified four distinct family environment profiles. The findings revealed that children from more harmonious and supportive family environments exhibited fewer internalizing and externalizing symptoms. Except for the Harmonious Profile, the remaining three profiles demonstrated substantial transitions over the one-year period. More importantly, these transitions were found to be longitudinally associated with children’s psychological problems.
Four distinct perceived family environment profiles were identified: Harmonious, Moderate with Two Loving Caregivers, Moderate with One Loving Caregiver, and Adverse. The results indicated that individuals from more harmonious and loving environments exhibited fewer internalizing and externalizing symptoms. This aligns with previous variable-centered research suggesting that lower family conflict and higher levels of parental monitoring and acceptance are associated with fewer psychological issues among children (Edwards & Hans, Reference Edwards and Hans2015; Rothenberg et al., Reference Rothenberg, Ali, Rohner, Lansford, Britner, Di Giunta, Dodge, Malone, Oburu, Pastorelli, Skinner, Sorbring, Steinberg, Tapanya, Uribe Tirado, Yotanyamaneewong, Alampay, Al-Hassan, Bacchini and Deater-Deckard2022; Stevens et al., Reference Stevens, Vollebergh, Pels and Crijnen2007). Of particular interest, cross-sectional results showed that the Moderate with One Loving Caregiver Profile exhibited significantly higher levels of internalizing and externalizing symptoms compared to the Moderate with Two Loving Caregivers Profile but did not differ significantly from the Adverse Profile. In longitudinal analyses controlling for baseline symptoms, a similar pattern emerged for externalizing symptoms. Given that in our data, primary caregivers are mostly mothers and secondary caregivers are mostly fathers, these findings align with previous research emphasizing the distinct roles each parent plays in children’s development (Verhoeven et al., Reference Verhoeven, Bögels and van der Bruggen2012). Notably, these findings highlight that, within families involving multiple caregivers, the role of the secondary caregiver should not be overlooked. The presence of an accepting primary caregiver may not be sufficient to offset lower acceptance or other negative interaction patterns from a secondary caregiver. Nevertheless, since our sample did not include single-caregiver families, these conclusions cannot be generalized to such family structures. Future research comparing different family structures may further clarify how caregiver roles operate across diverse caregiving contexts.
The current study also contributes to the literature by adopting a longitudinal design to examine the stability and change in family environment profiles. The results indicate that the stability of the three less favorable family environment profiles is low, with stability rates ranging from 39% to 43%. Additionally, although the Harmonious Profile demonstrates higher stability, 15% of individuals (n = 1,019) in this profile experienced a deterioration in their family environment to a less favorable one. A possible explanation for this finding is that, for these 15% of individuals, the time and quality of interactions with family members may have decreased during late childhood and early adolescence (Sijtsema et al., Reference Sijtsema, Oldehinkel, Veenstra, Verhulst and Ormel2014), leading to a perception of a more negative family environment. When considering the overall pattern of transitions, one additional possibility worth noting is that changes in caregiver identity may have contributed to some profile transitions, given that nearly one-quarter of children experienced a change in their secondary caregiver over the one-year period in our sample. These findings are consistent with previous research showing that individual family environment variables can change over time (Larson et al., Reference Larson, Richards, Moneta, Holmbeck and Duckett1996; Sijtsema et al., Reference Sijtsema, Oldehinkel, Veenstra, Verhulst and Ormel2014). Our findings further emphasize that if the family environment is considered as a whole, its profiles also change over time, highlighting the dynamic nature of the family system. This dynamicity may also help explain why the present study found that longitudinal associations between baseline family environment profiles and follow-up symptoms were less pronounced than the cross-sectional associations. Given the limited stability of profile membership over time, baseline family environment profiles may capture only a snapshot of children’s family experiences, whereas later symptoms are likely shaped by ongoing family changes and other developmental influences.
Our findings further highlight that transition trajectories in perceived family environment profiles are prospectively associated with psychological outcomes in children. Notably, there is an asymmetry in transitions between the Harmonious Profile and less favorable profiles. Specifically, individuals who transitioned from the Harmonious Profile to the Moderate with One Loving Caregiver Profile or the Adverse Profile showed significantly higher internalizing and externalizing symptoms at 1-year follow-up, and transition to the Moderate with Two Loving Caregivers Profile was associated with higher externalizing symptoms. On the other hand, only transitions from the Moderate with One Loving Caregiver Profile or the Adverse Profile to the Harmonious Profile were linked to lower externalizing symptoms, and no significant reductions were observed in internalizing symptoms. This pattern suggests that children may experience more pronounced worsening of psychopathology when family environments deteriorate, but improvements in family environment appear to have more limited effects on reducing symptoms. This asymmetry underscores the importance of prevention efforts focused on preserving and strengthening family environment before substantial disruptions occur, rather than relying solely on intervention after difficulties have already emerged. However, given the limitations of our study in making strict causal inferences, further research with more controlled methodologies is needed to more rigorously examine and confirm this possibility. Additionally, these findings demonstrate the significance of tracking changes in perceived family environment profiles over time, as such changes provide meaningful insights into children’s psychological outcomes. For example, conducting long-term longitudinal monitoring of families with the Harmonious Profile could help identify those at higher risk for psychological symptoms if they transition to less favorable profiles, enabling more nuanced and dynamic screening processes.
In contrast, we did not find significant effects of transitions between less favorable family environment profiles on children’s psychological outcomes. This phenomenon may be explained by several factors. First, the transitions between less favorable family environments may not have been large enough to surpass the threshold required for significant psychological improvement or deterioration. More drastic shifts in the family environment (e.g., between “Adverse” and “Harmonious”) might be necessary to bring about noticeable changes in children’s mental health. Alternatively, less drastic changes might require a longer period of time to accumulate sufficient effects. Second, despite some differences between these less favorable family profiles, none may represent an optimal environment with sufficient stability, support, and nurturing to foster significant improvements in children’s mental health. Even when there is a slight improvement in the family environment, these families may still be lacking key resources that are essential for alleviating children’s psychological symptoms. Future research could further explore these possibilities by using more detailed assessments of family environment and longer-term tracking of family changes and their impact on children’s mental health.
This study has several strengths, including a longitudinal design and the use of population-based data from a large sample. Additionally, the incorporation of multiple reporters, with children reporting on family environment and caregivers reporting on child adjustment, strengthens the examination of associations between family environment and child outcomes by reducing concerns about shared method variance. Nevertheless, our findings need to be interpreted in light of limitations. First, although our study employed a longitudinal design, its observational nature limits our ability to establish causality. Future research could further explore whether interventions targeting specific family environment profiles could induce changes in children’s psychological symptoms. Second, despite the large sample size, participants in the present study represent children within the US, which may limit generalizability to other sociocultural contexts where family environment profiles, their transitions, and their implications for child psychological adjustment may differ. Third, to examine multiple caregivers simultaneously, we excluded individuals who reported having no secondary caregiver. As a result, our findings may not be generalizable to individuals with only one caregiver. Future research could further investigate this subset of families. Finally, the parental monitoring measure showed low internal consistency, likely reflecting its multidimensional nature. Therefore, findings based on the mean score should be interpreted as reflecting a broad composite of parental monitoring/oversight and viewed with caution. Future studies may examine different monitoring-related dimensions separately to determine whether they contribute to distinct family environment profiles and transitions.
Conclusions
In conclusion, this study provides valuable insights into the dynamic changes in perceived family environment profiles and their longitudinal relationship with children’s psychological outcomes. The findings underscore the importance of a harmonious and supportive family environment, particularly the involvement of both caregivers, in promoting better mental health outcomes. The observed transitions in family environment profiles and their associations with internalizing and externalizing symptoms highlight the need for targeted screening that tracks changes in family dynamics over time. Such screening could help identify children at risk for developing mental health issues and provide timely support to improve their psychological well-being during late childhood. Additionally, it is crucial to actively preserve and strengthen harmonious family environments, preventing disruptions before they occur.
Supplementary material
The supplementary material for this article can be found at https://doi.org/10.1017/S0954579426101783.
Data availability statement
Data used in this study were obtained from the ABCD Study, Curated Annual Release 5.1, available through the NIMH Data Archive at https://nda.nih.gov/study.html?id=2313, DOI: 10.15154/z563-zd24. Access to the data is available to qualified researchers upon application and approval. As third-party users of the ABCD data, the authors do not have permission to redistribute the individual-level data. Analysis code is available from the corresponding author upon reasonable request.
Acknowledgments
Data used in the preparation of this article were obtained from the Adolescent Brain Cognitive Development™ (ABCD) Study, held in the NIH Brain Development Cohorts Data Sharing Platform. This is a multisite, longitudinal study designed to recruit more than 10,000 children aged 9–10 and follow them over 10 years into early adulthood. The ABCD Study® is supported by the National Institutes of Health and additional federal partners under award numbers: U01DA041048, U01DA050989, U01DA051016, U01DA041022, U01DA051018, U01DA051037, U01DA050987, U01DA041174, U01DA041106, U01DA041117, U01DA041028, U01DA041134, U01DA050988, U01DA051039, U01DA041156, U01DA041025, U01DA041120, U01DA051038, U01DA041148, U01DA041093, U01DA041089, U24DA041123, U24DA041147. A full list of supporters is available at Federal Partners – ABCD Study. ABCD Consortium investigators designed and implemented the study and/or provided data but did not necessarily participate in the analysis or writing of this report. This manuscript reflects the views of the authors and may not reflect the opinions or views of the NIH or ABCD Consortium investigators.
Author contributions
Y.Yue., Conceptualization, Data Curation, Methodology, Formal analysis, Writing - original draft, Writing – review & editing; C.H., Methodology, Writing – review & editing; Y.Yu., Writing - review & editing; Z.W., Methodology; Y.-J.L.: Writing - Review & Editing, Funding acquisition; N.Y., Methodology, Writing – review & editing, Funding acquisition, Supervision; W.M., Conceptualization, Methodology, Resources, Writing – review & editing, Funding acquisition, Supervision.
Funding statement
This work was supported by the National Natural Science Foundation of China (N.Y., grant number 32500984; W.M., grant number 32200907; Y.-J.L., grant number U2336214); the Tsinghua Initiative Scientific Research Program (W.M., grant number 2022THZWJC12); and the Beijing Municipal Education Commission (grant number BJSZ2025ZD02). The funding source was not involved in the analysis of data, interpretation of results, or writing of the report.
Competing interests
The authors declare that they have no competing interests.
Pre-registration statement
The study design and analyses were not preregistered because the analyses were exploratory in nature.
AI statement
The authors used generative AI (ChatGPT with GPT-4 and GPT-5.4, OpenAI, https://openai.com/) during manuscript preparation and revision to enhance the readability and language of this article. Following the use of the tool, the authors carefully reviewed and edited the content to ensure its accuracy and quality, and they take full responsibility for the final published material.




 Open access

