Introduction
Given the importance of visual search for the survival of ancient man and other animals, it seems reasonable to presume that there would be evolutionary pressure driving the brain to implement computations that maximize the probability of target detection while minimizing the detrimental effects of distracting structures in the environment. Neural mechanisms elicit strong activity to visual properties of targets and are insensitive to irrelevant visual information arising from distractors. Numerous studies have shown that neurons in monkeys respond to target properties such as color and shape during visual search and deployment of eye movements (areas V4, Mazer & Gallant, Reference Mazer and Gallant2003; superior colliculus, McPeek & Keller, Reference McPeek and Keller2002; the frontal eye fields, Bichot & Schall, Reference Bichot and Schall1999; Sato et al., Reference Sato, Watanabe, Thompson and Schall2003; and the lateral intraparietal cortex, Ipata et al., Reference Ipata, Gee, Gottlieb, Bisley and Goldberg2006; Thomas & Paré, Reference Thomas and Paré2007). Psychophysical studies using external noise allow investigators to estimate behavioral receptive fields (classification images) of the entire organism from its behavioral choices. Such studies have shown that human perceptual and saccadic decisions during search are mediated by mechanisms that spatially integrate visual information attempting to match the spatial profile of the target (Abbey & Eckstein, Reference Abbey and Eckstein2006; Rajashekar et al., Reference Rajashekar, Bovik and Cormack2006, Eckstein et al., Reference Eckstein, Beutter, Pham, Shimozaki and Stone2007; Ludwig et al., Reference Ludwig, Eckstein, Brent and Beutter2007; Stone et al., Reference Stone, Beutter, Eckstein, Liston and Larry Squire2008). The use of external noise and statistical decision theory permit comparisons of human behavioral receptive fields to that of an optimal observer. One perplexing result is that a subset of studies has shown systematic departures of these receptive fields from the optimal linear template. A number of studies have investigated visual detection, contrast discrimination, and search of a spatial Gaussian luminance target embedded in white Gaussian noise. For this simple task, it is well known that the optimal strategy becomes a linear operation using a template that matches the Gaussian target (Peterson et al., Reference Peterson, Birdsall and Fox1954). However, numerous studies have shown that human behavioral receptive fields depart from the Gaussian principally through the presence of an inhibitory region surrounding a central excitatory region that roughly matches the target. The resulting behavioral receptive fields are generally well fit by a difference of Gaussian profiles (Abbey et al., Reference Abbey, Eckstein and Bochud1999; Eckstein et al., Reference Eckstein, Shimozaki and Abbey2002, Reference Eckstein, Pham and Shimozaki2004, Reference Eckstein, Beutter, Pham, Shimozaki and Stone2007; Solomon, Reference Solomon2002; Ludwig et al., Reference Ludwig, Eckstein, Brent and Beutter2007). This inhibitory surround leads to suboptimal performance for detection and search for a Gaussian signal in white noise, and its origin is unknown. Similar inhibitory surrounds have been found for other targets such as circular ring signals (Stone et al., Reference Stone, Beutter, Eckstein, Liston and Larry Squire2008).
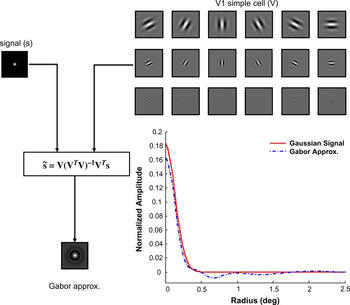
A possible explanation for the inhibitory surrounds is the band-pass nature of the human visual system and the human brain’s inability to match the Gaussian signal due to the low-frequency suppression. However, linear algebra shows that Gaussian targets used in previous studies (Eckstein et al., Reference Eckstein, Beutter, Pham, Shimozaki and Stone2007) can be well approximated by at least some sparse models of the receptive fields in primary visual cortex (Watson, Reference Watson, Bradick and Sleigh1983). For example, a Gaussian with a spatial standard deviation of 0.1376 deg can be almost entirely constructed (representing over 93% of signal energy) by using linear combinations of even-phase Gabor receptive fields with six different spatial frequencies and six different orientations (Fig. 1). Thus, the presence of inhibitory surrounds in the human behavioral receptive fields cannot be explained solely by the band-pass nature of the human visual system.Footnote 1
(Color online) Approximating a Gaussian signal with linear combinations of a set of Gabor functions of various spatial frequencies and orientations representing V1 simple cells. V is a matrix in which each column is a 2-D Gabor function arranged into a column vector, s is the Gaussian signal also arranged into a column vector, and  is the approximation reconstructed from the Gabor channels. Plots show the radial profile (averaged across angles) of the Gaussian signal and the Gabor approximation. The approximation captures more than 93% of the signal energy. Note that in a 4 AFC task under white noise, this small approximation error drops Pc from 77.2% (without using Gabor bases) to 75.7%.

A second possible new hypothesis we investigate in this paper is that the behavioral receptive fields of humans are a consequence of being optimized for search in natural images. This requires demonstration that inhibitory surrounds lead to optimized performance by a behavioral receptive field. From the perspective of natural systems analysis (Geisler et al., Reference Geisler, Perry and Ing2008), theoretical analysis of search in natural images or simulations with images with similar statistical properties might provide some explanation for the presence of inhibitory surrounds found in human observer data.
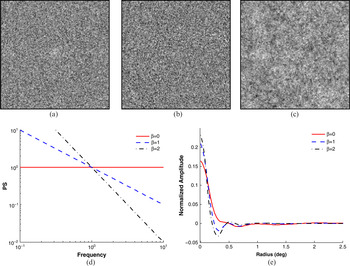
The optimal strategy for (nonwhite) stationary Gaussian noise is to use a linear template that is derived to be the signal spectrum divided by the power spectrum of the background (i.e., prewhitened matched filter; Duda et al., Reference Duda, Hart and Stork2001). A set of Gaussian-distributed noise backgrounds with a power spectrum matching the spectrum of natural images (1/f 2) contains more energy at low spatial frequencies. The resulting optimal behavioral receptive field will be a linear template with low-frequency suppression in the Fourier representation and corresponding inhibitory surrounds in the spatial domain representation (Fig. 2). However, a limitation of this analysis is that unlike filtered Gaussian noise, natural scenes are nonstationary (Torralba & Oliva, Reference Torralba and Oliva2003) and depart from the Gaussian distribution in higher order statistics (Simoncelli & Olshausen, Reference Simoncelli and Olshausen2001). It is likely that the optimal strategy for detection in natural images involves nonlinear operations; however, in this paper, we first restrict ourselves to finding the best linear template for detection of a target in natural images. We are interested in comparing how the best linear template for finding a Gaussian target in natural images compares to the human behavioral receptive fields estimated with white noise. In the second part of the paper, we investigate nonlinear pattern vision models and consider their linear components as a measurable quantity of the nonlinear mechanism that can be compared to the human behavioral receptive fields.
(Color online) Gaussian signal embedded in Gaussian-distributed backgrounds with power law power spectra  : (a) β = 0, (b) β = 1, and (c) β = 2. Note that the images have been independently scaled for display. (d) Power spectra for the three processes. (e) Radial profiles of optimal templates constrained to the Gabor receptive fields for the localization of a Gaussian target in each of three stationary processes. PS, power spectra.

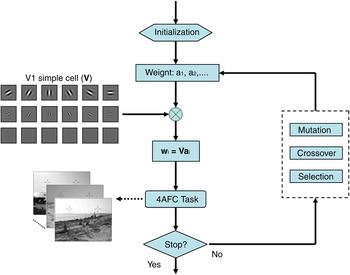
The unknown, high-order statistics of natural images (i.e., departures from Gaussian statistics) prevent us from using analytic solutions to derive the optimal linear template without making strong assumptions. The approach we take in this paper is to use an iterative optimization technique to find the best linear template for localization of a Gaussian target in natural images. We use the genetic algorithm (GA; Holland, Reference Holland1975) that can be taken as a metaphor for the effect of evolutionary processes (Bond & Kamil, Reference Bond and Kamil2006) on behavioral receptive fields. In the implementation of this method to our problem, a computer-simulated population of different behavioral receptive fields is created, and their performance localizing the target in a test image data set is evaluated. To reduce computational complexity, the target appears at one of four locations in the image (four alternative forced choice [4 AFC]). The behavioral receptive fields leading to higher performance in the 4 AFC task are associated with a higher probability of populating the subsequent generation through reproduction. The next generation is also subjected to the genetic operations of mutation and crossover. Fig. 3 outlines the logic behind the GA as applied to our current task: search for a Gaussian target in one of four locations in a set of natural images. Due to the computational complexity of exploring solutions in a high-dimensional space, we restrict the possible behavioral receptive fields to be linear combinations of Gabor functions, which are used as a model of simple cells in area V1. After many generations, the evolved behavioral receptive fields will, in theory, converge to optimal or near-optimal templates.
(Color online) Schematic diagram of the virtual evolution used for the GA to find an optimal linear behavioral receptive field for localization of a Gaussian target embedded in natural images.

We validate the GA using various computer-generated noisy backgrounds with known statistical properties. For these synthetic backgrounds, the result from the virtual evolution can be directly compared to the optimal linear template derived from analytic solutions to verify that the GA results in near-optimal templates. The methods are then applied to a database of 400 natural scenes to evaluate inhibition in the optimal behavioral receptive field.
The Results section describes our GA validation results with filtered noise and our main finding that the virtually evolved template for search of the Gaussian target in the natural scenes contains a strong inhibitory surround. In the Discussion section, we consider and investigate whether the finding of resulting inhibitory surround for the best linear template would be altered if we considered nonlinear responses in the simple cells, a target that occluded the images rather than an additive target, and a set of natural scene images acquired with a calibrated system.
Theory
Linear observers and decision variables
This section describes common linear models based on statistical decision theory to make decisions in forced-choice localization tasks under the assumption of a linear template (Burgess et al., Reference Burgess, Wagner, Jennings and Barlow1981; Barrett, Reference Barrett1990; Eckstein et al., Reference Eckstein, Abbey, Bochud, Beutel, Kundel and van Metter2000; Beutter et al., Reference Beutter, Eckstein and Stone2003; Murray et al., Reference Murray, Bennett and Sekuler2005). Let the vector g denote a two-dimensional (2-D) image patch. We refer to a signal-present patch as  and to a signal-absent patch as
 , i = 1, 2, …, M − 1, in an M-alternative forced-choice (MAFC) task. In this work, we use 4 AFC exclusively, and hence, M = 4. In a forced-choice trial, a signal, s, is added to the image background, b0, in one of four possible locations chosen at random. Therefore,

For target-absent locations, the image patch consists of one of the other possible locations,

Note that s is a deterministic vector, and image backgrounds are considered to be random.
The linear model observer is assumed to make a decision in each MAFC trial by forming a decision variable for each of the M image patches. The image patch that produces the largest decision variable is chosen as the one containing the signal. For a linear observer, the decision variable, λ, is a linear function of the image patch arranged as a column vector,  , where D is the size of the patch. Therefore, the decision variable can be written as an inner product between g and a vector of weights, w,

When presented with  and
 , the observer forms M decision variables
 and
 . The observer makes a correct decision if
 and an incorrect decision otherwise. The trial outcome, o, is defined to be one when a correct decision is made and zero when an incorrect decision is made,

where the step function is one for arguments greater than zero and zero otherwise. The most general measure of performance is the proportion of correct responses,  . In terms of the trial score, o, the proportion correct is defined as the mathematical expectation of trial outcomes,

In practice, we estimate the proportion correct by the average outcome over a finite set of trials, or when the backgrounds are Gaussian-distributed, we can compute Pc from closed-form expressions (see, e.g., eqn. 12 below).
Linear templates and channel models
We consider templates that are constructed from a linear combination of a set of channel features (i.e., features with a specified spectral profile) that we will refer to as channels. We describe a set of channels with a matrix  , where each column represents a 2-D channel arranged as a column vector. The channelized model observer has to operate on the output of the channels VT g instead of the image itself. The decision variable λ in eqn. (3) can be rewritten as:

where  is a vector of channel weights. The effective template w is a linear combination of the channels weighted by a,

In the context of a linear channel model, the goal of the present paper becomes to find the optimal channel weights a. This preprocessing of the image into channel outputs significantly reduces the spatial complexity because the number of channels is much smaller than the dimensionality of image patches.
Statistically stationary Gaussian backgrounds
Statistical stationarity refers to backgrounds in which the mean and variance are the same at every pixel, and the covariance between any two pixels only depends on their relative position. The stationarity assumption greatly simplifies computation of the template and allows implementation within the Fourier framework. For the MAFC task, stationarity guarantees that b0 and bi at different spatial locations share the same statistical properties.
If the backgrounds have Gaussian statistics with mean intensity μ and covariance Σ, the signal-present and signal-absent image patches will be Gaussian with the same covariance Σ but different means μ and μ + s.
In this paper, we considered the statistical distribution of a subset of V1 simple cells modeled as Gabor channels expressed in the matrix V. Each column of V is a 2-D Gabor patch arranged as a one-dimensional column vector. The covariance of the channel responses is given by VT ΣV, and the means are VTμ and VT(μ + s), respectively. Based on the theory of signal detection (Duda et al., Reference Duda, Hart and Stork2001), the optimal channel weight vector a is derived from Fisher’s criterion as

Accordingly, the effective linear template in the image domain is expressed as the best linear combination of channels (Myers & Barrett, Reference Myers and Barrett1987; Eckstein et al., Reference Eckstein, Abbey, Bochud, Beutel, Kundel and van Metter2000; Abbey & Barrett, Reference Abbey and Barrett2001):

We note that it is inefficient to directly compute eqns. (8) and (9) for patches of even modest size because the covariance matrix Σ (D × D) is too large to be used in direct computations. To circumvent this problem, we use the discrete Fourier transform (DFT) representation of a stationary covariance matrix to compute  without explicitly forming Σ. The channel covariance matrix is given by

where the columns of  are the DFT of the Gabor patches in V. The power spectrum, S, is derived from applying the DFT to diagonalize Σ, which allows for rapid computation of eqn. (10).
Proportion correct, Pc, can be calculated through Monte–Carlo simulations and samples using eqn. (5), which tallies the proportion of trials in which the template correctly identifies the image patch containing the target. However, when a linear template acts on an ensemble of backgrounds (bi) defined by a Gaussian distribution, the proportion correct can be directly calculated using analytic solutions (Green & Swets, Reference Green and Swets1966), related to the detectability index, d′, defined as (Duda et al., Reference Duda, Hart and Stork2001):

In this case, the proportion correct of the MAFC task is determined from the detectability index by calculating the probability that the internal response to the target location will take the maximum response among the M template responses (one for each patch image):

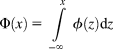
where  is the standard Gaussian probability density function and Φ() is the standard Gaussian cumulative distribution function.

Given the signal profile, Gabor channels, and the power spectrum of background, one can readily compute the theoretical value of the proportion correct (Pc) based on eqns. (11) and (12).
Nonlinear channelized model
In this section, we describe the inclusion of channel nonlinearities in the model (Foley, Reference Foley1994; Watson & Solomon, Reference Watson and Solomon1997; Zhang et al., 2006). The linear model (eqn. 6) involves taking the dot product of channels (vi, the columns of V) with the image data g:  .
We implemented two nonlinear channelized functions. For simplicity, the subscript i is dropped below indicating a generic channel response, r.
Excitatory (E) nonlinearity refers to the accelerating response of channels to the visual stimuli. Typically, an accelerating neuronal response is modeled with an exponent. Mathematically, the response undergoes power law nonlinearity with exponent p,

where the function sign reattaches the sign of the response after elevating it to the pth power. We use a common setting of p = 2.
Excitatory and inhibitory (EI) nonlinearity refers to the suppressive response of channels to the visual stimuli. This model incorporates an excitatory nonlinearity that is divisively inhibited by a pool of responses from other neurons/channels (Foley, Reference Foley1994; Watson & Solomon, Reference Watson and Solomon1997). Divisive inhibition has been considered as essential feature to describe the characteristics of human striate cortical neurons. The EI nonlinear model is mathematically expressed as

where H is a Gaussian convolution kernel with σH and 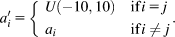 represents pooling in inhibitory pathways. Responses are pooled over different channels in the inhibitory term through the convolution with the Gaussian kernel H. Based on Zhang et al. (2006), we set p = q = 2, d = 0.5, and σH = 0.8.
These nonlinear models generate decision variables for the localization task as a weighted sum of E or EI responses. The goal of the GA is to determine the optimal weights.
Natural images
An important characteristic of natural images is that the image statistics change with spatial location (e.g., Torralba & Oliva, Reference Torralba and Oliva2003). The background bi may not share the same statistics at each of M image patches. Furthermore, natural images are not Gaussian-distributed. Therefore, a linear template calculated from analytic expressions, which maximizes the index of detectability, will not necessarily maximize proportion correct because departures from Gaussian statistics invalidate the assumption of eqn. (12). Thus, other methods are needed to estimate the template that maximizes performance.
In this paper, we resort to a computational approach, GAs, which is a searching technique inspired by evolutionary biology. GAs have been shown to solve linear and nonlinear problems by exploring all regions of the state space and exponentially exploiting the promising areas through selection, mutation, and crossover (Holland, Reference Holland1975). Fig. 3 shows the scheme of standard GAs. For any GA, a chromosome representation is needed to describe each individual in the population of interest. There are two possible types of representations: binary and real-valued GAs. In the present work, we use the natural representation: real-valued GAs, which have been shown to be more efficient in finding optimal or near-optimal solutions (Michalewicz, Reference Michalewicz1994). For our application, each individual in the population consists of a set of weights for each of the Gabor channels. The general properties of GA are the following:
1. The initial population is generated randomly and then evaluated through a fitness function. In our case, the fitness is measured as the proportion correct of the MAFC task as
(17)
where oj is the score for the jth trial and N is the total number of MAFC trials.
2. GAs search the solution space of a function through the use of simulated evolution, that is, the survival of the fittest strategy. The best or fittest individuals of any population tend to be selected and survive to the next generation, thus improving successive generations. There are several schemes for the selection process (Michalewicz, Reference Michalewicz1994). In this paper, we use roulette wheel selection (Holland, Reference Holland1975). This approach assigns a probability of selection, Pi, to each individual based on its fitness value:
, where is proportion correct for the ith individual. Then, a set of random numbers is generated and compared against the cumulative probability, . More specifically, for a uniform random variable, U(0, 1), if , the individual, i, will be selected and survive to the next generation. Individuals are selected randomly with replacement until the next generation is full.3. Before evaluating the fitness of the next generation, the processes of mutation and crossover are allowed to act on the individuals. Given two individuals, which are represented as weight vectors
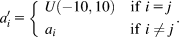
and , we apply uniform mutation and arithmetic crossover to generate the final parameter value of the individuals, a′ and b′, respectively. Uniform mutation randomly selects one parameter value, aj, and sets it equal to a uniform random number U(−10, 10):(18)Arithmetic crossover produces two complimentary linear combinations of the parents:
(19)(20)where τ = U(0, 1) is a uniform random number.
4. The GA moves from generation to generation until a termination criterion is met. The most often used criteria include (1) a predefined maximum number of generations and (2) no improvement of the fitness over a number of generations. In this work, we split the data set of images into two parts: 90% of the images to derive the template with GA (training) and the remaining 10% of the images to assess performance (Pc). We ran the GA 100 times, and each run started with 1000 random samples of channel weights. We set the maximum number of generations to 10,000. This large number of generations is used to allow the algorithm to escape from local minimum.

 , where
 is proportion correct for the ith individual. Then, a set of random numbers is generated and compared against the cumulative probability,
 . More specifically, for a uniform random variable, U(0, 1), if
 , the individual, i, will be selected and survive to the next generation. Individuals are selected randomly with replacement until the next generation is full.
 and
 , we apply uniform mutation and arithmetic crossover to generate the final parameter value of the individuals, a′ and b′, respectively. Uniform mutation randomly selects one parameter value, aj, and sets it equal to a uniform random number U(−10, 10):


Materials and methods
Natural image data set
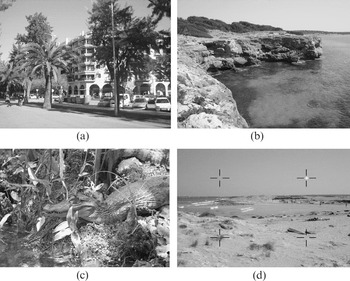
Images were obtained from the LabelMe data set (Russell et al., Reference Russell, Torralba, Murphy and Freeman2008), a Web-based image collection that allows researchers to label images and share the annotations with others. It is a very large database containing more than 15,000 images and spanning many object categories. We manually chose 400 images with high resolution (not less than 480 × 640 in pixels). The content of the images varied from landscapes to interiors. In the selection process, we purposely avoided portrait pictures of people and animals to avoid narrow depths of field in the images (Drewes et al., Reference Drewes, Wichmann and Gegenfurtner2006). Fig. 4 shows three sample images. For simplicity, color images were converted to gray scale by averaging across three color channels.
(a)–(c) Examples of the natural images used in this study. The four possible target locations are indicated with fiduciary marks. (d) Note that the target (additive Gaussian luminance profile in top right location) has been exaggerated for display.

Synthetic images with stationary Gaussian background
To evaluate the accuracy of the GA for finding an optimal linear template, we investigate localization task with Gaussian backgrounds. In this case, the optimal linear template is known as shown in eqn. (9). We first compute the power spectrum  , where β = 0, 1, 2. To avoid the singularity at f = 0, the direct current (DC) component is set to a nominal frequency of half the first harmonic. We then generate Gaussian backgrounds by filtering white noise using a filter with a frequency response given by the square root of the power spectrum.
Visual task
The task was a 4 AFC localization where the possible target locations were placed on the corners of an imaginary square with sides subtending a visual angle of 4.128 deg (at 50 cm viewing distance). The target/signal in this study was a spatial Gaussian luminance increment, parameterized by maximal amplitude, E 0, and the spatial standard deviation, σ. As a function of spatial location (x, y) from the center of the Gaussian circle, the luminance increment can be mathematically expressed as:
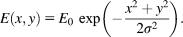
In this study, σ was set at four pixels (or 0.1376 deg), and the signal amplitude was set at E 0 = 5.
Gabor channels
Because images have such a high dimensionality, a full optimization over the pixel domain is infeasible. Instead, we used a set of channel features to reduce degrees of freedom in the optimization to a manageable level. We applied a subset of Gabor functions that model the spatial frequency and orientation tuning of simple cells in the primary visual cortex (Watson, Reference Watson, Bradick and Sleigh1983). The Gabor function proposed by Marcelja (Reference Marcelja1980) and Daugman (Reference Daugman1985) is parameterized by σx and σy, the standard deviations of the Gaussian envelope in the x and y directions; k, the spatial frequency in cycles per degree; φ, the preferred spatial phase; and θ, the orientation. The Gabor function is mathematically expressed as

where


In our study, σx = σy, φ = 0, and θ varies from 0 to 180 deg in steps of 30 deg. Thus, we only use a subset of functions centered on the possible target locations and with even phase.Footnote 2 Note that σx and k determine the spatial frequency bandwidth γ, which is the width (full width at half max) of the spatial frequency tuning curve measured in octaves. More precisely,
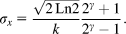
Based on previous research (Watson, Reference Watson, Bradick and Sleigh1983), we set the bandwidth to γ = 1. Six spatial frequencies are used, k = 0.5, 1, 2, 4, 8, and 16 cycles/deg, with width parameter set according to eqn. (23). A total of six spatial frequencies (k) and six orientations (θ) result in a total of 36 Gabor channels.
GA methodological details
We implemented the GA approach to estimate the optimal linear template (w) using the Genetic Algorithm Optimization Toolbox (GAOT) (Houck et al., Reference Houck, Joines and Kay1995). The GAOT provides a computational environment for simulated evolution in Matlab using either binary or real-valued representations. We chose a real-valued representation with bound (−10, 10), roulette wheel selection, arithmetic crossover, and uniform mutation (Castella et al., Reference Castella, Abbey, Eckstein, Verdun, Kinkel and Bochud2007). A generation consisted of 1000 individual parameter settings, each competing on the basis of optimal task performance. The crossover parameter was set to operate 20 times per generation, and mutation was set to operate twice per generation. For both the 400 natural images and the 1000 synthetic stationary noise backgrounds, we used 90% of all images to derive templates with GA and assessed the proportion correct of the derived template with the remaining 10% of the images. All individuals were randomly initialized with a uniform distribution (−10, 10) and allowed to evolve over 10,000 generations. We repeated the entire GA process 100 times with different random initial values.
As an iterative optimization algorithm, GA is computationally expensive. To handle this computational load, we utilized the grid computing facility at the University of California, Santa Barbara, which consists of several computational clusters. Among these clusters, we used QSR (Quantum Science Research Lab at HP) installed with Red Hat Enterprise Linux 4 and Matlab R14 (MathWorks Inc., Natick, MA). It has 32 compute nodes and 4 gigabytes memory per node, and each node is running on an AMD Opteron quadcore 2.0 GHz (AMD Inc., Sunnyvale, CA). A single run of the GA (with 10,000 generations) was typically completed in approximately 36 min for the 400 natural images and 63 min for the 1000 synthetic image backgrounds.
Evaluation of estimated templates
To summarize the estimated templates and gauge the degree of inhibition, we calculated their radial profiles, which is the normalized integrated intensity in concentric circles around the image center. This approach was used to characterize the templates estimated from natural images as well as to compare templates estimated from synthetic images to the theoretically optimal template. To measure the similarity between the radial profile of an estimated template, r, and the theoretical optimum, r′, we computed a normalized correlation, ρ, between them:

In addition, we compared the associated proportion correct in the 4 AFC for the estimated and theoretical templates.
Results
Validation of GA using synthetic stationary noise backgrounds
To examine the validity of the GA for approximating the optimal linear template, we investigated 4 AFC search tasks for the Gaussian signal added to stationary Gaussian noise backgrounds with noise power spectra given by  , where β = 0, 1, 2. A value of β = 0 corresponds to white noise, while values of β = 1, 2 correspond to low-pass correlated noise, which is more similar to the power spectra of natural images (β = 2; Rudermant, Reference Rudermant1994; Torralba & Oliva, Reference Torralba and Oliva2003).
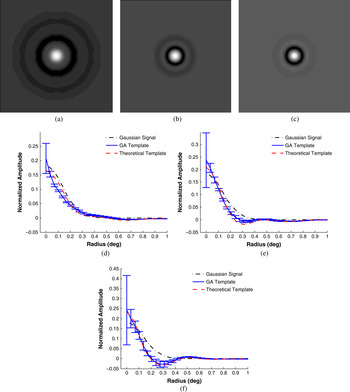
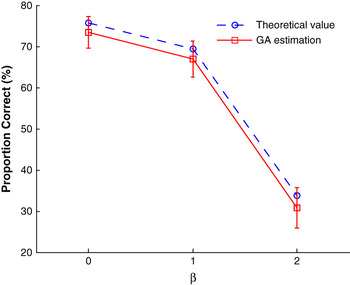
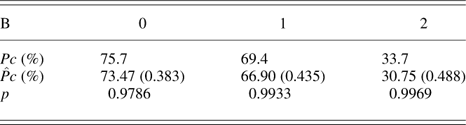
Fig. 5a–5c shows the 2-D estimated behavioral receptive fields for the three noisy backgrounds obtained with the GA. Fig. 5d–5f shows the radial profiles (averaged across all angles) of the behavioral receptive fields obtained from the GA. For comparison, the plots show the radial profile of the Gaussian signal and that of the theoretical optimal templates calculated from analytic expressions (eqn. 9). Results show that the strength of the inhibitory surrounds increases (first darker surrounding annulus) with increasing β. There is good agreement between the optimal linear templates derived from analytic solutions and those estimated through the process of virtual evolution. The correlation coefficients, ρ, between the average radial profile of estimated behavioral receptive fields and the radial profile of the theoretical template range from 0.9786 to 0.9969 (Table 1). Fig. 6 shows performance detecting the Gaussian signal for the linear template derived from analytic expressions and that of the templates estimated from the GA. The performance decrease with increasing β is expected given that the Gaussian signal has most of its energy in low frequencies where increasing β results in more noise. Overall, performance across theoretical and estimated templates is similar with a slight advantage for the theoretically derived templates (Table 1). This small discrepancy is expected given that the estimated template is based on a finite number of sample images. In summary, our results verify that for the synthetic backgrounds, the virtual evolution can result in optimal or near-optimal linear templates.
(Color online) Theoretical template and radial profile of the estimated templates in backgrounds with power spectrum  . (a)–(c) Optimal templates when β = 0, 1, 2 (images have been scaled to span the full dynamic range). (d)–(f) Radial profiles of optimal and estimated templates when β = 0, 1, 2. Note that error bars are the standard error across 100 behavioral receptive fields obtained from 100 independent runs of the GA.

(Color online) Comparison of performance in the 4 AFC task for the best linear template derived from analytic solutions (theoretical performance—blue) versus performance of the best linear template estimated using virtual evolution. Proportion correct across three types of backgrounds with power spectrum  .

Performance assessment of theoretical and evolved optimal templates in backgrounds with power law power spectra 
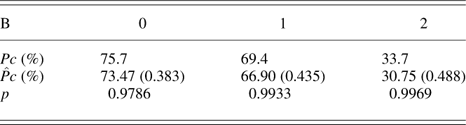
β is the exponent in the expression for the power spectra of the background. Pc (%) is proportion correct  calculated for the theoretical optimal template from eqns. (11) and (12). Pc (%) is the estimated proportion correct for the evolved template calculated from samples (eqns. 4 and 5), and ρ is the correlation between the theoretically derived optimal template and the evolved optimal template (eqn. 24)
Estimation of optimal linear template for natural images
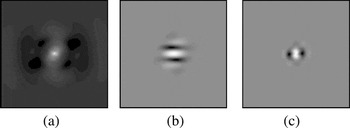
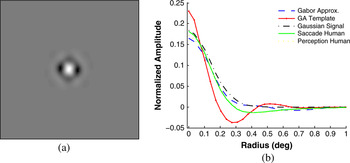
We subsequently applied the GA to evolve a weighted sum of Gabor channels in natural images. To the extent that the weights are optimal, the GA yields the behavioral receptive field that best localizes a Gaussian signal in natural images. Fig. 7 shows examples of an evolving behavioral receptive field: (a) an initial random combination of Gabor channels, (b) an evolving template after 3000 generations, and (c) a final template after 10,000 generations. Fig. 8a shows the average estimated template across 100 GA runs and its radial profile. For comparison, Fig. 8b also shows the radial profiles of the Gaussian signal and the Gabor channel approximation to the Gaussian signal. Results show that the estimated best linear template contains an excitatory center and a strong inhibitory surround that is larger than that present in the Gabor channel approximation to the Gaussian signal. Fig. 8 also shows the radial profile of fits to the estimated human behavioral receptive fields for detecting the same Gaussian signal in white noise for saccadic and perceptual decisions from a previous publication (Eckstein et al., Reference Eckstein, Beutter, Pham, Shimozaki and Stone2007).
An example of the virtual evolution of a behavioral receptive field localizing a Gaussian target in natural images: (a) initial template, (b) evolving template, and (c) final template.

(Color online) (a) The estimated best linear behavioral receptive field for localizing a Gaussian target in natural images (average across 100 GA runs) and (b) its radial profile compared with radial profiles of a Gaussian signal, the Gabor approximation to the Gaussian signal (Gabor Approx.), and the fit to human behavioral receptive fields from a previous publication (Eckstein et al., Reference Eckstein, Beutter, Pham, Shimozaki and Stone2007; saccade and perception).

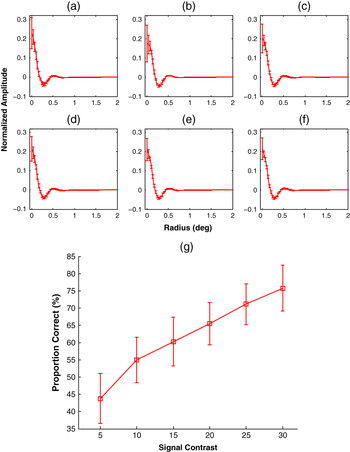
To determine whether the estimated template varies with the signal amplitude, we applied the GA to 4 AFC tasks in natural images with a Gaussian target at one of six different signal amplitudes. Fig. 9a–9f shows that the best receptive field constructed from a linear combination of Gabor channels varies little with signal amplitude and always shows an inhibitory surround. Fig. 9g shows proportion correct with increasing signal amplitude for the best linear templates in the 4 AFC task.
(Color online) Radial profiles of the best behavioral receptive fields estimated for 4 AFC tasks in natural images with increasing signal amplitude E0: (a)–(f) 5–30 in steps 5. (g) Proportion correct for the best behavioral receptive field (4 AFC performance) with increasing signal amplitude E0.

Estimation of linear component of nonlinear models for natural images
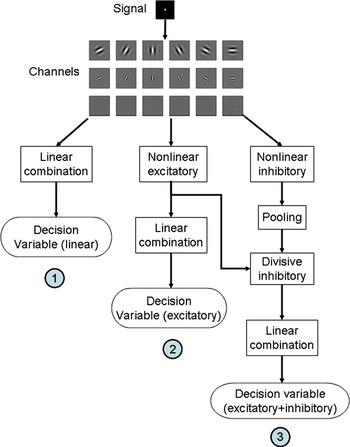
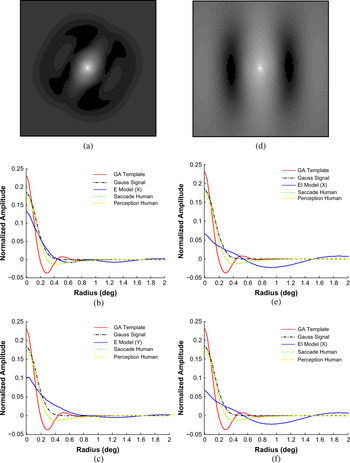
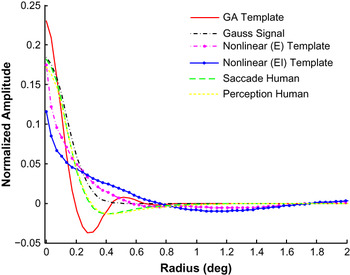
There has been ample work demonstrating that neurons in various areas including the lateral geniculate nucleus and the primary visual cortex (V1) respond in a nonlinear manner to visual stimuli. However, until now we have only considered linear operators on the image data. Although it is impossible to consider all nonlinear models, here we evaluated a model that uses a linear combination of Gabor channels with nonlinear responses (Foley, Reference Foley1994; Watson & Solomon, Reference Watson and Solomon1997; Zhang et al., 2006) to assess the impact of channel nonlinearities on the estimated linear behavioral receptive field. We measured the effect of including an excitatory channel response nonlinearity and also a divisive inhibitory nonlinearity in which the activity of a channel is reduced by the activity of channels with similar spatial frequency and orientation (Foley, Reference Foley1994; Watson & Solomon, Reference Watson and Solomon1997; Zhang et al., 2006; see Fig. 10 for a schematic of the model). We evolved the linear weights combining the channel responses to maximize accuracy detecting the Gaussian signal in natural images. Because the model is nonlinear, estimating its linear component also requires an iterative technique (e.g., Ringach et al., Reference Ringach, Hawken and Shapley2002; Castella et al., Reference Castella, Abbey, Eckstein, Verdun, Kinkel and Bochud2007). We estimated the linear component by finding the linear combination of channels that maximizes the agreement with the trial choices of the nonlinear model in 4 AFC with 400 images. The method is akin to the approach used to estimate classification images of human observers from trial-to-trial decisions. Appendix A describes details of estimating the linear template for the nonlinear model (Castella et al., Reference Castella, Abbey, Eckstein, Verdun, Kinkel and Bochud2007). Fig. 11 shows the 2-D linear receptive fields estimated for the nonlinear models. The behavioral receptive fields for both the excitatory (left image) and the excitatory/inhibitory (right image) nonlinear models show strong anisotropies. Thus, we report the radial profiles of the templates along the main orientationFootnote 3 and its orthogonal orientation (Fig. 12 shows radial profiles averaged across all angles for the templates). Fig. 11b–11e shows the radial profiles for the linear components of the nonlinear model with excitatory (Fig. 11b and 11c) and excitatory/inhibitory (Fig. 11e and 11f) components. The excitatory nonlinearity tested changed the inhibitory surround of the linear template along both directions (main vertical orientation, 31 deg, and the orthogonal direction). For the case of the excitatory and inhibitory nonlinearities, the behavioral receptive field shows a widened inhibitory surround in the horizontal direction.
(Color online) Structure of the channel model considered in the paper: (1) linear components only, (2) nonlinear components (excitatory), and (3) nonlinear components (excitatory and inhibitory).

(Color online) Linear behavioral receptive fields for two nonlinear channel models. (a) Linear template approximating the model with a channel excitatory nonlinearity; (b) and (c) radial profiles along the main orientation (Y) of the template and its orthogonal direction (X); (d) Linear template approximating the model with excitatory and inhibitory nonlinearities; (e) and (f) radial directional profiles along main orientation and orthogonal orientation.

(Color online) Radial profiles of linear behavioral receptive fields for two nonlinear channel models.

Discussion
Comparison of optimal linear template for natural images versus estimated human behavioral receptive fields in white noise
The purpose of the present work was to assess whether the suboptimal inhibitory surrounds in the behavioral receptive fields of human observers when searching for targets in white noise could be a by-product of the brain’s adaptive strategy to optimize search performance for natural scenes. To test this hypothesis, we estimated the best linear template during the search of a Gaussian signal in natural images using a GA. Our results show that the optimal linear template for natural images does result in inhibitory surrounds. However, Fig. 8 also reveals substantial differences with the estimated human behavioral receptive fields (averaged across six observers) in white noise (Eckstein et al., Reference Eckstein, Beutter, Pham, Shimozaki and Stone2007). In particular, the inhibitory surround is less pronounced in the human observer templates. One possible explanation for this discrepancy is that for search in white noise, humans might be attempting to minimize the effect of the inhibitory surrounds in trying to match the Gaussian signal and optimize their performance. For example, previous studies have shown that to some extent, human observers can adapt their template to the statistical properties of the background, thus resulting in different degrees of an inhibitory surround (Abbey & Eckstein, Reference Abbey and Eckstein2007). Another possible explanation for the discrepancy is the presence of nonlinearities in the human visual system. To test this possibility, we first used GA to obtain the best linear combination of V1 cells with nonlinear responses. We then estimated the linear component of this nonlinear model as a measurable quantity that can be compared to the human behavioral receptive fields. Our results suggest that the inclusion of nonlinearities can have strong effect on the shape of the estimated linear template but importantly preserves the inhibitory surround. Although the considered nonlinear models could not fully account for human behavioral receptive fields for search of a Gaussian in white noise, the results poses the possibility that nonlinearities might account to some extent for the discrepancies between the human behavioral receptive fields for white noise and optimal linear template for natural images. It is possible that other nonlinear models’ fields (e.g., Carandini & Heeger, Reference Carandini and Heeger1994; Geisler & Albrecht, Reference Geisler and Albrecht1997) not tested in this paper might be better at accounting for the human linear behavioral receptive. Also, we did not attempt to optimize the nonlinear parameters of the nonlinear models to maximize search performance. Joint optimization of the channel weights and nonlinear model parameters would result in high dimensionality and difficulties in GA convergence. Finally, we did not consider nonlinear strategies that use knowledge about the background to more efficiently detect targets. The proposed models have no knowledge about the structures in the backgrounds and use a fixed linear template for all images and locations. However, previous studies using synthetic backgrounds have shown that human observers can use nonlinear strategies that incorporate knowledge of the background to outperform models that use a single fixed best linear template (Eckstein et al., Reference Eckstein, Pham, Abbey and Zhang2006; Zhang et al., 2006).
Generalization to other image databases and effects of camera calibration
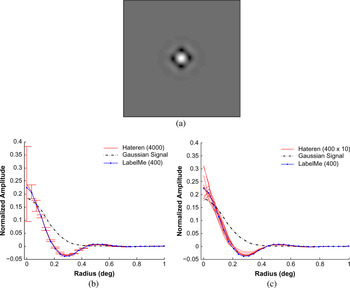
A potential issue in our methodology is that the relationship between the nominal gray value in our images collected from the LabelMe database and the actual luminance of the scenes is unknown. Arguably, this limitation is present in many previous studies analyzing natural images and is a potential source of error in any analysis of natural images with uncalibrated cameras. In addition, we do not know whether the sample of images (400 from LabelMe) is sufficiently large to generalize to other image sets. To test whether our results would drastically change if we used images that were linear with the luminance arriving to the human eye and generalized across image sets, we repeated our virtual evolution methods using a larger data set of 4000 natural images acquired with a Kodak DCS420 camera (see Appendix B for details; van Hateren & van der Schaaf, Reference van Hateren and van der Schaaf1998). Fig. 13a shows the 2-D optimal linear templates for the calibrated image set. Fig. 13b shows the radial profiles (averaged across all angles) of the estimated optimal linear templates for the 4000 images from the van Hateren and van der Schaaf data set. For comparison, Fig. 13b also shows the estimated optimal linear template for the 400 LabelMe images. The new estimated optimal linear templates show inhibitory surrounds comparable to those found in the optimal templates estimated with the smaller LabelMe database. Fig. 13c shows good agreement in the linear templates separately estimated for 10 sets of 400 images. Together, the results show that the presence of inhibitory surrounds in the best linear templates is robust to other data sets and generalize to calibrated image sets.
(Color online) (a) Best linear template; (b) radial profile derived from the data set of 4000 calibrated natural images (van Hateren & van der Schaaf, 1998); (c) radial profiles derived from 10 subsets, each of which has 400 calibrated Hateren images. Comparison with Fig. 9 shows that the templates are similar for calibrated and uncalibrated image sets (400 LabelMe images).

Generalization beyond additive signals
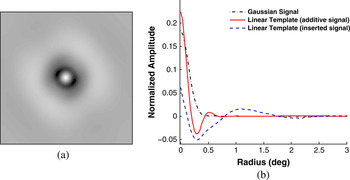
Another potential issue in our analysis is the additive process by which the Gaussian signal is placed in natural image backgrounds. It could be argued that this is not a realistic process for combination of targets in the real word where objects typically occlude each other. To examine the effect of how targets are combined with backgrounds, we tested the GA for the LabelMe image database using a Gaussian signal that occluded the image. We included uncertainty in the task by randomizing the amplitude of the target to one of 20 different gray values ranging from 15 to 35. We used the GA to estimate the optimal linear template constructed from the Gabor channels. We only considered a linear model for this task. Fig. 14a shows the 2-D estimated optimal linear template and Fig. 14b the radial profile. Results show that inhibitory surrounds still arise in the best linear template in the presence of an occlusive signal with variable amplitude. These inhibitory surrounds are relatively strong in comparison to those present in the estimated template for the task with the additive signal (Fig. 14b) but show that the use of inhibitory surrounds to optimize linear detection of targets in natural backgrounds can generalize to occlusive targets.
(Online color) (a) Best linear behavioral receptive field and (b) radial profiles for an inserted Gaussian target that occludes the background. Although the profiles are different, both exhibit strong inhibitory regions outside the central region of excitation.

Possible limitations of the GA in finding the optimal linear template
There is a vast literature of finding minima/maxima using iterative algorithms such as simulated annealing, GAs, tabu search, cross-entropy methods, and so forth. None of these methods can be guaranteed to find a global optimum for an arbitrary problem. The merits of the different methods are also debated, and there is consensus that the best algorithm varies with the problem at hand (e.g., Pham & Karaboga, Reference Pham and Karaboga2000; Arora et al., Reference Arora, Elwakeil, Chahande and Hsieh2005). Here are some observations and precautions that suggest that our estimates of best linear templates are robust and not a simple local maximum.
1. Our results are based on 100 independent GA runs with different random starting points (initial random weights combining the Gabor functions). The estimate of the linear template is the average of the 100 estimates obtained from the different GA runs. The problem of finding a local maximum (rather than a global maximum) is more severe when one utilizes a single run of the GA from a single starting point. Averaging the result across many evolutions should mitigate the problem of reaching a local maximum.
2. Standard deviations across different GA runs are reasonably small, indicating that the algorithm is converging toward a similar region of the solution space (i.e., similar linear templates).
3. We have validated the algorithm with a number of computer-simulated noise fields including white noise, 1/f, and 1/f 2. In all these instances (white, 1/f, 1/f 2), the GA resulted in an estimated optimal linear template that closely matched the actual optimal linear template, which for these backgrounds can be calculated from closed-form expressions and are known. Thus, this result verifies that at least for the computer-simulated noise fields, the GA is converging on the right solution.
4. We experimented with two other approaches to finding the optimal linear template, namely the Fisher linear discriminant (FLD) and an implementation of a support vector machine (SVM). In both cases, these approaches reproduce optimal performance in Gaussian noise. However, in natural images, the GA results in superior performance over the FLD and SVM.
Comparison to other hypotheses about center–surround organization
Center–surround organization of cells in early vision is prevalent in a wide range of vertebrates and invertebrates (Land, Reference Land, Kerkut and Gilbert1985). Previous studies have put forward a number of theories to explain the center–surround organization of cells. A general edge enhancement has been proposed as a desirable property of center–surround cells (Balboa & Grzywacz, Reference Balboa and Grzywacz2000). Others have attributed the center–surround organization to the decorrelation (“whitening”) of the neuronal responses to natural images (Srinivasan et al., Reference Srinivasan, Laughlin and Dubs1982; Atick & Redlich, Reference Atick and Redlich1992). More recently, Graham et al. (Reference Graham, Chandler and Field2006) have shown that center–surround cells are not unique in being able to decorrelate the responses of cells to natural images. Other receptive fields with equal amplitude spectra but different phase spectra and no center–surround organization can also decorrelate the responses to the input stimuli. Graham et al. (Reference Graham, Chandler and Field2006) propose that the center–surround organization has unique properties about sparseness as measured by the high kurtosis of the responses. All these approaches can be described as being based on desirable coding properties arising from engineering principles.
Our approach in this paper is quite different. We defined optimality with respect to performance in a given task: search for a Gaussian target in natural images. We used a GA as an iterative method to find the optimal linear template built from simple cells but also as a metaphor for the process of evolution. Remarkably, our findings converge with previous analyses (Srinivasan et al., Reference Srinivasan, Laughlin and Dubs1982; Atick & Redlich, Reference Atick and Redlich1992; Graham et al., Reference Graham, Chandler and Field2006) showing that the excitatory center and inhibitory surround are an emergent property of the linear receptive field that optimizes the localization of spatially compact signals in natural images. Although we have not fully accounted for previously estimated human behavioral receptive fields in white noise, the center–surround organization in the evolved optimal linear templates was robust to the amplitude of the signal, nonlinearities in the channel responses, and also whether the signal was additive or occluded the backgrounds.
In the broader context, there has been a substantial literature on statistics of natural scenes (Rudermant, Reference Rudermant1994; Simoncelli & Olshausen, Reference Simoncelli and Olshausen2001; Torralba & Oliva, Reference Torralba and Oliva2003), in which properties of human visual system are deduced from the coding requirements needed to represent the images. Here, we have adapted a different approach by explicitly incorporating a visual task, and find properties of the visual system emerge as a consequence of optimal task performance in natural scenes. Given the complexity of natural scenes, virtual evolution of vision models can be a useful way to examine how task performance interacts with statistics of natural image backgrounds and assess whether the evolved models share properties with the human visual system.
Appendix A
Estimating a linear behavioral receptive field for the nonlinear channelized model
The linear model combines the responses of Gabor receptive fields through a weighted sum. Therefore, the behavioral receptive field is given by the same weighted sum of the Gabor receptive fields. For a nonlinear model, estimation of its linear component (its behavioral receptive field) cannot be easily done through analytic expressions. Instead, we use an iterative method similar to that used to estimate behavioral receptive fields for humans (Castella et al., Reference Castella, Abbey, Eckstein, Verdun, Kinkel and Bochud2007).
In this approach, we seek the linear combination of Gabor functions that best predicts the choices of the nonlinear model for the 4 AFC task with 400 natural images. This linear model maximizes agreement with the trial-to-trial choices of the nonlinear channelized model.
We can compute the choice agreement between the linear template and nonlinear models across all N trials:
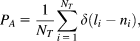
where li,  indicate the choices of the linear and nonlinear models and
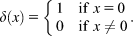
Again, we resort to GAs to find the linear combination of Gabor functions that maximizes PA with the nonlinear model.
Appendix B
Details of acquisition of Hateren image data set
The image database (van Hateren & van der Schaaf, Reference van Hateren and van der Schaaf1998) consisted of 4212 calibrated images acquired using a Kodak DCS420 digital camera (with a 28-mm camera lens). The linearity of the camera was checked with a set of calibrated neutral density filters. The slight blur in the images caused by the optical system of the camera was also measured and corrected. Finally, the images had a resolution of 1536 × 1024 pixels and 12 bits in depth. For the 4 AFC task, the Gaussian signal was randomly added at the center of one of the four patches with a size of 128 × 128 pixels. In this study, we chose 4000 images and used them in two ways. First, we ran the GA on all 4000 images. This methodology was then repeated 100 times. Second, we divided 4000 images into 10 subsets (no overlap) of 400 images. Then, we derived the bet linear template from each subset with 400 images.