INTRODUCTION
Wheat (T. aestivum L.), the second most important staple food crop in India, accounting for more than 70% of total grain production is responsible for the food security of the country. Since 1999–2000 country is struggling to sustain production due to increased occurrence of terminal heat stress (Joshi et al., Reference Joshi, Mishra, Chatrath, Ferrara and Singh2007). It is essential to breed varieties for heat tolerance for achieving growth in wheat production to feed the increasing population of the country.
Understanding the association between yield and its components would improve the breeding programs by selecting appropriate traits for evolving new varieties (Evans and Fischer, Reference Evans and Fischer1999). However, variability of yield components is less studied than yield of wheat (Zecevic et al., Reference Zecevic, Boskovic, Dimitrijevic and Petrovic2010). With sufficient water and nutrients, yield components are largely determined by the amount of solar radiation received and the daily mean temperature around ATS and their combined effect on yield components was studied with the help of PTQ (Nalley et al., Reference Nalley, Barkley and Sayre2009). The effect of high temperature on yield components of wheat was studied extensively under controlled temperature conditions or thermal stress imposed at some stages of crop in the field (Gibson and Paulsen, Reference Gibson and Paulsen1999; Prasad et al., Reference Prasad, Pisipati, Ristic, Bukovnik and Fritz2008; Ugarte et al., Reference Ugarte, Calderini and Slafer2007).
The impact of temperature and PTQ on yield components of wheat was also assessed through imposition of different sowing dates (Dhillon and Ortiz-Monasterio, Reference Dhillon and Ortiz-Monasterio1993; Fischer and Maurer, Reference Fischer and Maurer1976; Ortiz-Monasterio et al., Reference Ortiz-Monasterio, Dhillon and Fischer1994). Influence of temperature on each of the components of crop yield depends on the phase at which the elevated temperature occurs (Calderini et al., Reference Calderini, Abeledo, Savin and Slafer1999; Ferris et al., Reference Ferris, Ellis, Wheeler and Hadley1998; Stone and Nicolas, Reference Stone and Nicolas1995a). Response of yield components to temperature varies in different varieties (Gibson and Paulsen, Reference Gibson and Paulsen1999; Stone and Nicolas, Reference Stone and Nicolas1995a). However, not much work is available on the responses of yield components to temperature during different phenological stages in different varieties of wheat.
This study aims at testing the following hypotheses. Hypothesis 1: All the yield components are not equally contributing to the crop yield; Hypothesis 2: Influence of weather parameters is not same in all the yield components; Hypothesis 3: Requirement of optimum weather parameters and critical phenological stages are different in different yield components and cultivars. This study was taken up with the objectives: (i) to identify appropriate yield components for improving yield; (ii) to understand the influence of weather parameters on individual yield components and (iii) to identify optimum weather parameters in critical phenological stage (s) for each yield component.
MATERIALS AND METHODS
Experimental site
The experimental site at Kanpur centre of the All India Coordinated Research Project on Agrometeorology (AICRPAM) is located in the Indo-Gangetic Plains of Uttar Pradesh, India. The latitude, longitude and altitude of this centre are 26.4 ° N, 80.3° E and 126 m, respectively. The soil of the experimental site is sandy loam in texture with a deeper profile depth. The annual precipitation of the centre is 869 mm and mean temperature of the hottest and coldest months are 39 °C (May) and 7.4 °C (January), respectively.
Details of the experiment
In every year of the study period (1996–2006), three cultivars of wheat were planted under three different dates to expose the crop varieties to different sets of weather conditions. The field experiment was laid out in split plot design with four replications. Three dates of sowing (early, normal and late) were the main treatments and three cultivars (HD-2285, K-8804 and K-9107) were the sub treatments in this experiment. The actual date of sowing under early, normal and late sowing treatments were not fixed but varied between 15th November and 2nd December, 30th November and 23rd December and 15th December and 12th January, respectively during all 11 years (1996–2006) due to some unfavourable weather and field conditions. The crop was raised under stress (water and nutrient) free conditions by adopting standard package of practices to ensure a non-limiting nutrient and water supply. The standard packages of practices are: 100–120 kg seed ha−1; fertilizer dose of 120 kg N, 60 kg P2O5 and 60 kg K2O; and six irrigations. Of the total N–P–K of 120–60–60 kg ha−1, full dose of P and K and half N dose were applied at the time of sowing and remaining half dose of N was top dressed in two equal splits at crown root initiation (CRI) and TLR stages. The six irrigations were applied at CRI, TLR, JNT, ATS, milk (MLK) and dough (DGH) stages. The crop was kept free from weeds and pests throughout the growing season. To control broad leaved weeds 2, 4-D sodium salt at CRI and JNT stages was applied, besides controlling all types of weeds through two or three manual weedings. To protect the crop against fungal diseases, Dithane M-45 @ 1.5–2 kg ha−1 was sprayed, at TLR and JNT stages (if required). The individual plot size of 36 experimental plots is 6 × 3 m2. Row to row spacing of 22.5 cm was maintained in all the varieties under all the dates of sowing treatments.
Crop and weather data
The data on all the important weather parameters were recorded at the meteorological observatory nearer to the experimental site. Daily MXT and MNT from the date of sowing to date of harvesting were recorded in all the years of experimentation. Both daily MXT and MNT were recorded twice at 0700 and 1400 hrs local mean time (LMT). The MXT and MNT were recorded with the help of maximum and minimum thermometers housed in a Stevenson's screen. Regarding crop data, dates of occurrence of eight important phenological stages viz. emergence (EMR), CRI, TLR, JNT, ATS, MLK, DGH and (MTY) in each cultivar of wheat under all the three dates of sowing over all the 11 years were recorded. The beginning of these eight phenological stages are equal to the decimal codes (DC) 5, 14, 21, 31, 60, 73, 83 and 91 of the Zadok's scale of growth and development for cereals (Zadoks et al., Reference Zadoks, Chang and Konzak1974). Yield components like spikelets per ear (SL), EL, NG, GW and TG at maturity were collected from five randomly selected and tagged plants from each replication and treatment. Yield was harvested from net plot area of 5 × 2.2 m2 in each cultivar and date of sowing treatments, under all four replications.
CALCULATION OF SOLAR RADIATION AND PTQ
Solar radiation
As daily solar radiation data was not recorded at this location, it was estimated using the algorithm of Bristow and Campbell (Reference Bristow and Campbell1984). This formula computed solar radiation from the data of latitude, time of the year (Julian days), MXT and MNT.
PTQ
It is calculated daily during the crop growing period based on the following formulae used by Ortiz-Monasterio et al. (Reference Ortiz-Monasterio, Dhillon and Fischer1994).
-
If T < 4.5, PTQ day−1 = 0;
-
If 4.5 < T < 10, PTQ day−1 = solar radiation * [(T – 4.5) / 5.5] /5.5;
-
If T > 10, PTQ day−1 = solar radiation / (T – 4.5).
-
Where T is the daily mean temperature [(MXT + MNT) / 2] and PTQ is expressed as MJ m−2 day−1 °C−1.
STATISTICAL METHODS
Genotype × environment (G × E) interaction
The G × E interaction on yield components as well as yield were studied using the joint regression model (Eberhart and Russel, Reference Eberhart and Russel1966)
 \begin{eqnarray*}
Y_{ij} = \mu _i + b_i I_j + d_{ij},
\end{eqnarray*}
where Yij = response of ith genotype in jth environment.
-
μ i = Mean of the ith genotype over all environments.
-
bi = Regression Coefficient corresponding to ith genotype.
-
Ij = Environmental index corresponding to jth environment.
-
dij = Component of deviation from regression for the ith genotype at jth environment.
This analysis was carried out by taking 3 genotypes (HD-2285, K-8804 and K-9107) and 33 environments (3 dates of sowing × 11 years of experimentation).
Correlations
For understanding the relation between yield and yield components and also for studying the relationship of yield components with phenological stage-wise temperature (MXT and MNT) and PTQ, Pearson's correlation coefficients were worked out. For this purpose, daily MXT, MNT and PTQ during each of the phenological stage were averaged for all the three cultivars in all the dates of sowing and years of experimentation. Regression analysis was performed for quantifying the effect of temperature or PTQ on yield components and for understanding the degree of association between yield and yield components. Significance of the relations was assessed through F-test and P-levels.
Categorization of yield components
For categorization of individual yield component of each variety into three different types, mean (M) and standard deviation (σ) of individual yield component of each variety over all the 33 dates of sowing-year combinations were worked out. The years with yield component value of more than M + σ, between M – σ and M + σ and less than M – σ, respectively, were grouped as above average, average and below average years of that particular yield component. Based on this criterion, years in respect of all the five yield components namely SL, EL, NG, GW and TG (separately) were classified as above average, average and below average. The MXT, MNT and PTQ were averaged over the duration of all eight individual phenological stages of each crop variety in all the three dates of sowing and years. The phenological stage-wise averaged MXT, MNT and PTQ were again averaged over the years with above average, average and below average yield components (separately for each component). Student's t-test was used to test the significance of difference between temperature (MXT or MNT) or PTQ or individual yield components averaged over any two different categories of years. Correlations, regression equations, mean, standard deviation, F- and t-tests were performed using Microsoft EXCEL 2007 software. The joint regression for studying G × E interaction was worked out using SAS 9.2 software.
RESULTS
Observed yield and yield components
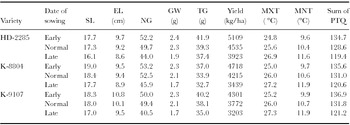
Yield and yield components in three dates of sowing, viz. early, normal and late (Table 1) showed decrease in all the yield components as well as yield with delay in sowing in all the three cultivars. Among the three cultivars, HD-2285 and K-9107 produced highest and lowest yield, respectively in all the sowing dates. The highest yielding cultivar HD-2285 also produced highest GW and TG in all sowing dates. The lowest yielding cultivar K-9107 recorded lowest NG in all the sowing dates.
Yield and yield components of three cultivars and weather parameters under three different dates of sowing.

Relationship between yield and yield components
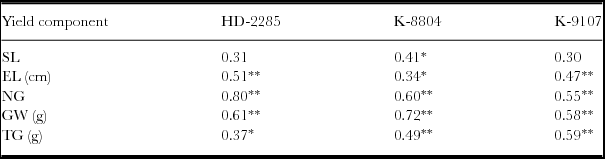
The relationship of yield with each of the five yield components viz. SL, EL, NG, GW and TG, in respect of all the three cultivars (Table 2) showed all the yield components except SL to be significant contributors to yield across all the three cultivars. SL could significantly influence the yield of K-8804 only. No single yield component could emerge as prime contributor for yield in all the cultivars. NG, GW and TG were identified as main contributors for yield in HD-2285, K-8804 and K-9107, respectively. Based on the order of correlation coefficients between yield and yield components, NG, GW and EL in HD-2285, GW, NG and TG in K-8804 and TG, GW and NG in K-9107 were identified as the three main yield components contributing for yield in respective cultivars.
Correlation coefficients between grain yield and its components in three wheat cultivars at Kanpur.

*Significant at p < 0.05 and **Significant at p <0.01.
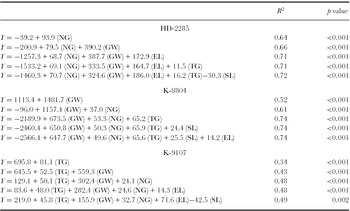
Multiple regression equations relating yield with two to five yield components (in the order of their significance as per correlation coefficients) in respect of all three varieties (Table 3) showed that R 2 value of the regression increases up to three main yield components (as predictor variables) and addition of more yield components have not improved the R 2 values of the regression equations. The multiple regression with three important yield components as predictor variables could explain 71, 74 and 48% yield variation in HD-2285, K-8804 and K-9107, respectively.
Yield prediction models based on yield components in three cultivars of wheat at Kanpur.

Y = Yield of respective genotype.
G × E interaction in yield and yield components
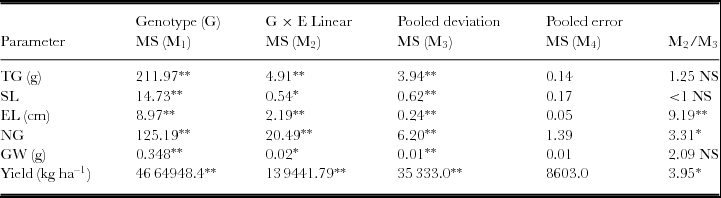
Mean squares (MS) due to genotype (M1) when tested against MS due to pooled deviation (M3) confirmed significant differences among genotypes with respect to yield and its components (Table 4). Both G × E linear (M2) and pooled deviation (M3) components were found significant at 5% level, when tested against pooled error (M4) for all the parameters under study. It indicated the presence of G × E interaction in all the parameters.
ANOVA for identifying G × E interactions in yield and yield components of wheat at Kanpur.

*Significant at p < 0.05; **Significant at p < 0.01; NS - Non-significant.
From the M2/M3 value in the last column of the table, it is concluded that substantial proportion of interaction is of linear type for EL, NG and yield. Hence, performance of the genotypes with respect to these parameters can be predicted in a given environment using the joint regression equation. Since the G × E interaction is significant, effort has been made to study the influence of environment (MXT, MNT and PTQ) on yield components of each genotype.
Influence of seasonal mean temperature on yield and yield components
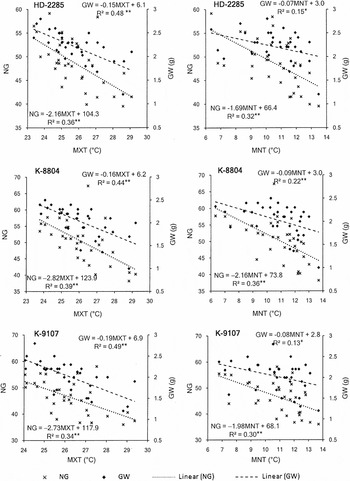
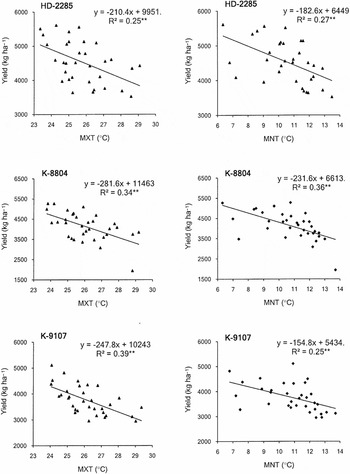
Seasonal mean MXT and MNT could show significant negative relationship on only NG and GW, in all three cultivars (Figure 1). Out of these two yield components, NG was more significantly influenced by seasonal MNT than MXT while GW was more significantly influenced by MXT than MNT in all the three cultivars. Out of the three cultivars, K-8804 was found to be more susceptible to heat stress, as both yield components NG and GW as well as yield (Figure 2) showed highest negative response with unit increase in MXT or MNT in K-8804 than in other two cultivars. Both the yield components in all the three cultivars are more adversely influenced (in terms of rate of reduction) by seasonal MXT than MNT. However, the differential response of MXT compared to MNT was more pronounced (nearly two times) in case of GW in all the cultivars. Yield was also more adversely affected by MXT than MNT in all the three cultivars.
Effect of seasonal mean temperature (MXT and MNT) on NG and GW in three cultivars of wheat at Kanpur.

Effect of seasonal mean temperature (MXT and MNT) on yield of three cultivars of wheat at Kanpur.

Influence of temperature (phenological stage-wise) on yield components
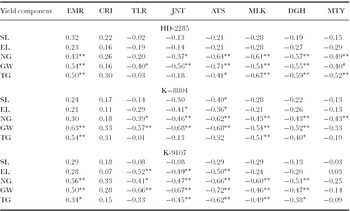
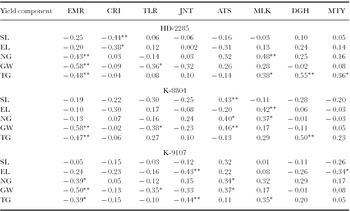
MXT in any of the stages in HD-2285 and K-9107 has not influenced the SL (Table 5). Among the yield components, GW was the most sensitive to MXT, during most of the stages from TLR to MTY, and more significantly affected during JNT to ATS stage. MXT during this stage showed significant negative relationship of −0.71, −0.68 and −0.72 on GW of HD-2285, K-8804 and K-9107, respectively. NG comes next in its sensitivity to MXT during this same stage i.e. JNT to ATS in all the three varieties. MXT showed significant negative relationship with NG in HD-2285, K-8804 and K-9107 with correlation coefficients of −0.64, −0.62 and −0.66, respectively. MXT during ATS to MLK stage of HD-2285 and K-8804 and JNT to ATS stage of K-9107 had highest significant adverse effect on TG than in any other phenological stages of respective cultivars. EL was found to be more sensitive to MXT in K-9107 than in the other two cultivars, with MXT in three phenological stages from CRI to ATS showing highly significant negative relationship with EL in K-9107.
Correlation coefficients between yield components and phenological stage-wise MXT in three cultivars of wheat.

*Significant at p < 0.05 and **Significant at p < 0.01.
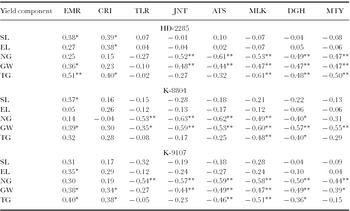
Among all the yield components, NG was found to be most sensitive to MNT at most of the phenological stages in all three cultivars. Though MNT during all the stages from JNT to MTY showed significant negative relation with NG of all the three cultivars, it was highest during either TLR to JNT or JNT to ATS in different cultivars (Table 6). The stage of highest adverse influence of MNT on GW varied from cultivar to cultivar and that critical stage is TLR to JNT in HD-2285, ATS to MLK in K-8804 and JNT to ATS in K-9017. However, highest adverse influence of MNT on TG in all three cultivars was observed during ATS to MLK stage than in any other phenological stages. The negative effect of rising MNT in any of the phenological stages on the other two yield components viz. SL and EL of any of the cultivars was insignificant.
Correlation coefficients between yield components and phenological stage-wise MNT in three cultivars of wheat.

*Significant at p < 0.05 and **Significant at p < 0.01.
Influence of PTQ on yield components
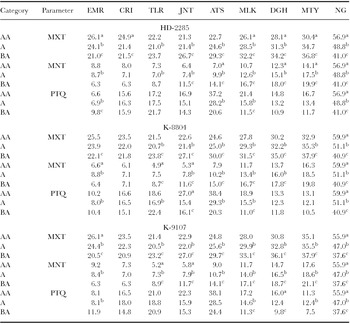
The positive effect of PTQ on NG and TG was significant (in some stage or other) in all the cultivars (Table 7). The positive effect of PTQ on GW, however, is significant in K-8804 and K-9107 only. Highest positive effect of PTQ on NG and GW was observed during JNT to ATS stage in K-8804 and K-9107 and during ATS to MLK stage in HD-2285. The positive influence of PTQ on TG was found to be highest during MLK to DGH stage in HD-2285 and K-8804 and during ATS to MLK stage in K-9107. SL and EL were not positively responding to PTQ at any of the stages in any of the cultivars (except JNT to ATS for SL and ATS to MLK for EL in K-8804). The PTQ values during sowing to emergence showed significant negative relationship with major yield components namely, NG, GW and TG, thus indicating the importance of low solar radiation and high temperature during emergence on these three yield components.
Correlation coefficients between yield components and phenological stage-wise sum of PTQ in three cultivars of wheat.

*Significant at p < 0.05 and **Significant at p < 0.01.
TEMPERATURE THRESHOLDS FOR YIELD COMPONENTS
Number of grains per ear (NG)
Highest NG in HD-2285 was recorded in the years with lowest MXT and MNT and highest PTQ during TLR to MTY stages compared to the temperatures or PTQ during the respective stages in average and below average category of years (Table 8). Among the phenological stages, JNT to ATS stage was found to be sensitive for MXT, MNT and PTQ in influencing the NG. The differences in temperature (MXT or MNT) as well as PTQ between above and below average years were highest at JNT to ATS stage than in any other phenological stage. In case of K-8804, comparatively lower MXT during JNT to MTY, lower MNT during CRI to MTY and higher sum of PTQ during JNT to MTY in the years under above average NG category, than in the years under average and below average NG category was observed. In view of the highest temperature (MXT and MNT) or PTQ differences between highest and lowest NG category of years during JNT to ATS stage than in any other phenological stages, JNT to ATS stage was identified as the critical stage for NG in K-8804. In K-9107, the differences (between highest and lowest NG categories) in MXT, MNT and PTQ were highest in MLK to DGH, TLR to JNT and MLK to DGH stages, respectively. In all the three varieties, PTQ during JNT to ATS was higher than in other phenological stages and it was comparatively higher in the above average category than in other two categories. MXT/MNT of 22.7/7.0 °C and 24.6/7.9 °C during JNT to ATS were found to be optimum thermal conditions for achieving maximum NG in HD-2285 and K-8804, respectively. In K-9107, MXT of 30.8 °C during MLK to DGH stage and MNT of 5.8 °C during TLR to JNT were found to be optimum.
Phenological stage-wise mean MXT and MNT and sum of PTQ in wheat averaged over the years of three different categories of ‘NG’.

AA, A and BA refers to Above Average, Average and Below Average, respectively; Superscripts a, b and c refer to significance of difference (p < 0.05) between temperature/PTQ of AA and A, A and BA, AA and BA ‘NG’ years, respectively.
Grain weight per ear (GW)
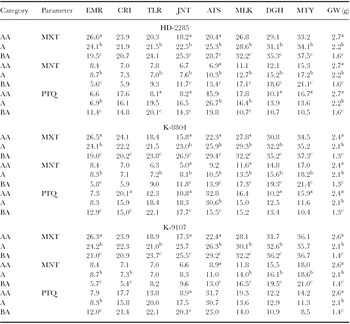
GW was found to be above average in the years in which MXT during the stages from CRI to MTY were lower and vice versa in all the three cultivars (Table 9). MNT were also lower in above average grain weight years compared to the years with other two categories of GW during the stages TLR to MTY in HD-2285 and K-9107 and during CRI to MTY in K-8804. However, the difference in MXT or MNT between above and below average GW years is significant and highest during the stages around ATS than during the other phenological stages in all the cultivars. MXT/MNT of 20.4/6.9 °C during JNT to ATS in HD-2285 and 15.8/5.0 °C during TLR to JNT in K-8804 was found to be optimum for obtaining highest GW. In K-9107, 17.3 °C of MXT during TLR to JNT and 11.8 °C MNT during ATS to MLK stage were found to be optimum. The PTQ during JNT to ATS stage was found to be higher in the years with above average GW than in other two categories of years in all the cultivars. The benefit of higher MXT and lower sum of PTQ during sowing to emergence in achieving above average GW was observed, indicating the requirement of higher MXT and low PTQ at initial stages for achieving highest GW.
Phenological stage-wise mean MXT and MNT and sum of PTQ in wheat averaged over the years of three different categories of ‘GW’.

AA, A and BA refers to Above Average, Average and Below Average, respectively; Superscripts a, b and c refer to significance of difference (p < 0.05) between temperature/PTQ of AA and A, A and BA, AA and BA ‘GW’ years, respectively.
1000-grain weight (TG)
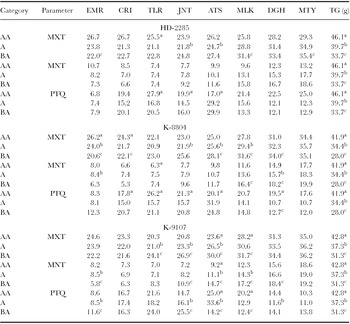
Though decrease in average MXT or MNT over the years under above average TG category compared to the average and below average categories was observed during ATS to post-ATS stages in all the cultivars, they were not equally significant across all the varieties and stages (Table 10). The difference in MXT or MNT between above average and below average TG category of years were significant and highest during ATS to MLK stage in K-8804, during JNT to ATS in K-9107 and during DGH to MTY (only MXT) in HD-2285. The positive effect of the sum of PTQ was felt only during ATS to MLK stage in K-9107. Among the cultivars, TG of K-9107 was only found to be sensitive to MXT, MNT and sum of PTQ during JNT to ATS, as the differences in averages of these parameters between the years of any two TG categories were significant. The MXT, MNT and PTQ of 23.6 °C, 9.2 °C and 25 MJ/m2/day/ °C, respectively during JNT to ATS were found to be optimum for obtaining higher TG in K-9107. The MXT/MNT of 27.8/11.6 °C during ATS to MLK stage in K-8804 and MXT of 29.3 °C during DGH to MTY stage in HD-2285 were identified as optimal thermal conditions for obtaining maximum TG.
Phenological stage-wise mean MXT and MNT and sum of PTQ in wheat averaged over the years of three different categories of ‘TG’.

AA, A and BA refers to Above Average, Average and Below Average, respectively; Superscripts a, b and c refer to significance of difference (p < 0.05) between temperature/PTQ of AA and A, A and BA, AA and BA ‘TG’ years, respectively.
Ear length (EL)
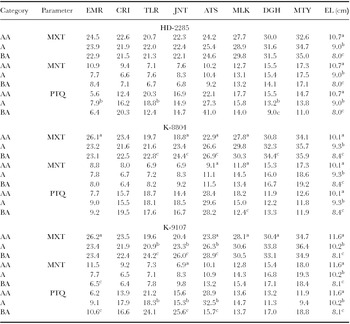
Among the three weather parameters, only MXT was found to have significant influence on EL of K-8804 and K-9107 (Table 11). Lower MXT during the stages from CRI to ATS of K-8804 and K-9107 was observed to favour higher EL and vice versa. However, TLR to JNT stage was found to be more critical in view of the significant and higher temperature difference between the years under above average and below average categories of EL, during this stage. MXT of 18.8 and 20.4 °C during TLR to JNT in K-8804 and K-9107, respectively were identified to be optimum for obtaining higher EL.
Phenological stage-wise mean MXT and MNT and sum of PTQ in wheat averaged over the years of three different categories of ‘EL’.

AA, A and BA refers to Above Average, Average and Below Average, respectively; Superscripts a, b and c refer to significance of difference (p < 0.05) between temperature/PTQ of AA and A, A and BA, AA and BA ‘EL’ years, respectively.
Spikelets per ear (SL)
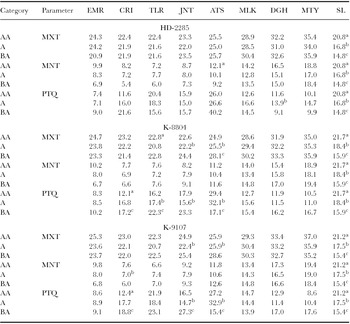
SL in K-8804 was only influenced (significantly) by MXT during JNT to ATS stage (Table 12). MXT of 24.9 °C during this stage resulted in higher number of SL and increase in temperature by 3.2 °C caused reduction in spikelets from 21.7 to 15.9 per ear.
Phenological stage-wise mean MXT and MNT and sum of PTQ in wheat averaged over the years of three different categories of ‘SL’.

AA, A and BA refers to Above Average, Average and Below Average, respectively; Superscripts a, b and c refer to significance of difference (p < 0.05) between temperature/PTQ of AA and A, A and BA, AA and BA ‘SL’ years, respectively.
DISCUSSION
Relationship between yield and yield components
Most of the studies conducted earlier under both controlled and field conditions identified NG and GW as the two most important yield components (Ferris et al., Reference Ferris, Ellis, Wheeler and Hadley1998; Gibson and Paulsen, Reference Gibson and Paulsen1999; Ugarte et al., Reference Ugarte, Calderini and Slafer2007; Zecevic et al., Reference Zecevic, Boskovic, Dimitrijevic and Petrovic2010). In the present study also GW and NG were identified as the two important yield components in all the three cultivars tested. The yield components and yield relation in three different cultivars identified NG, GW and TG as the most important yield components in HD-2285, K-8804 and K-9107, respectively. Multiple regression equations with three high ranking yield components in each cultivar as predictor variables could explain maximum yield variation (74%) in K-8804 and minimum yield variation (48%) in K-9107. In K-9107, yield components other than these five yield components may be having higher influence on yield, resulting in poor R 2 value.
G × E interactions in yield and yield attributes
Genotype by environment interaction (G × E) can be defined as the differential response of varying genotypes under changes in environment (Mather and Caligari, Reference Mather and Caligari1976). Major interactions can be expected where there is wide variation between environments or genotypes for incidence of biotic or abiotic stresses (Annicchiarico, Reference Annicchiarico2002). In view of the importance of G × E interaction, it was studied widely in wheat under Indian conditions (Ranjana and Kumar, Reference Ranjana and Kumar2013; Sareen et al., Reference Sareen, Munjal, Singh, Singh, Varma, Meena, Shoran, Sarial and Singh2012 and Reference Sareen, Tyagi, Sarial, Tiwari and Sharma2014). When G × E interaction occurs, factors present in the environment (temperature, rainfall etc.), as well as the genetic constitution of an individual (genotype), influence the phenotypic expression of a trait. Significant G × E interaction identified in the present study indicates the influence of environmental conditions on yield components. The important environmental factors such as temperature and radiation were considered for the study.
Influence of seasonal mean temperature
Very few studies on the influence of seasonal mean temperature on yield components of wheat are available in the literature (Nishio et al., Reference Nishio, Ito, Tabiki, Nagasawa, Yamauchi and Hirota2013). The reduction in NG and GW with higher temperature, observed in the present study is similar to the earlier findings (Gibson and Paulsen, Reference Gibson and Paulsen1999). The sensitiveness of GW to heat stress is in line with the observations of Sareen et al. (Reference Sareen, Tyagi, Sarial, Tiwari and Sharma2014). Variations in the response of yield components to high temperature among cultivars were reported earlier by Wardlaw and Moncur (Reference Wardlaw and Moncur1995).
Effect of temperature and PTQ (phenological stage-wise) on yield components
The yield components are highly sensitive to temperature stress and response of various yield components to heat stress varies with crop phenological stages (Gibson and Paulsen, Reference Gibson and Paulsen1999). The effect of both temperature and solar radiation on yield components was studied by using PTQ in different crop stages and crop cultivars (Fischer, Reference Fischer1985; Nalley et al., Reference Nalley, Barkley and Sayre2009; Ortiz-Monasterio et al., Reference Ortiz-Monasterio, Dhillon and Fischer1994). The present study also showed the relationships between each individual yield components and temperature (MXT and MNT) or PTQ varying during different phenological stages of three wheat cultivars (Tables 5–7). Among the yield components, GW and NG were found to be more sensitive to MXT and MNT during JNT to ATS stage in all the three crop cultivars agreeing with the observations of Gibson and Paulsen (Reference Gibson and Paulsen1999), in which reduction in wheat yield under high temperatures was associated with less number of grains per spike and smaller grain size.
The observation of significant adverse effect of both MXT and MNT during stages from TLR to MTY on the NG is similar to Ortiz-Monasterio et al. (Reference Ortiz-Monasterio, Dhillon and Fischer1994), in which NG reduced with temperature during the period 20 days before heading to 40 days after heading. The highest influence of MXT during ATS on NG is in agreement with the results of Wheeler et al. (Reference Wheeler, Craufurd, Ellis, Porter and Prasad2000), showing closer relationship between number of grains and temperature during ATS. No single and same temperature sensitive phenological stage for NG was reported in literature. Some studies reported it as either ATS or post-ATS stage (Ferris et al., Reference Ferris, Ellis, Wheeler and Hadley1998; Tashiro and Wardlaw, Reference Tashiro and Wardlaw1990) while others reported it as pre-ATS stage (Fischer, Reference Fischer1985; Ugarte et al., Reference Ugarte, Calderini and Slafer2007). Genotypic differences in the response of NG to MXT (correlation coefficients ranging from −0.62 to −0.72 in different cultivars) is in line with the genotypic differences of grains/spike in response to high temperature reported earlier (Gibson and Paulsen, Reference Gibson and Paulsen1999; Stone and Nicolas, Reference Stone and Nicolas1995a). The sensitivity of GW to the MXT observed during TLR to MTY stages is partially agreeing with the observation of Fischer and Maurer (Reference Fischer and Maurer1976), showing temperature during end of TLR to beginning of grain filling as the determining factor of kernel weight. The finding of higher adverse effect of MXT or MNT during ATS to MLK stage on TG of cultivars HD-2285 and K-8804 than in other stages agreed with the results of Stone and Nicolas (Reference Stone and Nicolas1995b) in which grain weight was reported to be most sensitive to heat stress during early grain filling period (ATS to MLK stage). Highest positive effect of PTQ on NG during JNT to ATS stage in two cultivars and during ATS to MLK stage in another cultivar, partially agreed with Ortiz-Monasterio et al. (Reference Ortiz-Monasterio, Dhillon and Fischer1994), in which highest PTQ between the period of 20 days before and 10 days after heading resulted in maximum grains per m2 in wheat cultivars at Ludhiana, India. However, some other studies (Lazaro and Abbate, Reference Lazaro and Abbate2012; Nalley et al., Reference Nalley, Barkley and Sayre2009) identified PTQ during 30–31 days preceding ATS as a good estimator of number of grains per m2 in wheat. Another yield component i.e. TG, which is being significantly influenced by PTQ in all cultivars, is sensitive to PTQ in post ATS period, as kernel weight is attributable to events after ATS (Ortiz-Monasterio et al., Reference Ortiz-Monasterio, Dhillon and Fischer1994).
Temperature/PTQ thresholds for yield components
Though the impact of high temperature on yield components of wheat was studied extensively (Fischer, Reference Fischer1985; Gibson and Paulsen, Reference Gibson and Paulsen1999; Tashiro and Wardlaw, Reference Tashiro and Wardlaw1989; Ugarte et al., Reference Ugarte, Calderini and Slafer2007), the threshold temperatures for yield components were not reported much. Attempt was made here to identify phenophase-wise thresholds of MXT and MNT for obtaining above average, average and below average levels of individual yield components viz. NG, GW, TG, SL and EL (Tables 8–12). MXT/MNT of 22.7/7.0 °C and 24.6/7.9 °C during JNT to ATS stage for obtaining highest grain number in HD-2285 and K-8804, respectively are partially agreeing with the observations of Acevedo (Reference Acevedo, Acevedo, Conesa, Monneveux and Srivastava1991) in which mean temperature of 12.2 °C during double ridge or JNT to ATS stage recorded high kernel numbers and spikes per square meter. These MXT thresholds obtained in the present study confirm the results of Saini and Aspinall (Reference Saini and Aspinall1982) in which temperatures above 20 °C between spike initiation and ATS substantially reduced grain number per spike. Ferris et al. (Reference Ferris, Ellis, Wheeler and Hadley1998) also reported decline in the NG at MTY with increasing MXT recorded over the mid-ATS period. The highest sum of PTQ of about 37.2–38.4 MJ/m2/day/ °C during JNT to ATS (25 days) in all the three cultivars required for obtaining highest grain number per spike is in line with the finding of the requirement of PTQ of 1.58 MJ/m2/day/ °C during the period of 20 days before and 10 days after heading for maximum grain numbers per m2 (Ortiz-Monasterio et al., Reference Ortiz-Monasterio, Dhillon and Fischer1994). Moreover, higher effect of PTQ on grain number than on any other yield component, observed in the present study corroborated the results of some other previous studies (Lazaro and Abbate, Reference Lazaro and Abbate2012; Ortiz-Monasterio et al., Reference Ortiz-Monasterio, Dhillon and Fischer1994).
The threshold MXT/MNT of 20.4/6.9 °C required during JNT to ATS stage for obtaining highest GW in HD-2285 reinforces the report of Calderini et al. (Reference Calderini, Abeledo, Savin and Slafer1999), in which 13.5 °C of average temperature during pre-ATS period of booting to ATS produced highest grain weight. Other studies (Ugarte et al., Reference Ugarte, Calderini and Slafer2007; Wardlaw, Reference Wardlaw1994) also showed negative relationship of grain weight with pre-ATS temperature in the range 14–27 °C. The optimum temperature of 11.8 °C during ATS to MLK stage for the highest GW in K-9107 is somewhat similar to the optimum night temperature or MNT requirement of 14–17 °C during post-ATS period for obtaining the highest individual grain weight, reported earlier (Prasad et al., Reference Prasad, Pisipati, Ristic, Bukovnik and Fritz2008). In the above cited article, decrease in grain size under high night temperatures was attributed to decreased grain filling rate or grain filling duration or decrease in endosperm cell numbers. The lower MXT or MNT and higher sum of PTQ during pre-ATS i.e. JNT to ATS stage of K-9107 for obtaining higher TG in the present study contradicts the findings of lower temperature and higher PTQ requirement during post-ATS (10–40 days after heading) stage for higher TG in wheat (Dhillon and Ortiz-Monasterio, Reference Dhillon and Ortiz-Monasterio1993). The lower threshold MXT/MNT of 27.8/11.6 °C during ATS to MLK stage in K-8804 and MXT of 29.3 °C during DGH to MTY stage in HD-2285 supports the importance of post-ATS temperature on the individual kernel weight or TG (Ortiz-Monasterio et al., Reference Ortiz-Monasterio, Dhillon and Fischer1994).
The lower threshold MXT of 18.8–20.4 °C during TLR to JNT for obtaining highest EL in two cultivars of wheat partially agree with the observation of the decrease in ear length under heat stress (Labuschagne et al., Reference Labuschagne, Celliers, Deventer, Tanner, Payne and Abdalla1996). However, the stage in which temperature causes reduction in ear length is nowhere reported in literature to compare with our observation. Reduction in SL of K-8804 from 21.7–15.9 with increase in MXT from 24.9–28.1 °C during TLR to JNT stage is partially in agreement with the reduction in the number of spikelets per spike under the influence of high temperature during double ridge to ATS stage (Warrington et al., Reference Warrington, Dunstone and Green1977). The reduction in spikelet numbers with the increase in temperature was caused due to the effect of high temperature on both the duration and rate of spikelet initiation (Halse and Weir, Reference Halse and Weir1974). Response of spikelets of K-8804 to temperature, besides response of all of its yield components to temperature showed its sensitiveness to thermal stress compared to the other two cultivars.
CONCLUSIONS
This study was conducted to (i) identify appropriate yield components in three cultivars of wheat (ii) understand the role of temperature and PTQ on each yield component and (iii) identify optimum weather conditions for each yield component. First objective of the study was met by identifying NG, GW and TG as the prime yield contributing components in HD-2285, K-8804 and K-9107, respectively. To meet the second objective, G × E interaction in yield components and correlation of yield components with phenological stage-wise temperature and PTQ were taken up. Significant G × E interaction in all five yield components as well as yield was observed. Among the yield components, NG and GW were found to be sensitive to both seasonal mean MXT and MNT in all the three cultivars. Among the cultivars, K-8804 was identified as more susceptible to heat stress in view of higher rate of reduction in GW, NG and yield with increase in MXT or MNT. Higher sensitiveness of GW to MXT and NG to MNT was noticed in all the cultivars during JNT to ATS stage as well as the total crop season. PTQ has positively influenced NG and TG. However, positive effect of PTQ on TG was confined to ATS to MLK or MLK to DGH stages in different cultivars. The third objective was fulfilled by averaging the weather parameters over above average, average and below average yield component years. In both HD-2285 and K-8804, optimum MXT and MNT during JNT to ATS are 22.7–24.6 °C and 7.0–7.9 °C, respectively for obtaining maximum NG. In case of GW, optimum MXT ranged from 15.8–17.3 °C during TLR to JNT stages in K-8804 and K-9107, while it was 20.4 °C during JNT to ATS stage in HD-2285. MXT, MNT and PTQ of 23.6 °C, 9.2 °C and 25 MJ/m2/day/ °C, respectively during JNT to ATS in K-9107 were found optimum for higher TG. MXT during TLR to JNT was observed to be critical for EL in K-8804 and K-9107 and the corresponding MXT thresholds are 18.8 and 20.4 °C in these two cultivars. The SL in K-8804 was reduced from 21.7–15.9 with the increase in MXT by 3.2 °C (from 24.9 °C) during JNT to ATS stage. These results will help in identifying temperature sensitive traits for breeding thermal stress resistant wheat varieties.
Acknowledgements
The authors thank the authorities of Indian Council of Agricultural Research (ICAR) for supporting the research work through the project ‘National Initiative on Climate Resilient Agriculture (NICRA)’. We thank Dr. B. M. K. Raju, Senior Scientist (Ag. Statistics), Central Research Institute for Dryland Agriculture, Hyderabad for his help in G × E analysis.