Implications
Different methodologies have been developed to assess stress in horses; however, most of them are not suitable for applying during equestrian competitions as the experimental procedures could bother the animal and thus affect its sport results.
Previous studies have found that infrared thermography has a good potential as a non-invasive tool for stress assessment in horses during competitions. However, its relation with performance results has not yet been evaluated. Furthermore, it would be of a great interest for breeders, as it could be used for further implementation of the breeding programmes described for selection of the best horses for sport performance.
Introduction
Jumping ability is a complex trait, which requires a set of physiological, behavioural and mechanical characteristics that give the horse reactivity, muscular power and jumping skill. These factors are both genetically and non-genetically determined (Barrey and Langlois, Reference Barrey and Langlois2000). Previous studies have described different factors that could affect horse performance during show jumping competitions (Clayton and Barlow, Reference Clayton and Barlow1989; Bartolomé et al., Reference Bartolomé, Cervantes, Gómez, Molina and Valera2008). When the influence of any of these factors (or a combination of them) induces activation of the sympatho-adrenal (ANS) medullary system, the hypothalamo-pituitary-adrenocortical (HPA) axis and/or an emotional reaction, they induce a stress response (Dantzer and Mormède, Reference Dantzer and Mormède1983; McMillan, Reference McMillan2005; Von Borell et al., Reference Von Borell, Langbein, Després, Hansen, Leterrier, Marchant-Forde, Marchant-Forde, Minero, Mohr, Prunier, Valance and Veissier2007) and thus they can be termed as stressors (Minton, Reference Minton1994). Hence, stress may be defined as the homeostatic, physiological and behavioural responses detectable in an animal as a result of interactions with environmental stressors (Stephens, Reference Stephens1980). More specifically, the ANS consists of two major branches, the sympathetic nervous system and the parasympathetic nervous system. The former is related with the acute response to stress (Ursin and Olff, Reference Ursin and Olff1993) and, when this is activated, heart rate (HR) increases, catecholamines (adrenaline and noradrenaline) are released, activation of β-receptors increases the availability of glucose and fatty acids, and blood flow is redistributed to the skeletal and heart muscles to prepare the animal for the ‘fight or flight’ response (Hsieh et al., Reference Hsieh, Chan, Lui and Lee1990). When the HPA axis is activated, a release into the general circulation of corticosteroid hormones is produced. One of these hormones (cortisol) is related with the chronic response to stress (Ursin and Olff, Reference Ursin and Olff1993). The major effect of the increase of these hormones in the animal is a reduction in inflammation and an increase in glucose metabolism (Stephens, Reference Stephens1980). Lastly, the emotional reaction to a potentially harmful situation is expressed by changes in animal behaviour. Factors like an individual’s characteristics, species, breed, previous experience and the nature and severity of the stressor, could influence the magnitude and type of the stress response (Clark et al., Reference Clark, Rager and Calpin1997). Despite the fact that a deleterious effect on the individual’s welfare (or ‘distress’) can result from both acute and chronic stress, the biological costs are generally low in the case of acute stressors but absolutely devastating in the case of chronic stressors (Moberg, Reference Moberg2000).
Different studies have found that young animals showed higher levels of stress than adults when they were confronted with certain stressors (Thayer et al., Reference Thayer, Hahn, Pearson, Sollers, Johnson and Loch1997; D’Eath et al., Reference D’Eath, Turner, Kurt, Evans, Thölking, Looft, Wimmers, Murani, Klont, Foury, Ison, Lawrence and Mormède2010).
Different methodologies have been developed to assess stress in horses; however, most of them are not suitable for applying during equestrian competitions due to the fact that some require the use of highly specialised instruments and a long period of time and/or certain specific conditions for taking the sample from the animal, whereas others involve invasive procedures that may themselves cause a stress response (Stewart et al., Reference Stewart, Webster, Schaefer, Cook and Scott2005). Monitoring stress in horses is often extremely difficult to accomplish during horse competitions, as riders and owners are unwilling to allow the experimental procedures to bother the animal and thus affect their sport results. Hence, in order to quantify the effect of stress on sport performance, the use of objective and non-invasive tools for stress assessment during equestrian competitions is needed.
Some of the most remarkable non-invasive ways of measuring how the HPA axis works in horses are HR, HR variability, salivary cortisol, cortisol in faeces or urine cortisol (von Borell et al., Reference Von Borell, Langbein, Després, Hansen, Leterrier, Marchant-Forde, Marchant-Forde, Minero, Mohr, Prunier, Valance and Veissier2007; Schmidt et al., Reference Schmidt, Möstl, Wehnert, Aurich, Müller and Aurich2010; Peeters et al., Reference Peeters, Sulon, Beckers, Ledoux and Vandenheede2011) and most recently, eye temperature (ET) measured with infrared thermography (IRT) technology (Cook et al., Reference Cook, Schaefer, Warren, Burwash, Anderson and Baron2001; Hall et al., Reference Hall, Burton, Maycock and Wragg2011; McGreevy et al., Reference McGreevy, Warren-Smith and Guisard2012). ET has been shown to be a more consistent measure of temperature changes in response to stress than other anatomical areas such as the nose (Nakayama et al., Reference Nakayama, Got, Karaoke and Nakamura2005), ear (Ludwig et al., Reference Ludwig, Gargano, Luzi, Carenzi and Verga2007), head (McGreevy et al., Reference McGreevy, Warren-Smith and Guisard2012) or body surfaces (McCafferty, Reference McCafferty2007) and it has been also used for detection of inflammatory processes in extremities in horses (Eddy et al., Reference Eddy, Van Hoogmoed and Snyder2001). Furthermore, as the temperature of the eye and surrounding area are less affected by coat variations (colour, thickness, etc.) than the surface temperature, the former might offer the best potential for accurately monitoring emotional responses (Yarnell et al., Reference Yarnell, Hall and Billett2013).
IRT technology measures changes in ET through the differences in the radiation of electromagnetic energy in small areas around the medial posterior palpebral border of the lower eyelid and the lacrimal caruncle, both of which have rich capillary beds innervated by the sympathetic system and respond to changes in blood flow (Stewart et al., Reference Stewart, Webster, Verkerk, Schaefer, Colyn and Stafford2007). Thus, during an acute stress response, ET tends to increase, possibly as a result of increased dilation of the ocular blood vessels and increased visual attention/orientation (Yarnell et al., Reference Yarnell, Hall and Billett2013). Valera et al. (Reference Valera, Bartolomé, Sánchez, Molina, Cook and Schaefer2012) also found that ET has good potential as a means of detecting stress in horses during competitions.
The aim of this study was to evaluate ET with IRT and HR to measure stress in horses during show jumping competitions and their relationship with competition results, and to evaluate the influence of different extrinsic and intrinsic factors of the horse on the stress measurements analysed.
Material and methods
Animals
Measurements were obtained from 173 animals (87 stallions and 86 mares) of the Spanish Sport Horse (CDE) breed, aged 4 (n=53), 5 (n=71) and 6 (n=49) years old. According to the composite nature of the CDE breed, many different sport horse breeds are included in the studbook as relatives (Bartolomé et al., Reference Bartolomé, Cervantes, Valera and Gutiérrez2011). In order to study the influence of this genetic composition on the animals studied, four genetic lines were assessed according to their origin: an CDE belonged to one of them when the majority of the genetic contribution was from a breed in this line (Bartolomé et al., Reference Bartolomé, Cervantes, Valera and Gutiérrez2011). Thus, 27.7% belonged to a ‘German’ genetic line, created according to the country of origin of the breeds that conformed it (Holsteiner, Hanoverian, Westphalian, Oldenburger and Trakehner); 16.8% belonged to a ‘Selle Français’ genetic line and 9.8% to an ‘Anglo-Arab’ genetic line, both from the Spanish breeds registered in the Spanish Horse Breeds Official Catalogue (Spanish regulation RD 2129/2008); in addition, 45.7% of the CDE belonged to a fourth genetic line, referred to as a ‘Mixed’ line, which included CDE with ancestors from minority foreign sport horse breeds and had a genetic contribution below 50% from the other genetic lines explained before. The pedigree information was gathered from the studbook provided by the National Association of Spanish Sport Horse Breeders (ANCADES). The pedigree matrix was built with the known pedigree of the horses analysed, with a total of 1371 animals.
Location conditions
Samples were taken on the first day of two show jumping competition finals held in the same equestrian centre, in two consecutive years (2010 and 2011), both in October (thus providing similar temperature and humidity ranges). The equestrian centre was located in Segovia (in central Spain) and had an arena with different combinations of obstacles for the jumping exercises. The same arena and obstacle combinations were used for the same age group for both competitions. During this period, the animals were housed in the show stall boxes (measuring 3 square metres) at the equestrian centre and were fed with hay, concentrate and water ad libitum, thus providing standardised environmental and housing conditions. Furthermore, only horses which had arrived at the competition venue 1 day before the beginning of the study and had had 19 days off after the previous competition were used for this study.
Physiological data
The stress levels of the participating animals were assessed with ET and HR measurements. Samples were collected three times (at three stages of the competition) during the first day of the competition: 3 h before the competition (BC), just after the competition (<5 min after the jumping exercise) (JAC), and 3 h after the competition (AC), when the animal was resting. Any differences between phases were accounted for with eye temperature interval (ETI) and heart rate interval (HRI) measurements. These were calculated as ET and HR intervals (respectively) between the phases measured on the same competition day, thus obtaining two interval measurements for each parameter: a previous and a later interval (PI and LI, respectively). Therefore, previous eye temperature interval (PETI) and previous heart rate interval (PHRI) were computed as the difference between JAC and BC phases for ET and HR measurements (respectively), while later eye temperature interval (LETI) and later heart rate interval (LHRI) measurements were computed as the difference between JAC and AC phases for ET and HR measurements (respectively).
ET images were taken with one portable IRT camera (ThermaCam i70 0; FLIR Systems AB, Danderyd, Sweden). In order to calibrate the camera results, environmental temperature and relative humidity were recorded with a digital thermo hygrometer (Extech® 44550) every time an ET sample was taken. To determine ET, an image analysis software Therma Cam Researcher Pro 2.8 SR-2 (FLIR Systems AB) was used, measuring the maximum temperature (°C) within an oval area traced around the eye, including the eyeball and ∼1 cm around the outside of the eyelids. This maximum ET was used for the analyses. Images were collected during the first day of the competition (Valera et al., Reference Valera, Bartolomé, Sánchez, Molina, Cook and Schaefer2012), and a total of three different collection periods per animal were recorded. The left eye of all the horses was scanned from a 90° angle and at a distance of 1 m. Several images were taken per animal and collection period. Later, the image that provided the most optimal operating conditions for analysis was selected.
HR was assessed with a portable pulsometer (Equine Healthcheck; Polar Electro®, Kempele, Finland) and was quantified as heart beats per minute (b.p.m.). HR measurements were taken at the same time as eye images.
Performance and competition data
In order to evaluate the relationship between the physiological data measured for these animals (ET and HR measurements) and their sport performance, show jumping results were obtained from the competitions where the physiological data were collected. Performance records were measured through the variable positive points (PP), as a positive transformation of the penalty points obtained by the animal during the competition by assigning the lowest score (0) to the eliminated animals and 100 points to the best performance (0 penalties). Thus, the higher the penalties the lower the PP. Jumping penalties were incurred for refusals and knockdowns. These values ranged from 0 to 100, with the lowest score (0 points) corresponding to animals which were eliminated and 100 to the best performance (0 penalties).
During each competition, environmental information was collected on the arrival of each horse to the centre. A previous analysis of variance was carried out with a total of 12 factors (‘age of the animal’, ‘genetic line’, ‘sex of the animal’, ‘rider’, ‘sex of the rider’, ‘level of the rider’, ‘weight of the rider’, ‘transport to the competition’, ‘travelling time to the competition’, ‘number of previous sport competitions in which the animal had participated’, ‘daily hours of training’ and ‘length of time for which the horse had been training’), only six of which were statistically significant for at least one of the analysed variables. Thus, six factors (two intrinsic and four extrinsic factors) were finally analysed in order to check their relationship with ET, ETI, HR and HRI values: ‘age of the animal’ (4 to 6 years old) and ‘genetic line’ (German, Selle Français, Anglo-Arab and Mixed) were the intrinsic factors (as they belonged mainly to the animal); whereas ‘rider’ (35 riders), ‘journey duration to the competition centre’ (<0.5, 0.5 to 2, 2 to 4, 4 to 6, 6 to 8, >8 h), ‘number of previous sport competitions in which the animal had participated’ (<5 competitions, 5 to 10, 10 to 20, >20) and ‘daily hours of training’ (6 to 10, >10 h), were the extrinsic factors analysed (as they were composed mainly of an external environmental effect).
Statistical analyses
Both physiological parameters (ET and HR measurements) satisfied assumptions of normal distribution within competition phases.
A statistical description of ET, HR and PP measurements was provided, with a comparison of the marginal means (least squared means) calculated for each parameter (ET and HR) between phases (BC, JAC, AC) or intervals (PI, LI) and for the PP variable. These LS means were calculated with a General Linear Model Procedure (proc GLM). The fixed model used for ET and HR variables was:
 $$Y_{{ijklmno}} =\mu {\plus}S_{i} {\plus}T_{j} {\plus}U_{k} {\plus}V_{l} {\plus}W_{m} {\plus}X_{n} {\plus}E_{{ijklmno}} $$
where Y ijklmno is the adjusted ET and HR values of the oth animal, µ is the overall mean, S i is the fixed effect for the ith genetic line (i=Anglo-Arab, German, Mixed, Selle Français), T j is the fixed effect of jth years of age of the animal (j=4 years old, 5 years old, 6 years old), U k is the fixed effect of kth hours of journey duration to the competition centre (k=<0.5, 0.5 to 2, 2 to 4, 4 to 6, 6 to 8, >8), V l is the fixed effect of lth number of previous competitions (l=<5, 5 to 10, 10 to 20, >20), W m is the fixed effect of mth hours of daily training (m=6 to 10, >10), X n is the fixed effect of nth competition phases or intervals (n=BC, JAC, AC or n=PI, LI, respectively) and E ijklmno is the random error attributed to oth horses.
The fixed model used for the PP variable was similar to the model previously explained for the ET and HR variables, but without the fixed effect of competition phases or intervals, because the performance results were obtained only once per horse.
To determine the magnitude of the intrinsic variation due to animals, the coefficient of variation for residual values was calculated (once the environmental factors were debugged).
In order to study the relationship between show jumping performance and stress measurements once the effect of the environmental factors included in the models was debugged, Pearson’s correlations between the residual values of the physiological variables (ET and HR), measured in the competition phase and intervals, were calculated. According to the distribution of the PP variable, Spearman’s Rank correlations between the residual values of ET and HR (in the competition phase and intervals) and performance results (PP) were calculated.
Furthermore, to find out whether the increase in these physiological parameters, in relation to the basal measurements, was related to the sports performance of the animal, partial correlations between residual values were also calculated, corrected by the effect of the variables measured 3 h before competition (BC), as these samples were considered the basal measurements for this study. Thus, to compute partial correlations, these basal measurements were included as covariates in the GLM models described above. After obtaining the residual values for each pair of variables, the correlations were computed (Pearson’s correlations between the ET and HR variables and Spearman’s Rank correlations between the ET/HR and PP variables).
The possible influence of the six intrinsic and extrinsic factors cited before on the relevant physiological measurements found with the previous analysis was assessed with a proc GLM. The fixed model used for ET_BC, ET_AC, PETI, LETI, HR_BC, HR_AC, PHRI and LHRI variables was:
 $$Y_{{ijklmn}} =\mu {\plus}S_{i} {\plus}T_{j} {\plus}U_{k} {\plus}V_{l} {\plus}W_{m} {\plus}E_{{ijklmn}} $$
where Y ijklmn is the adjusted ET and HR values (within and between phases) of the nth animal. The other factors were the same as those explained for the previous model.
A Mixed General Model (proc mixed) was developed for ET_JAC and HR_JAC variables, with the following fixed model:
 $$Y_{{ijklmno}} =\mu {\plus}S_{i} {\plus}T_{j} {\plus}U_{k} {\plus}V_{l} {\plus}W_{m} {\plus}Z_{n} {\plus}E_{{ijklmno}} $$
were Z n is the random effect of nth riders and E ijklmno is the random error attributed to the nth horses. The other factors were the same as those explained for the previous model.
Within every factor, classes with less than five registries were removed from the statistical analyses. The marginal means for each significant effect found with previous GLM models were also estimated and compared.
Statistical analyses were performed using the Statistical Analysis Systems Institute v. 8.0 package (SAS Institute, 1999). To avoid the declaration of false positive parameters (correlations and F values of GLM), given the large number of contrasts analysed, the Benjamini–Hochberg procedure (Benjamini and Hochberg, Reference Benjamini and Hochberg1995) was carried out to correct the corresponding p values (with a false discovery rate of 5%). This methodology is an efficient way of controlling the false discovery rate in multiple testing, as it is more powerful than the classical Bonferroni correction (Thissen et al., Reference Thissen, Steinberg and Kuang2002).
Results
ET and HR measurements
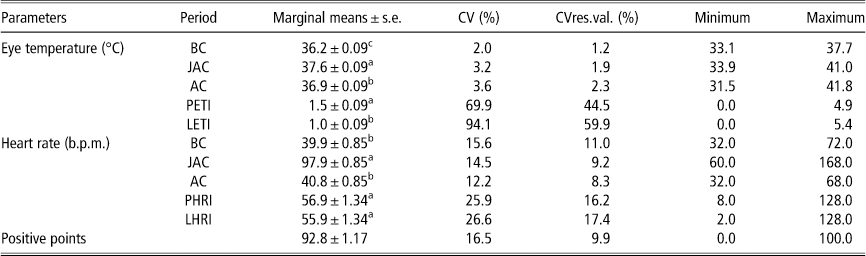
Table 1 includes descriptive statistics for ET and HR measurements in the competition phase and intervals and for the variable PP. The coefficient of variation was also calculated for residual values. The HR and ET marginal means showed the highest values when measured just after the competition and differed significantly (P<0.05) from measurements taken 3 h before the competition and 3 h after it. Higher coefficients of variation were shown between phases for HR measurements (ranging from 12.2% to 15.6%) than for ET measurements (from 2.0% to 3.6%). When accounting for differences between individuals (residual values), the coefficients of variation calculated for residual values represented globally 62.1%, 65.9% and 60% of the total coefficients of variation for the ET, HR and PP measurements, respectively. This percentage would refer to differences in these measurements not explained by the environmental factors considered. When accounting for intervals between phases, significant differences (P<0.05) were found between previous and later measurements only for ET. The range of the values was, in general, higher for HR and HRI measurements than for ET and ETI measurements.
Descriptive statistics for eye temperature (ET) and heart rate (HR) measurements for different phases within the competition, and for the variable positive points
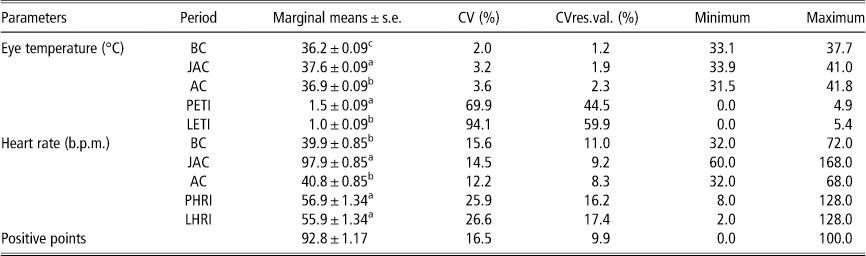
s.e.=standard error; CV=raw coefficient of variation; CVres.val.=coefficient of variation for residual values; BC=3 h before competition; JAC=just after competition; AC=3 h after competition; PETI=previous eye temperature interval; LETI=later eye temperature interval; PHRI=previous heart rate interval; LHRI=later heart rate interval.
a,b,cDifferent letters indicate significant differences (P<0.05) between means calculated for competition phases and interval measurements, within parameter.
Correlations between stress parameters and performance results
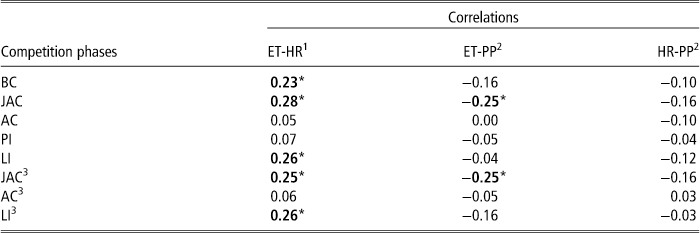
In order to ascertain any possible relation between ET, HR and sport performance results of the animals (measured through the variable PP), correlations and partial correlations (corrected by the effect of ET and/or HR variables measured 3 h before the competition within and between competition phases for residual values, were represented in Table 2. Significant correlations were found between ET and HR measurements and between ET and PP. These correlations ranged from 0.28 to 0.23 between eye temperature and HR measured just after competition and 3 h before the competition, respectively. Significant partial correlations of 0.25 and 0.26 were also found among these parameters for measurements taken just after the competition and for the later interval, respectively. When accounting for correlations between the ET and HR values with performance measurements, only ET showed significant and negative correlations with PP when measured just after the competition (−0.25), suggesting that the lower the eye temperature value, the better the competition results.
Phenotypic correlations and partial correlations between and within competition phases and with the competition results (PP), for eye temperature (ET), heart rate (HR) and interval measurements, for residual values

BC=3 h before competition; JAC=just after competition; AC=3 h after competition; PI=previous interval; LI=later interval; PP=positive points.
1 Pearson’s correlations.
2 Spearman’s Rank correlations.
3 Partial correlations (adjusted to the ET and HR variables measured 3 h before the competition).
Significant results highlighted in bold, following Benjamini and Hochberg’s FDR methodology.
* FDR=5%.
Influence of intrinsic and extrinsic factors on stress measurements
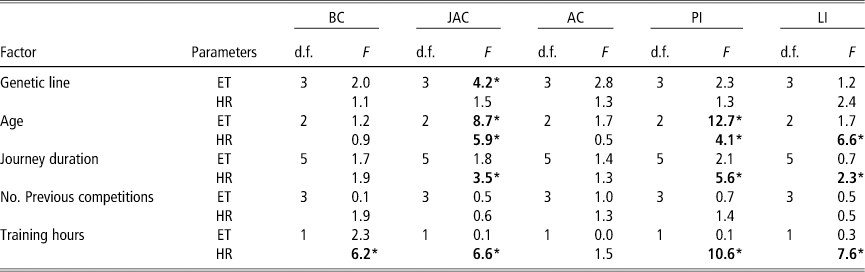
Table 3 showed the statistical analysis results of different intrinsic and extrinsic factors affecting ET and HR measurements (GLM procedure). For ET measurements per phase, ‘genetic line’ and ‘age of the animal’ were statistically significant, while for ET intervals, only the factor ‘age of the animal’ was statistically significant. The factors ‘age’, ‘journey duration’ and ‘training hours’, were statistically significant for HR measurements per phase and for HR intervals.
General linear model analysis of the different intrinsic and extrinsic factors affecting ET and HR measurements, for every phase of the competition
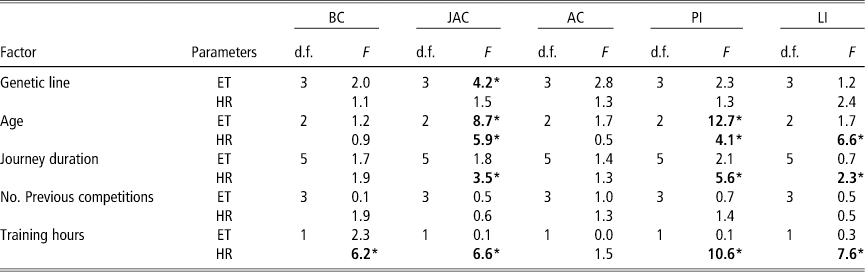
ET=eye temperature; HR=heart rate; BC=3 h before competition; JAC=just after competition; AC=3 h after competition; PI=previous interval; LI=later interval; df=degrees of freedom.
Significant results highlighted in bold, following Benjamini and Hochberg’s FDR methodology.
* FDR=5%.
Figure 1 showed the estimated marginal means of statistically significant factors found for ET (‘genetic line’ and ‘age’) and HR measurements (‘age’, ‘journey duration’ and ‘training hours’). The CDE belonging to the Anglo-Arab genetic line (with most of its ancestors from this breed) had significantly higher eye temperature values than the CDE animals belonging to other genetic lines for JAC phase of the competition. In the same way, 5-year-old animals showed significant higher PETI and ET measured just after the competition. When the ‘journey duration to the competition venue’ was between 4 and 8 h, the animals showed significant higher HR values than when it took from 0.5 to 4 h and over 8 h, for measurements taken either JAC or for LHRI and PHRI. Animals with 3 to 6 ‘hours of daily training’ showed significant higher HR values when measured JAC and for both intervals, although HR measured BC that showed significant higher values for animals with 6 to 10 ‘hours of training’.
Estimated marginal means for the significant factors ‘genetic line’ (a) and ‘age’ (b) for eye temperature measurements; and for the significant factors ‘age’ (c), ‘journey duration’ (d) and ‘training hours’ (e) for heart rate measurements. BC ( ) is 3 h before competition, JAC (
 ) is just after competition, PI (
 ) is previous interval and LI (
 ) is later interval. Different letters indicate significant differences (P<0.05) between classes within competition phase. (R) Variable referring to the axis on the right. (L) Variable referring to the axis on the left.
Discussion
The aims of this study were, first, to evaluate eye temperature assessed with IRT and HR to measure stress in horses during show jumping competitions and their relationship with competition results, and second, to evaluate the influence of different factors on the stress measurements assessed previously.
In this study, significant differences were found between competition phases for both parameters. In CDE, the ET ranges (36°C to 38°C) were higher than those reported by Hall et al. (Reference Hall, Burton, Maycock and Wragg2011) (28°C to 32°C). This is probably due to the fact that the horses in our study were measured during a sports event, and were thus confronted with different factors that could have produced a ‘stress response’ and hence, an increase in their basal ET measurements. ET intervals were similar to those reported by McGreevy et al. (Reference McGreevy, Warren-Smith and Guisard2012) in horses restrained with different bridle types (from 0.7 to 1.5, in absolute values). On the other hand, HR results were in the range and a little bit higher than those reported by other authors, from 34 to 93 b.p.m. (Covalesky et al., Reference Covalesky, Russoniello and Malinowski1992; Schmidt et al., Reference Schmidt, Möstl, Wehnert, Aurich, Müller and Aurich2010; Munsters et al., Reference Munsters, Visser, Van den Broek and Van Oldruitenborgh-Oosterbaan2012). The coefficients of variation calculated from residuals (intrinsic variation due to the individual, once the effect of the environmental factors included in the models was debugged) indicated that variability of both parameters was mainly explained by differences between animals. These results indicated a good potential of both parameters to assess individual differences.
Previous studies highlighted either HR (Von Borell et al., Reference Von Borell, Langbein, Després, Hansen, Leterrier, Marchant-Forde, Marchant-Forde, Minero, Mohr, Prunier, Valance and Veissier2007; Bitschnau et al., Reference Bitschnau, Wiestner, Trachsel, Auer and Weishaupt2010) or eye temperature (Hall et al., Reference Hall, Burton, Maycock and Wragg2011; McGreevy et al., Reference McGreevy, Warren-Smith and Guisard2012; Valera et al., Reference Valera, Bartolomé, Sánchez, Molina, Cook and Schaefer2012) as good indicators of stress in horses. Specifically, IRT has been used to assess acute stress in the elk during velvet antler removal (Cook et al., Reference Cook, Schaefer and Church2006) and in calves during disbudding (Stewart et al., Reference Stewart, Stafford, Dowling, Schaefer and Webster2008).
Generally, a state of distress in the animal develops over a relatively long period of time and commonly as a result of chronic stress. However, short, intense stressor(s) can also compromise animal well-being and induce distress as a response to acute stress (Moberg, Reference Moberg2000). In fact, despite the fact that most acute stress responses (like the ‘flight or fight response’) seem to be beneficial and desirable for the animal (as they promote a physical and physiological adaptation to the environment), some naturally rewarding behaviours, such as exercise, can also induce an acute stress response in a very similar profile to that which produces distress (Droste et al., Reference Droste, Gesing, Ulbricht, Muller, Linthorst and Reul2003). As regards horses, different studies have reported either negative or positive physical and physiological effects due to an acute stress response during exercise (Langsetmo et al., Reference Langsetmo, Fedde, Meyer and Erickson2000; Moberg, Reference Moberg2000).
In this study we found significant correlations of medium magnitude between the ET and HR parameters, for measurements taken BC and JAC. Taking into consideration that HR is considered by the Scientific Committee on Animal Health and Animal Welfare of the European Commission of Health and Consumer Protection as an appropriate tool for stress assessment in horses, and authors like Becker-Birck et al. (Reference Becker-Birck, Schmidt, Lasarzik, Aurich, Möstl and Aurich2013) have reported that the participation of horses in equestrian competitions causes an activation of the HPA function and an increase in sympathoadrenal activity indicated by a rise in HR, our results suggest a similar physiological basis for both parameters. However, a preliminary study found a reverse relationship between ET and HR during grooming (Stewart et al., Reference Stewart, Stratton, Beausoleil, Stafford, Worth and Waran2011), suggesting a parasympathetic control of the ET. On the other hand, Becker-Birck et al. (Reference Becker-Birck, Schmidt, Lasarzik, Aurich, Möstl and Aurich2013) found that sympathoadrenal activity was not only induced by the animals’ physical activity but also by emotional factors in the horses before and during the competition. This conclusion was also supported by other authors (Visser et al., Reference Visser, Van Reenen, Van der Werf, Schilder, Knaap, Barneveld and Blokhuis2002; Munsters et al., Reference Munsters, Visser, Van den Broek and Van Oldruitenborgh-Oosterbaan2012).
The results found in this study about the relationship between HR and ET measurements showed medium correlations between LHRI and LETI. When accounting for partial correlations between these parameters, we obtained the same value for this interval, suggesting that a later interval was not influenced by basal results. Furthermore, the significant partial correlation found between ET and HR measurements taken just after the competition was lower than the correlation between these phases, suggesting that the higher JAC correlation was mainly due to higher ET and HR basal levels. Thus, animals showing higher stress levels during show jumping competitions were probably animals with a greater tendency to show stress due to previous intrinsic factors, such as age or genetic line (as shown in this study) or other factors related to the physiological stages leading up to a competition (such as training status).
When accounting for the relationship between physiological measurements (ET and HR) and sport performance results (PP), significant negative correlations of medium magnitude were found only for the ET measurements in the JAC phase. These results suggest that a horse with high eye temperature would be more ‘stressed’ and therefore more prone to failure during competition. However, further research should be undertaken, as the medium magnitude of this correlation constitutes only a slight relation between the parameters.
The influence of intrinsic and extrinsic factors was assessed for ET and HR measurements (Table 3). We found that eye temperature was affected mainly by the intrinsic factors of ‘genetic line’ and ‘age of the animal’, whereas HR was mainly affected by the extrinsic factors of ‘journey duration to the competition venue’ and ‘training hours’. These results suggest that differences between values assessed with ET could be due in part to the animal response itself. However, it could share a physiological basis with HR (suggested by significant correlations found between these parameters) related to the exercise itself (sport induces higher HR, which induces an increase of blood flow mobilisation and thus higher peripheral temperature (Horohov, Reference Horohov2008)). On the other hand, it could also be partly related to consistent individual differences in responsiveness to stressors, which are better explained by temperament.
With respect to the differences found in ET due to the genetic composition of the animal (genetic line), the CDE is a composite breed in which, since the studbook is still open, the importation of foreign genetic material (from foreign sport horse breeds) is present (Bartolomé et al., Reference Bartolomé, Cervantes, Valera and Gutiérrez2011). Our results found CDE horses with mainly Anglo-Arab contribution in their pedigree showing significant higher ET values at JAC competition phase than a CDE belonging to other genetic lines. Previous studies have reported different temperaments in horses due to the breed, with the Thoroughbred and the Arab (which form the Anglo-Arab) as the most reactive breed of all (Hausberger et al., Reference Hausberger, Bruderer, Le Scolan and Pierre2004; Lloyd et al., Reference Lloyd, Martin, Bornett-Gauci and Wilkinson2008). This more reactive temperament might also imply a greater tendency to become ‘stressed’ in new situations (or simply competing), thus supporting our results.
As regards age, a tendency for ET to decrease with age was reported in humans (Alio and Padron, Reference Alio and Padron1982). In horses, ET measurements showed a different behaviour when measured either just after the competition or when accounting for the PI, as the highest ET values were shown by the 5-year-old animals. This could be explained by the fact that during these phases, the ET reflected the stress directly linked to sport performance. Thus it seems that for 5-year-old animals, the difficulty associated with the show jumping competition at this level was greater than the physical and physiological growth of the horse required to attain the adequate sport skills of this level, demanding a greater effort from the animal than expected.
HR values for age were significantly lower for 6-year-old animals, supporting Couroucé et al. (Reference Couroucé, Geffroy, Barrey, Auvinet and Rose1999) results which found lower HR results in horses with age. These results suggest, on the one hand, a background learning component (Kusunose and Yamanobe, Reference Kusunose and Yamanobe2002; Hall et al., Reference Hall, Burton, Maycock and Wragg2011) that could be producing these lower values as a result of habituation of the animal to stressors related to the show jumping competition. On the other hand, there is an improvement in the horse’s exercise workload and fitness with age and, hence, with training time (Evans, Reference Evans2008).
As regards ‘journey duration’, several authors have reported different stress responses for this parameter (Schmidt et al., Reference Schmidt, Möstl, Wehnert, Aurich, Müller and Aurich2010; Tateo et al., Reference Tateo, Padalino, Boccaccio, Maggiolino and Centoducati2012). We have found significant differences in ‘journey duration’ only for HR, and within it, when it was measured just after the competition and for both intervals (LHRI and PHRI), thus affecting mainly the performance ability of the animal. Schmidt et al. (Reference Schmidt, Möstl, Wehnert, Aurich, Müller and Aurich2010) reported high HR values (higher than basal HR values) up to 6 h after a journey duration of 8 and 3.5 h. In our study, horses arrived at the competition centre 1 day before the jumping exercise. Fazio et al. (Reference Fazio, Medica, Cravana, Giacoppo and Ferlazzo2009) suggested a cumulative effect on an individual horses’s HR due to novel environments experienced during transport. Taking into consideration that the animals used in this study were young (4 to 6 years old) and thus more inexperienced, the stress related to ‘journey duration’ together with the stress related to the competition event, could increase this cumulative effect, leading to a decrease in the horse’s physical resistance and workload and, hence, its performance ability. However, these findings need further investigation.
As regards ‘training hours’, it seems that, in general, the higher the number of training hours, the lower the HR values during competitions (either for phases or for intervals). This supports previous studies describing HR as a measure of the animal’s physical effort during competitions (Von Borell et al., Reference Von Borell, Langbein, Després, Hansen, Leterrier, Marchant-Forde, Marchant-Forde, Minero, Mohr, Prunier, Valance and Veissier2007), thus improving their sport resistance with training.
As for the ‘number of previous competitions’, although it seemed that the learning component was a key factor affecting stress in horses during sport events (Kusunose and Yamanobe, Reference Kusunose and Yamanobe2002; Hall et al., Reference Hall, Burton, Maycock and Wragg2011), no statistically significant differences were found for any of the parameters studied.
Conclusions
The statistically significant correlations of medium magnitude found between ET and HR measurements suggest that these parameters could share a similar physiological basis. However, the factors that most influence each parameter were different, with intrinsic factors affecting mainly ET measurements and extrinsic factors affecting mainly HR measurements.
The significant negative correlations found between ET and PP for one of the three competition phases showed that the lower the eye temperature of the horse before and during the exercise, the better the results obtained.
Thus, from our results, it could be hypothesised that a horse with a relatively acute rise in eye temperature and/or HR would be more ‘stressed’ and therefore more prone to failure during competition. These results also suggest that ET might be a suitable tool for stress assessment during show jumping competitions in horses. However, further studies are required to confirm these hypotheses.
Acknowledgements
The authors thank the Spanish Sport Horse Breeders Association (ANCADES) and the riders and owners of the horses involved in this study for their collaboration.