I. INTRODUCTION
Metallic nanoparticles (NPs), such as Au, Pt, Zn, Cu (Revina et al., Reference Revina, Oksentyuk and Fenin2007; Chaloupka et al., Reference Chaloupka, Malam and Seifalian2010; Sotiriou and Pratsinis, Reference Sotiriou and Pratsinis2010; Cioffi and Rai, Reference Cioffi and Rai2012; Aguilar, Reference Aguilar2013), and their nanocomposites (such as nanometallic-doped ceramics or polymers), especially silver in nanometer size (nAg) (Gong et al., Reference Gong, Liang, Huang, Chen, Jiang, Shen and Yu2007; Baheiraei et al., Reference Baheiraei, Moztarzadeh and Hedayati2012; Dong et al., Reference Dong, Liu, Sun, Chang and Guo2014; Nowak et al., Reference Nowak, Szade, Talik, Zubko, Wasilkowski, Dulski, Balin, Mrozik and Peszke2016) are very attractive materials for medical application because of their bactericide features.
Bacterial infections are a major problem after implantation and can result in the rejection of implants. Therefore, it is reasonable to ensure the antibacterial activity of implantation materials. This aim is achieved by modifying the surface of implants with antibiotics or silver particles in the nanometer size (nAg). It turns out that nanosilver and antibiotics have a similar effect on microorganisms. However, microorganisms do not become resistant to silver. Thus, silver is a one of the most effective elements which can be applied against 99.9% of bacteria and fungi (Chaloupka et al., Reference Chaloupka, Malam and Seifalian2010; Sotiriou and Pratsinis, Reference Sotiriou and Pratsinis2010; Aguilar, Reference Aguilar2013). It can also be successfully used as an individual element in the production of protective coatings and help to develop innovative multifunctional composites.
Silica is a biocompatible, non-toxic material, which does not cause allergy. It has good adhesive properties and a potential to create chemical bonds with metallic substrates. In addition, silica matrix enables incorporation of metal ions (e.g. silver) in low concentrations and their gradual release into the environment, which will provide a long-lasting antibacterial effect (Gong et al., Reference Gong, Liang, Huang, Chen, Jiang, Shen and Yu2007; Baheiraei et al., Reference Baheiraei, Moztarzadeh and Hedayati2012; Aguilar, Reference Aguilar2013; Dong et al., Reference Dong, Liu, Sun, Chang and Guo2014). Therefore, a composite system in such a form may be used as a material for preparing multifunctional layers.
Quality, structure, chemical composition, morphology, and surface topography are also very important for the implant acceptance in the organism and metabolic processes of surrounding tissues. The quality of coatings depends on the applied surface modification technique and the quality of the starting materials. The applied surface engineering method affects the microstructure, porosity, adhesion force, morphology, and topography of the coatings. Most of these techniques require elevated temperatures or post-sintering treatment (Dickerson and Boccacini, Reference Dickerson and Boccacini2012; Dudek and Goryczka, Reference Dudek and Goryczka2016), which results in structural changes of materials and significantly affects their crucial properties. Therefore, it is very important to carry out a detailed characterization of structural changes during heat treatment for every novel material.
The main goal of this paper is to determine optimal temperature conditions, which allow preserving structural and physicochemical properties of SiO2/Ag nanocomposite. For this purpose, high-temperature X-ray diffraction (HT-XRD) measurements were carried out so as to correlate the temperature effect with structural changes of the material. The characteristics of initial silica–silver nanocomposite powder before and after heat treatment were analyzed using XRD, infrared spectroscopy, and scanning electron microscopy/energy dispersive spectrometer (SEM/EDS) microscopy.
II. MATERIAL AND METHOD
Silicon dioxide/silver nanocomposite was synthesized by a chemical reaction method. The starting materials were silicon dioxide, potassium hydroxide, nitric acid, ammonia, and silver acetate. All used chemicals were of analytical grade and commercially available. First, the silicon dioxide was mixed with 50 ml distilled water in the ratio 1:5, respectively and 0.2 ml potassium hydroxide with 0.01 ml of ammonia. To the colloid suspension was added dropwise 10 ml of 4% silver acetate water solution. Then to stirred colloid solution was put 0.02 ml of concentrate nitric acid. Finally, the system was filtered on a polyethylene filter, washed, and dried at room temperature.
The structure of the material was investigated by an X'PertPro MPD PANalytical X-ray diffractometer with a CuK α tube. The content of amorphous phase for the initial SiO2/Ag powder was determined using 15 wt.% crystalline quartz (SiO2) as an internal standard (Gualtieri, Reference Gualtieri1999). HT-XRD measurements were performed at a temperature ranging from 25 to 1200 °C with a heating/cooling rate of 10/30 °C per minute, using a high-temperature chamber Anton Paar HTK 2000. The sample was placed on a 1 mm-thick c-ZrO2 protective plate to prevent chemical reactions of Ag with the Pt heating stripe at elevated temperatures. The protective plate material was inert in the tested system. XRD patterns were collected every 20° with 5 min soaking. The quantitative phase analyses and lattice parameters were refined by the Rietveld method (Rietveld, Reference Rietveld1969) with HighScore Plus software. The silver content was determined from the net area of silver diffraction line (111) at 2θ = 38.085° collected at low temperatures.
Infrared (IR) measurements were carried out using an Agilent Cary 640 FTIR spectrometer equipped with a standard source and a DTGS Peltier-cooled detector. The spectra were collected at room temperature using GladiATR diamond equipment (Pike Technologies) within 4000–400 cm−1 range. All the spectra were collected before and after thermal treatment with a spectral resolution of 4 cm−1 and recorded in the form of 16 scans. The baseline correction was done and water vapor and carbon dioxide was subtracted from each spectrum.
SEM data were obtained by TESCAN Mira 3 LMU equipped with an EDS from Oxford Instruments – Aztek. Images were collected by secondary electrons and backscattered electrons (BSE). The measurements were carried out on the samples covered by 5 nm of Cr layer by using Quorum Q150T ES equipment.
III. RESULTS AND DISCUSSION
A. Initial material
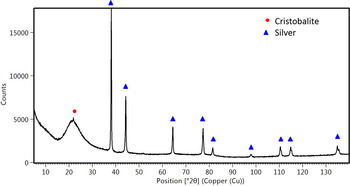
The results of determining the phase composition of SiO2/Ag nanocomposite are illustrated in Figure 1. The XRD measurements carried out for the powder material showed its crystalline and amorphous state. Strong and sharp diffraction lines originate mainly from silver (Ag) with a cubic structure (Fm-3m) “PDF 04-004-6434 (ICDD, 2015)” and, to a lesser extent, from cristobalite (SiO2) with a tetragonal structure (P41212) “PDF 04-007-5018 (ICDD, 2015)”. Thus, the lattice parameters based on the Rietveld refinement for silver are determined as a 0 = 4086(9) Å, while for cristobalite as a 0 = 5.195(2) and c 0 = 6.465(7) Å. Quantitative analysis of SiO2/Ag nanosystems allows finding the percentage amount of crystalline silver, cristobalite and amorphous phases in the whole volume as 4.2(1), 0.3(2), and 95.5(1)%, respectively. Satisfactory values of agreement indices R exp = 2.13, R wt = 6.73%, and GoF = 3.16 were achieved.
XRD pattern collected at ambient temperature for SiO2/Ag powder.

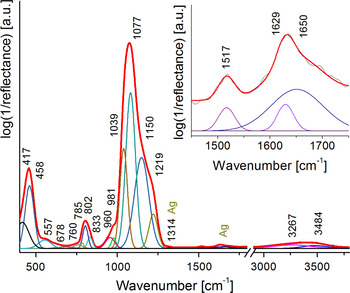
The IR spectrum of the initial SiO2/Ag nanocomposite is presented in Figure 2. The spectrum is dominated by three absorption bands centered in the 400–1300 cm−1 region, ascribed to Si–O–Si vibrations (Ramalingam et al., Reference Ramalingam, Devi, Rao and Nair2014). In more detail, the deconvolution procedure points to the presence of bands centered at 960, 981 cm−1, which originate from the Si–OH bond (Ramalingam et al., Reference Ramalingam, Devi, Rao and Nair2014), structural deformation within the silica network or non-stoichiometric silicon oxide (Zhao et al., Reference Zhao, Wang, Ding, Lin, Hu, Si, Yu and Sun2011). The Si–O–Si band separation (445 cm−1 pure silica = 417 + 458 cm−1) suggests the silica network deformation as well as the formation of an outer polymeric cage within the silica network (Shameema et al., Reference Shameema, Ramachandran and Sathyamurthy2006; Ramalingam et al., Reference Ramalingam, Devi, Rao and Nair2014). Additionally, weak bands located at ca. 1500 cm−1 might be ascribed to the presence of silver, while the bands between 1650 and 1750 cm−1 to the stretching vibration of υ(C=O) from the aldehyde group and/or the deformational mode of water molecule. In the high wavenumber region (3200–3800 cm−1), the bands originate from the stretching mode of υ(Si–OH), υ(OH) as well as molecular water [υ(H–O–H)] adsorbed on the silica surface (Moghanian et al., Reference Moghanian, Mobinikhaledi, Blackmanc and Sarough-Farahani2014; Ramalingam et al., Reference Ramalingam, Devi, Rao and Nair2014). The presence of hydroxyl groups might also be because of hydroxyl ions over the Ag NPs. The aldehyde and polymeric groups might originate from substrates used in the manufacturing process of SiO2/Ag nanocomposite.
IR spectra of SiO2/Ag nanocomposite fitted by Voigt curves in the 400–3800 cm−1 range. Magnified region ranged between 1450 and 1750 cm−1 summarizes a potential region of silver occurrence.

BSE–SEM image of SiO2/Ag nanocomposite is presented in Figure 3. Microscopic observations combined with an EDS analysis revealed the occurrence of silica in nanometer size with a tendency to agglomerate in higher aggregates (gray areas in Figure 3). Moreover, brighter areas in Figure 3 result from the presence of silver in the silica matrix in two forms – homogenously distributed NPs [Figure 3(a)] and its agglomerates [Figure 3(b)]. The size of silver particles estimated on the basis of SEM images was found to vary from a few nanometers to even ca. 300 nm.
BSE–SEM image of SiO2/Ag composite.

B. Structural changes of SiO2/Ag composite at high temperatures
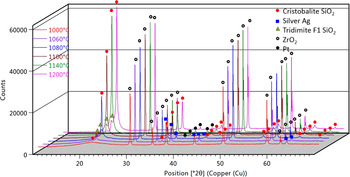
HT-XRD patterns recorded for SiO2/Ag composite show no phase transformations during temperature alterations up to 1000 °C. It is especially well visible in an analysis of the intensity and net area of the peak (101) at 2θ = 21.916° of cristobalite and background level characteristic of amorphous phase, which remain unchanged during the sample heating. The XRD patterns revealed only a slight shift of diffraction lines caused by the material's thermal expansion. However, there were no signs of amorphous silica crystallization. HT-XRD data presented in Figure 4 revealed the initial stage of crystallization of amorphous silica above 1040° toward the high-temperature type of cristobalite with a cubic structure (Fd-3m) “PDF-04-007-5021 (ICDD, 2015)”. The most intensive crystallization effect was found in the temperature range of from 1080 to 1120 °C. Above 1140 °C no difference in the intensity of reflections belonging to cristobalite was visible. Additionally, at temperatures above 1080 °C the appearance of diffraction lines from tridymite (SiO2) with a disordered anorthic F1 structure was observed “PDF 01-071-0261 (ICDD, 2015)”. Their intensities increase up to 1140 °C and then remain unchanged. Diffraction data also revealed a decrease in the background level characteristic of amorphous phase up to 1140 °C. As a result, above 1140° the material is mainly composed by crystalline silica phases.
HT-XRD patterns for SiO2/Ag composite measured from 1000 to 1200 °C.

It is noteworthy that because of high-temperature experiments and the necessity to use a protective plate holder, additional diffraction lines originating from ZrO2 with a cubic structure (Fm-3m) “PDF 04-005-9865 (ICDD, 2015)” were observed. Furthermore, evaporation of platinum from the heating stripe at 1080 °C results in its depositing on the composite surface and generates additional diffraction lines from crystalline platinum (Pt) with a cubic structure (Fm-3m) “PDF 04-003-7036 (ICDD, 2015)”.
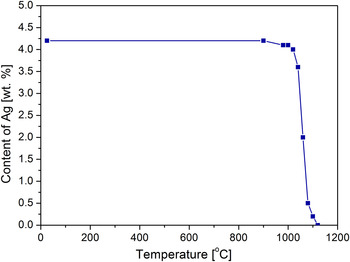
Finally, XRD results revealed a decrease of the net area and intensities of diffraction lines belonging to the crystalline silver because of Ag evaporation from the composite (Figure 5). Interestingly, the silver concentration estimated on the basis of XRD results is not affected by temperature changes even up to 900 °C. In the temperature range of 900–1000 °C, a slight decrease in the intensity of silver diffraction lines corresponds to a decrease of silver amount from 4.2 to 4.1%, whereas 89% of Ag evaporates from the composite at temperatures between 1060 and 1080 °C. Above 1110 °C silver was no longer detectable by the X-ray method.
Changes in Ag content determined from HT-XRD data.

C. Material after heat treatment
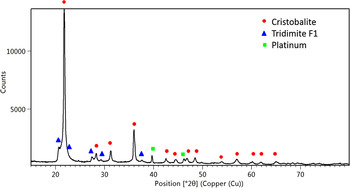
XRD pattern of the composite after tests revealed the presence of cristobalite (SiO2) with a tetragonal structure (P41212) “PDF 04-007-5018 (ICDD, 2015)” and tridymite with the F1 structure “PDF 01-071-0261 (ICDD, 2015)”. Some distortion of the right side of the main diffraction line of cristobalite (101) at 2θ = 21.916° and an unclearly visible weak and broad peak of the left side, belonging to tridymite, might indicate a poorly-crystallized anorthic F1 tridymite structure. According to the ICCD data, the lattice parameters of that phase are as followed: a 0 = 9.9320, b 0 = 17.2160, and c 0 = 81.8640 Å. Such a large size of the unit cell leads to disorder in the structure of tridymite and results in distortions of diffraction lines in the X-ray patterns.
Moreover, there are no diffraction lines belonging to silver. Platinum with a cubic structure (Fm-3m) “PDF 04-003-7036 (ICDD, 2015)” occurred as a consequence of evaporation from the heating stripe and deposition of the investigated material on the surface. The positions of platinum diffraction lines indicate no chemical reactions between the composite material and Pt ions.
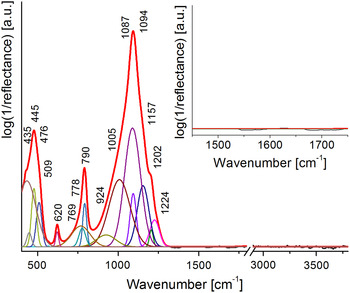
The IR spectrum of SiO2/Ag after heat treatment is presented in Figure 6. The deconvolution procedure and peak fitting analysis revealed only the presence of typical Si–O–Si (750–1300 cm−1) and O–Si–O (350–750 cm−1) vibrations as well as the lack of silver, hydroxyl, and polymer bands. Moreover, the band position (445 cm−1) confirmed the metal-free silica structure. A more detailed analysis revealed cristobalite bands centered at 509, 620, 790, and 1094 cm−1 (Sitarz et al., Reference Sitarz, Handke and Mozgawa2000; Liang et al., Reference Liang, Miranda and Scandolo2006; Koike et al., Reference Koike, Noguchi, Chihara, Suto, Ohtaka, Imai, Matsumoto and Tsuchiyama2013) and tridymite ones located at 435, 476, 778, 1005, and 1157 cm−1 (Wilson et al., Reference Wilson, Russell and Tait1974; Sitarz et al., Reference Sitarz, Handke and Mozgawa2000). The location of other bands is probably associated with structural deformation within the silica network, which is confirmed by X-ray measurements (Figure 7).
IR spectra of SiO2/Ag nanocomposite after heat treatment fitted by Voigt curves in the 400–3800 cm−1 range. Magnified region ranged between 1750 and 1450 cm−1 summarizes the presence of a region of potential silver occurrence.

XRD pattern recorded at ambient temperature for SiO2/Ag powder after heat treatment.

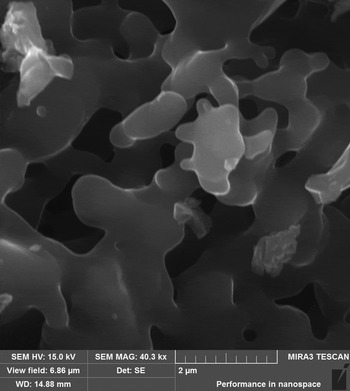
SEM studies revealed consolidation of silica NPs to irregular shapes and an increase of their size from nano- to micrometer's level (Figure 8). It should be noted that an increase of NPs size is an unfavorable effect, which may lead to changes of desirable material properties. The chemical composition of the tested composite after thermal treatment obtained from EDS analysis revealed the lack of signal from silver and the presence of silica and oxygen: the main elements of cristobalite and tridymite.
BSE–SEM image of the composite after heat treatment.

IV. CONCLUSIONS
XRD studies revealed that the structure of SiO2/Ag composite was stable up to 1000 °C without clearly visible silver evaporation from the material. IR spectroscopy confirmed the predominant presence of amorphous phase in the composite and the presence of silver embedded into the silica matrix. HT-XRD measurements revealed the initiation of cristobalite crystallization from amorphous phase at 1060° and tridymite at 1080 °C. XRD and IR data revealed the presence of only two silica phases: cristobalite and tridymite after heat treatment. Moreover, the most of silver content was found to decrease above 1060 °C, whereas above 1110 °C silver in the sample was no longer detectable in the sample by X-ray (XRD), microscopy (SEM–EDS) or spectroscopy methods (IR). Finally, sintering of silica NPs and a significant increase of the particles size was observed. In order to preserve silver particles in the composite, the heat treatment temperature should not exceed 1000 °C.