Introduction
Invasive plant species can alter the dynamics (Ehrenfeld Reference Ehrenfeld2010; Chau et al. Reference Chau, Walker and Mehltreter2013), structure (Hawkes et al. Reference Hawkes, Belnap, D’Antonio and Firestone2006; Hladyz et al. Reference Hladyz, Åbjörnsson, Giller and Woodward2011), and function (Ehrenfeld Reference Ehrenfeld2010; Weidenhamer and Callaway Reference Weidenhamer and Callaway2010; Spirito et al. Reference Spirito, Yahdjian, Tognetti and Chaneton2014) of native ecosystems. Through cascading effects, invasive plants can affect other trophic levels (e.g., Levine et al. Reference Levine, Vilà, D’Antonio, Dukes, Grigulis and Lavorel2003), though comparatively little is known about these interactions (Simao et al. Reference Simao, Flory and Rudgers2010). Differential responses of arthropods to invasive plants have the potential to drastically alter ecosystems, as arthropods are key connectors between primary producers and higher trophic levels, and also provide important ecosystem services such as pollination (Potts et al. Reference Potts, Biesmeijer, Kremen, Neumann, Schweiger and Kunin2010) and decomposition (Lattin Reference Lattin1993).
When introduced into a native ecosystem, exotic invasive plant species have the potential to elicit a variety of responses from arthropods. Arthropod abundance and diversity has been shown to respond positively (Harris et al. Reference Harris, Toft, Dugdale, Williams and Rees2004; Pearson Reference Pearson2009; Emery and Doran Reference Emery and Doran2013), negatively (Simao et al. Reference Simao, Flory and Rudgers2010; Holmquist et al. Reference Holmquist, Schmidt-Gengenbach and Slaton2011; Ballard et al. Reference Ballard, Hough-Goldstein and Tallamy2013), and neutrally (Frenzel and Brandl Reference Frenzel and Brandl2003; Agrawal et al. Reference Agrawal, Kotanen, Mitchell, Power, Godsoe and Klironomos2005; Procheş et al. Reference Procheş, Wilson, Richardson and Chown2008) to the presence of an exotic invasive plant species. The direction and magnitude of the response could depend on a variety of factors, including phylogenetic relatedness and phenology. For example, the degree to which the exotic species shares traits in common with native plants in the region (e.g., defence compounds, volatiles, allelochemicals), which itself could depend on phylogenetic relatedness (Ricciardi and Ward Reference Ricciardi and Ward2006; Wiens et al. Reference Wiens, Ackerly, Allen, Anacker, Buckley and Cornell2010), may influence the degree to which arthropods associate with the new invader (Agosta Reference Agosta2006; Bezemer et al. Reference Bezemer, Harvey and Cronin2014). Invaders and their closely related native species are generally expected to share similar arthropod assemblages, as arthropods adapted to native plants may also find the invader attractive due to similar traits (Hill and Kotanen Reference Hill and Kotanen2009; Ness et al. Reference Ness, Rollinson and Whitney2011).
Phenology, in particular the timing and frequency of flowering of native and exotic plants, may also alter insect responses (Bezemer et al. Reference Bezemer, Harvey and Cronin2014). Several studies have found that insect pollinator communities do not differ between co-flowering native and exotic species (Bartomeus et al. Reference Bartomeus, Vilà and Santamaría2008; Woods et al. Reference Woods, Jonas and Ferguson2012), though exotic plants have, on average, more pollinator visitations than co-occurring native plants (Morales and Traveset Reference Morales and Traveset2009; Montero-Castaño and Vilà Reference Montero-Castaño and Vilà2012). Pyšek et al. (Reference Pyšek, Jarošík, Chytrý, Danihelka, Kühn and Pergl2011), however, found that the diversity of pollinator species associated with exotic plants increased with their time in the invaded area.
Regardless of their underlying causal mechanisms, differences in arthropod assemblage structure between co-occurring native and exotic plant species could have implications for the entire ecosystem (e.g., Bezemer et al. Reference Bezemer, Harvey and Cronin2014). Thus, investigating and quantifying such differences within the invaded ranges of exotic species represents an important contribution to invasive species research.
Russian olive (Elaeagnus angustifolia Linnaeus; Elaeagnaceae) is an exotic shrub/tree that has become invasive in many riparian ecosystems throughout the great basin and western North America, including southern British Columbia, Canada (Collette and Pither Reference Collette and Pither2015). Despite its prevalence and the potentially dramatic impacts it can have on riparian and aquatic ecosystems (Katz and Shafroth Reference Katz and Shafroth2003; Mineau et al. Reference Mineau, Baxter and Marcarelli2011, Reference Mineau, Baxter, Marcarelli and Minshall2012), little is known about the arthropods that associate with Russian olive, especially in comparison to those that associate with co-occurring native plants. To our knowledge, only two previous studies have surveyed arthropods associated with Russian olive. Kennedy and Wilson (Reference Kennedy and Wilson1969) examined the prevalence and diversity of insect pests on shelterbelt plants in North Dakota, United States of America. Using field surveys, they collected over 30 species of insects and mites from 23 species of shrubs and trees, yet, no insects were found on Russian olive (Kennedy and Wilson Reference Kennedy and Wilson1969). These results should be interpreted cautiously because the researchers were focussed on quantifying the prevalence of insect pests, rather than insects more generally. Nevertheless, the absence of insect pests on Russian olive is consistent with the enemy release hypothesis (Keane and Crawley Reference Keane and Crawley2002), and may contribute to Russian olive’s success as an invader in North America. Pendleton et al. (Reference Pendleton, Pendleton and Finch2011) sampled insects on Russian olive, salt cedar (Tamarix Linnaeus; Tamaricaceae), and willow (Salix exigua Nuttall; Salicaceae) plants, and found that willow had the greatest number of insect orders and families. Sampling on Russian olive was severely limited however (15 collection units, defined as 10 passes of the sweep-net over the plant, versus 80 collection units on willow and 79 on saltceder), precluding reliable conclusions. Insects were collected using a sweep net on a portion of the plant, which can be ineffective when sampling trees and shrubby plants (Churchill and Arthur Reference Churchill and Arthur1999).
Our objective here is to address the following question: Within the invaded range of south-central British Columbia, how does the abundance, diversity, and composition of insect assemblages compare among Russian olive and the native plants Woods’ rose (Rosa woodsii Lindley; Rosaceae) and Saskatoon (Amelanchier alnifolia (Nuttall) Nuttall ex Roemer; Rosaceae)? The latter two species exhibit similar growth form to Russian olive, and all three species commonly co-occur.
Methods and materials
Focal native plant species
Woods’ rose and Saskatoon are shrubs that are widespread and locally abundant throughout the bunchgrass biogeoclimatic ecosystem classification (BEC) zones of southern British Columbia, and commonly co-occur with Russian olive where it has been established. Native to the central and western United States of America and Canada, Woods’ rose is a long-lived shrub that can grow from 0.5 to 3.0 m tall, and thrives in a variety of habitat types (Pavek and Skinner Reference Pavek and Skinner2013). Like Russian olive (Douglas et al. Reference Douglas, Meidinger and Pojar1999; Katz and Shafroth Reference Katz and Shafroth2003), it is capable of surviving as an understorey plant in moist and dry habitats and is commonly found in riparian areas, along lakeshores, and roadways (Pavek and Skinner Reference Pavek and Skinner2013). Species within the genus Rosa Linnaeus freely hybridise (Lewis and Basye Reference Lewis and Basye1961; Atienza et al. Reference Atienza, Torres, Millán and Cubero2005; Joly and Bruneau Reference Joly and Bruneau2006) and Woods’ rose may form hybrids with other native roses across its range (Hitchcock et al. Reference Hitchcock, Cronquist, Ownbey and Thompson1969). Saskatoon is a shrub that can reach a height of 7 m and is native across the United States of America and Canada (Nesom Reference Nesom2006). Saskatoon is able to survive as an understorey plant and is fairly drought tolerant, but prefers moist soils. It is most commonly found in thickets, woodland margins, low to montane hillsides, and riparian areas (Lim Reference Lim2012).
Woods’ rose and Saskatoon are phylogenetically more closely related to each other than either of them is to Russian olive (Fig. S1), while Woods’ rose’s flowering and fruiting time is more similar to Russian olive’s than it is to Saskatoon’s (Fig. S2).
Study region and sampling design
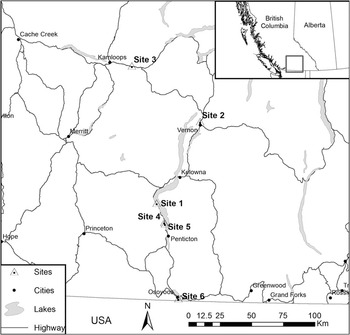
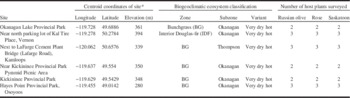
Six sites between Osoyoos, British Columbia and Kamloops, British Columbia were chosen for sampling (Fig. 1). Five sites were located within the bunchgrass BEC zone, while the Vernon site belonged to the interior Douglas-fir BEC zone. All sites were within the “very dry hot” BEC variant (Table 1).
Location of the six field sites within British Columbia, Canada. Projection: NAD 1983 UTM Zone 11.

Site descriptions and number of host plant types sampled per site. Longitude and latitude are decimal degree values.

* WGS84 datum.
Sites were separated by at least 1 km, and all host plants at each site were located between three and 320 m from each other. At each site we sampled insects on two or three plants of each species (Russian olive, rose, and Saskatoon), yielding a total of 15 Russian olive, 15 rose, and 15 Saskatoon plants across all study sites. Individual plants were flagged, and were each sampled at three separate times during the summer of 2013; late June, late July, and late August. Each time, we sampled host plants between 9 AM and 5 PM, and ensured that the date and time of sampling was haphazard among sites. We sampled exclusively on dry days, though cloud cover varied among sampling times.
Since Woods’ rose can form hybrids with other native roses (Hitchcock et al. Reference Hitchcock, Cronquist, Ownbey and Thompson1969), it is possible the Woods’ roses we sampled are in fact hybrids. We therefore refer to the Rosa plants sampled as “rose” in our results.
We sampled insects using the beat method, which involves beating a branch and capturing any insects that fall onto a sheet held below. This method is commonly used for insect sampling on trees (Basset Reference Basset1999; Ribeiro et al. Reference Ribeiro, Borges, Gaspar, Melo, Serrano and Amaral2005; Campos et al. Reference Campos, Vasconcelos, Ribeiro, Neves and Soares2006) and was used for Russian olive biocontrol agent surveys in its native range (U. Schaffner, personal communication 2013). The beat sheet consisted of a 1 m2 polyvinyl chloride frame overlaid with rip-stop Nylon. We cut a hole in the middle of the sheet and attached a 100-mL plastic vial lid, with the middle portion removed (leaving only the outer portion of the lid with threads), using a circular clamp. For insect sampling on each plant, the container portion of the vial was filled with 30 mL of 70% ethanol and secured to the lid in the beat sheet. This container was replaced after each individual plant was sampled. Five branches within arm’s reach were haphazardly selected and beat five times each using a 1-m-long polyvinyl chloride pipe. Any insects left on the beat sheet were gently moved into the vial using a paintbrush. We overturned the beat sheet, shook it vigorously and then visually inspected it for remnant insects before sampling another plant. The vials were placed in a freezer set at −18 °C until they could be processed (debris removed and insects identified), which was usually no more than two days after sampling.
Insect identification
We identified all adult insects (n=1360 individuals) to family using the keys in Borror et al. (Reference Borror, Triplehorn and Johnson1989). These keys were somewhat outdated with respect to family taxonomy, therefore for each family identified, we verified its current classification and name using relevant literature. Immature insects, amounting to 3340 individuals (78% of which were thrips; Table S1), were excluded from analyses. Following identification, the insects were stored in 70% ethanol in a freezer set at −18 °C.
Data analyses
All statistical analyses were conducted at the taxonomic resolution of families, thus all individuals were pooled within a given family. To obtain a synoptic picture of the host plant’s insect community across the summer season, we pooled the family abundance data for each plant across the different sampling periods and sites. All analyses were conducted using R (version 3.1.0; R Development Core Team 2014), and community/diversity analyses were done using the “vegan” package (Oksanen et al. Reference Oksanen, Blanchet, Kindt, Legendre, Minchin and O’Hara2013). Unless otherwise noted, we used a significance level of α=0.05.
To evaluate the thoroughness of sampling, we generated sample-based rarefied taxonomic accumulation curves using methods described by Gotelli and Colwell (Reference Gotelli and Colwell2001). We calculated total insect abundance, family richness, and Shannon diversity among all plant types. We tested the null hypothesis that (adult) insect abundance was, on average, equal among plant types using a negative binomial generalised linear model (GLM), implemented using the “nb.glm” function in the MASS R package (Venables and Ripley Reference Venables and Ripley2002). A negative binomial model was found to be suitable (e.g., compared to a Poisson model) based on regression diagnostics (not shown). We compared mean family richness among plant types using analysis of variance (ANOVA) and a Tukey–Kramer honest significant difference post-hoc test. Shannon diversity scores exhibited unequal variances among plant types, and transformations were unsuccessful in equalising variances. We therefore used the “oneway.test” function in R that accommodates unequal variances, and the Games–Howell post-hoc test (R script obtained from http://www.psych.yorku.ca/cribbie/6130/games_howell.R) to evaluate pairwise comparisons.
We used two complementary approaches to analyse variation in family composition among plant types: (i) generalised linear model-based analysis of multivariate abundance (henceforth multiGLM), using the “mvabund” package (Wang et al. Reference Wang, Naumann, Wright and Warton2012), and (ii) canonical analysis of principal coordinates (henceforth CAP) using the “capscale” function within the vegan package. The multiGLM method essentially conducts a series of univariate F-tests of the effects of the factor(s) of interest on each taxon’s abundance, whereas the CAP method, by analysing a distance (dissimilarity) matrix, focusses more on assemblage composition differences in relation to the factor(s) of interest (Anderson and Walsh Reference Anderson and Walsh2013). To clarify the relative contributions of particular taxa and sites (individual host plants) to the CAP results, we used the “beta.div” function (Legendre and De Cáceres Reference Legendre and De Cáceres2013) to calculate the “species contributions to beta diversity” (SCBD) and the “local contributions to beta diversity” (LCBD). Given a site x species abundance matrix “Y”, and Var(Y)=SSTotal/(n–1) providing a measure of total beta diversity, SCBD j reflects the relative contribution of the jth species to the total beta diversity (SS j /SSTotal). Likewise, LCBD i reflects the relative contribution of the ith site to the total beta diversity (SS i /SSTotal). Local contributions to beta diversity represents the degree of uniqueness of the sampling unit in terms of community composition, and can be tested for significance using a permutation test (Legendre and De Cáceres Reference Legendre and De Cáceres2013). For the CAP and beta.div analyses, we used Hellinger-transformed abundances (Legendre and Gallagher Reference Legendre and Gallagher2001), and the Bray–Curtis dissimilarity index was used for the CAP analysis. The CAP analysis enables visualisation, in multidimensional space, of how surveyed plants (n=45 plants; 15 for each of three species) differ with respect to the composition of their associated insect assemblages, and also provides a permutation test that evaluates the significance of the constraining factor (plant type), using 999 permutations. As a form of post-hoc pairwise comparison test, we repeated the permutation test for all possible three pairings of plant species, and evaluated the resulting P-value against Bonferroni-adjusted significance levels (0.05/3=0.0167). For the multiGLM analysis the response variables comprised the total abundance of each family on each of the 15 plants per plant species. We specified a negative binomial regression, which is suitable for count data, and verified using residual diagnostics that the model assumptions were met (not shown). We followed the overall multiGLM test with univariate tests of the effect of plant type on the abundance of each insect family, with the P-values adjusted for multiple tests. For all composition analyses, we used only the 13 families that consisted of 10 or more individuals (see Table S2). Using the 23 families with at least five individuals each yielded results that were qualitatively identical (not shown).
Results
We caught and identified a total of 1360 adult insects belonging to 71 different insect families in 11 insect orders (Table S2). A total of 19 insect families was uniquely associated with rose, 13 with Russian olive, and nine with Saskatoon (Table S3), although the majority of these associations were due to singletons. Excluding singletons, these numbers reduced to three (Chrysolmelidae (Coleoptera), Aleyrodidae (Hemiptera), and Cynipidae (Hymenoptera)), three (Chloropidae, Heleomyzidae, and Gryllidae), and one (Rhopalidae (Hemiptera)) respectively (Table S3). Russian olive was also associated with five Lathridiidae (Coleoptera) individuals and 11 Anthicidae (Coleoptera) individuals (all from the subfamily Notoxinae), however, one individual from each of these families was also found on rose.
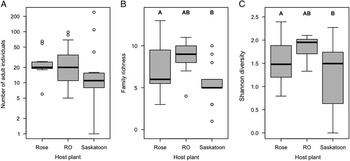
On average, insect abundance did not differ significantly among plant types (negative binomial GLM; null deviance=50.4, df=44; residual deviance=49.6, df=42; P>0.5) (Fig. 2A). Rarefaction curves indicated that increased sampling effort would have yielded new insect families (Fig. S3), but based on our equal sampling effort across plant types, family richness (ANOVA; F(2,42)=6.51, P=0.003) and Shannon diversity (unequal variances ANOVA; F(2,23.149)=6.33, P=0.006) differed significantly among plant types (Figs. 2B, 2C). Compared to Saskatoon, rose exhibited significantly higher richness (Tukey–Kramer least significant difference (LSD); α=0.05, P=0.002) and Shannon diversity (Games–Howell; t 16.55=3.07, P=0.018), while diversity measures associated with Russian olive differed from neither Rose nor Saskatoon (Figs. 2B, 2C).
(A) Total abundance of adult insects sampled on individual Rose, Russian olive (RO), and Saskatoon plants. (B) Insect family richness and (C) Shannon diversity with respect to plant type. In panels B and C, plant types sharing the same letter are not significantly different (P>0.05) with respect to the given diversity measure, according to the Tukey–Kramer LSD post-hoc test (B) or the Games–Howell post-hoc test (C). For all panels, n=15 plants surveyed per plant type.

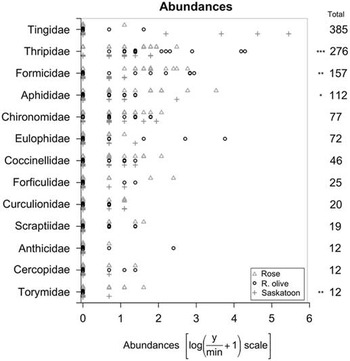
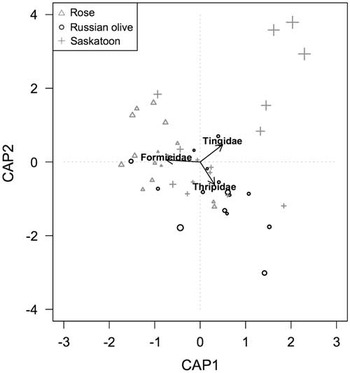
The multiGLM (Fig. 3) and CAP analyses (Fig. 4) revealed a significant effect of plant type on insect family abundances and composition, respectively (multiGLM; n=45 samples; residual deviance=103.1, df=42; P<0.001; CAP permutation test, P<0.001). The univariate follow-up tests to the multiGLM indicated that the following four families exhibited significant variation in abundance among plant types, and together accounted for 56% of the deviance explained by the multiGLM model: Thripidae (P=0.007), Formicidae (Hymenoptera) (P=0.027), Torymidae (Hymenoptera) (P=0.041), and Aphididae (Hemiptera) (P=0.061) (Fig. 3). Among Thysanoptera, Russian olive hosted the highest number of insects from the family Thripidae (Fig. 3; Table S2). Saskatoon hosted the highest number of Hemiptera, made up primarily of insects from the Tingidae (Hemiptera) (Fig. 3; Table S2), and rose hosted the second highest number of Hemiptera, composed primarily of Aphididae.
Total abundance of individuals within each of 13 insect families sampled on each of n=15 plants per plant type. Abundance was pooled across the six sites and three sampling periods. Numbers to the right denote total family abundance. The total abundance of four of the 13 families varied significantly among plant types (multiGLM analysis; see text for details; *P<0.10; **P<0.05; ***P<0.01).

Biplot of the CAP results. Each point denotes an individual plant (n=15 plants per species), and point size is scaled by the sample’s LCBD score (larger size denotes more distinct composition). The three Saskatoon observations in the upper right exhibited significant LCBD values, primarily owing to high abundances of Tingidae. The arrows show how each of the top three most influential insect families (based on the magnitudes of their species scores) relate to the positioning of plant species. The family Aphididae is not shown for clarity, as its arrow is largely coincident with that of the Formicidae. Point symbols are consistent across Figures 3–4. See text for details.

A biplot of the CAP results (Fig. 4) shows that sampled trees do separate reasonably well according to insect composition, reflecting the significance of the overall permutation test (above). The biplot also reflects the outcomes of the post-hoc, permutation-based comparisons among each possible pairing of plant types, which show that composition differed significantly between rose and Russian olive (P=0.005) and rose and Saskatoon (P=0.004), but not between Russian olive and Saskatoon (P=0.163). Based on both the family correlations with the CAP axes (not shown) and calculated SCBD values, the following four insect families exhibited the greatest contributions to compositional variation: Tingidae (SCBD=0.148), Formicidae (0.134), Thripidae (0.132), and Aphididae (0.130). It is important to recall that the multiGLM and CAP analyses focus on different aspects of community variation (abundances versus composition), hence the difference in the list of families identified as most important (e.g., Torymidae in the multiGLM analysis and Tingidae in the CAP analysis).
Representatives of the Tingidae were found in all three sampling periods, and all but seven of the 385 individuals were associated with Saskatoon (Table S2). It is conceivable that the majority of these individuals were the hawthorn lace bug, Corythucha cydoniae (Fitch), as this species is known to proliferate on Saskatoon. Members of the Formicidae were commonplace on rose and Russian olive through the summer (Table S2), but uncommon on Saskatoon; only 10 of the 157 adult individuals were associated with Saskatoon, and almost equal numbers were observed on the other two plant species. All three plant types hosted members of the Eulophidae (Hymenoptera), but Russian olive hosted the greatest abundance by far: a total of 62 adults compared with five on each of rose and Saskatoon (Table S2).
Discussion
We found significant differences among plant types with respect to insect family richness, Shannon diversity, and family composition, but not with respect to total abundance. The most pronounced differences were observed between the assemblages associated with Rose and Saskatoon, with Tingidae being extremely abundant on several Saskatoon plants, and Formicidae and Aphididae being more abundant on rose. The richness and Shannon diversity of assemblages associated with Russian olive did not differ from those of either rose or Saskatoon.
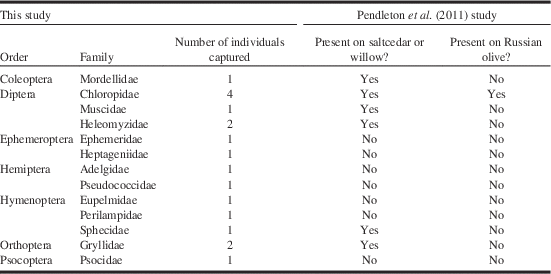
Despite its importance as an exotic invader of riparian ecosystems, only two other studies have examined insect fauna associated with Russian olive (Kennedy and Wilson Reference Kennedy and Wilson1969; Pendleton et al. Reference Pendleton, Pendleton and Finch2011). The vast majority of insect families that we found to be unique to Russian olive were not observed on Russian olive by Pendleton et al. (Reference Pendleton, Pendleton and Finch2011) (Table 2). Families that both studies found to be associated with Russian olive were also found by Pendleton et al. (Reference Pendleton, Pendleton and Finch2011) to be associated with willow and/or saltcedar (Table 2). This suggests that these families are unlikely to be specialists on Russian olive. More generally, and considered alongside the species accumulation curve we calculated for Russian olive (Fig. S3), these observations suggest that with more sampling effort additional insect families will be found to be associated with Russian olive within southern British Columbia.
Insect families unique to Russian olive in this study, compared to insect families found on Russian olive in the Pendleton et al. (Reference Pendleton, Pendleton and Finch2011) study.

Russian olive assemblages were notable for their abundance of Thysanoptera; the largest collection of Thysanoptera among all plant types and sampling times was made on Russian olive during flowering in May (Table S2), and was overwhelmingly dominated by individuals from the family Thripidae. Thysanoptera prefer flowers with narrow openings (Mound Reference Mound2005), like those presented by Russian olive. Thysanopteran larvae are known to develop in flowers (Sakai Reference Sakai2002) and are often described as pollen parasites. Depending on the size of the pollen grain, larvae and adults can consume more than 1500 grains per day (Kirk Reference Kirk1987; Mound Reference Mound2005). Their impressively high reproduction rate allows them to produce large numbers of offspring (Sakai Reference Sakai2002), and as such, the likelihood that individual thrips come in contact with and successfully deposit pollen is high (Mound Reference Mound2005). Given the enormous numbers of Thysanoptera observed on Russian olive during flowering, it is likely that these insects not only use the flowers as breeding sites, but potentially serve as pollinators for the exotic species.
The large number of Thysanoptera on Russian olive may explain why insects from the family Eulophidae were far more abundant on flowering Russian olive compared to the other plant types; the Eulophidae, subfamily Entedoninae, is known to parasitise Thysanoptera (Triapitsyn and Headrick Reference Triapitsyn and Headrick1995), although further taxonomic identification of the Eulophidae we captured would be needed to confirm this. Of the 72 Eulophidae individuals we caught, 62 were found on Russian olive, and all during the same early (June) sampling period in which the Thysanoptera were most common (Table S2).
Based on the available research, some insect taxa were expected on Russian olive, but were absent from our surveys. For example, previous studies have suggested that grasshoppers (Melanoplus (Orthoptera: Acrididae) species) (Dix et al. Reference Dix, Pasek, Harrell and Baxendale1986) and blister beetles (Meloidae (Coleoptera)) (Milliken Reference Milliken1921) feed on Russian olive leaves, and grasshoppers have been observed on Russian olive in the Okanagan Valley of British Columbia (B. Lalonde, personal communication 2014). We did not find grasshoppers on Russian olive. This may be an outcome of using the beat method, which is biased in favour of insects that respond to disturbance by dropping to the ground. Insects that respond to disturbance by flying or jumping away (e.g., grasshoppers) were less likely to be captured. With respect to herbivores in general, the high nitrogen and low carbon:nitrogen ratios of Russian olive leaves (Tibbets and Molles Reference Tibbets and Molles2005; Moline and Poff Reference Moline and Poff2008; Abelho and Molles Reference Abelho and Molles2009) ought to be attractive. Insect performance (e.g., growth and reproduction) and preference (Dixon Reference Dixon1970; Johnson et al. Reference Johnson, Williams and Ehrlich1987; Minkenberg and Ottenheim Reference Minkenberg and Ottenheim1990) has been found to increase with increasing host plant nitrogen. Owing to their high diversity (Jander and Howe Reference Jander and Howe2008), it would not be surprising to find arthropod herbivores that benefit from the high leaf nitrogen content of Russian olive. The taxonomic resolution used here precludes assignment of insects to functional guilds, including herbivores.
In contrast with their leaves, the fruits of Russian olive are poor in nitrogen and have a high carbon to nitrogen ratio. Nevertheless, the fruits, specifically the mesocarp, may be attractive to herbivores due to their high sugar content (Ayaz and Bertoft Reference Ayaz and Bertoft2001; Doležal et al. Reference Doležal, Velíšek and Famfulíková2001). Numerous adult Vesipdae (Hymenoptera), for example, were observed feeding on the mesocarp of Russian olive fruits near Kamloops, British Columbia (Collette and Pither Reference Collette and Pither2015). This behaviour could be attributable to these insects’ affinity for carbohydrates (Spadbery Reference Spadbery1973).
Despite the strong, fragrant smell emitted by Russian olive flowers (Katz and Shafroth Reference Katz and Shafroth2003; Farkas and Zajácz Reference Farkas and Zajácz2007), bees were absent from our surveys of Russian olive, and from those of Pendleton et al. (Reference Pendleton, Pendleton and Finch2011). Nor have we ever witnessed bees on Russian olive flowers during field work. Several bee taxa are attracted to methyl cinnamate volatiles (Williams and Whitten Reference Williams and Whitten1983; Odell et al. Reference Odell, Raguso and Jones1999), which have been found to be the most abundant volatile (> 50%) in the odour of Russian olive flowers (Xin-yao et al. Reference Xin-yao, Hui, Xiao-ming and Yi-ning2009). In Russian olive’s native range, nectar flow is described as excellent and honeybees (Apis mellifera Linnaeus; Hymenoptera: Apidae) frequently visit Russian olive flowers throughout the day. However, the sugar content of the nectar itself is quite low and is most likely used for brood rearing (Farkas and Zajácz Reference Farkas and Zajácz2007). In the United States of America, Russian olive has been promoted for the production of honey (Hayes Reference Hayes1976). In light of our observations, it appears that bee visitation of Russian olive may be region specific.
Conclusion
Our study is the first to have conducted standardised sampling of insects associated with exotic Russian olive plants and co-occurring native vegetation. Our data and findings provide a strong foundation for future research. For example, it would be beneficial to repeat our comparative study (i.e., assemblages on Russian olive versus native, co-occurring plants) along a time-since-introduction gradient, including control sites where Russian olive has yet to invade. Applying higher resolution taxonomy would also be valuable, as this would (i) facilitate ascribing insects to guilds, (ii) help distinguish incidental captures from those representing individuals that actually use Russian olive as a resource, and (iii) shed light on the functional implications that Russian olive has for riparian ecosystems.
Acknowledgements
The authors are grateful for the guidance and feedback provided by participants of the Russian olive symposium at the 2014 Northern Rockies Invasive Plant Council meeting. Thanks to Val Miller (B.C. Ministry of Forests, Lands, and Natural Resources Operations) and Rose De Clerck-Floate (Agriculture and Agri-Food Canada) for encouraging this research on Russian olive in Canada. Along with Bob Lalonde (UBC, Okanagan campus), they provided valuable feedback. Emma Walker assisted with field surveys. Financial support was provided by a Natural Sciences and Engineering Council of Canada Discovery Grant to J.P. and by the University of British Columbia to L.K.D.C. Comments from two anonymous referees and the associate editor were extremely constructive.
Supplementary Material
To view supplementary material for this article, please visit http://dx.doi.org/10.4039/tce.2015.63