1. Introduction
In the Nubian Shield (NS) that extends from the eastern side of the River Nile toward the Arabian Peninsula and southward to the Mozambique Belt (Vail, Reference Vail1988), most of the essential gold deposits are of orogenic type which commonly exist in the Egyptian basement rocks in the form of auriferous quartz-carbonate veins and/or lenses as well as related alteration zones. The orogenic gold deposits are the most economic world-class deposits that contain high anomalies of gold concentrations. They are always linked with stages of deformational–metamorphic events during orogeny (e.g. Kerrich & Cassidy, Reference Kerrich and Cassidy1994; Oberthur, Reference Oberthur1994; Goldfarb et al. Reference Goldfarb, Groves and Gardoll2001; Groves et al. Reference Groves, Goldfarb, Robert and Hart2003).
During the fractional crystallization processes of melt, gold and base metals are commonly incorporated either within pyroxenes and amphiboles or in association with other sulphide minerals (Mustard et al. Reference Mustard, Ulrich, Kamenetsky and Mernagh2006). They have been proposed to be leached from mafic and/or ultramafic rocks during metamorphic processes (Fyfe & Henley, Reference Fyfe and Henley1973; Almond et al. Reference Almond, Ahmed and Shaddad1984; Lee & Tredoux, Reference Lee and Tredoux1986). In Egypt, the gold is deposited and concentrated by regional metamorphism under greenschist–amphibolite facies (Dardir & Greiling, Reference Dardir and Greiling1987; Greiling et al. Reference Greiling, Abdeen, Dardir, El Akhal, El Ramly, El Din Kamal, Osman, Rashwan, Rice and Sadek1994; Greiling & Rashwan, Reference Greiling and Rashwan1994; Botros, Reference Botros1995, Reference Botros2002, Reference Botros2004; Loizenbauer & Neumayr, Reference Loizenbauer and Neumayr1996; Helmy et al. Reference Helmy, Kaindl, Fritz and Loizenbauer2004; Abdelnasser & Kumral, Reference Abdelnasser and Kumral2016, Reference Abdelnasser and Kumral2017; Abu-Alam et al. Reference Abu-Alam, El Monsef, Grosch, Ferrero, Lanari, Goncalves and Grosch2019). Moreover, the gold-bearing quartz veins mostly occur within or close to granitic intrusions that are surrounded by metavolcanic–sedimentary assemblage, ophiolite and associated rocks (serpentinite, talc carbonate and listwenite). Therefore, there is probably a genetic link between gold mineralization and intrusion of syn- to late-orogenic granitic bodies (Amin, Reference Amin1955; El-Gaby et al. Reference El-Gaby, List, Tehrani, El-Gaby and Greiling1988; Hussein & El Sharkawi, Reference Hussein, El Sharkawi and Said1990; H Harraz, unpub. PhD thesis, Tanta Univ, 1991; AbdelTawab, 1992; Surour et al. Reference Surour, Attawiya, Hussein and El-Feky1999, Reference Surour, El-Bayoumi, Attawiya and El-Feky2001; Botros, Reference Botros2004). However, Klemm et al. (Reference Klemm, Klemm and Murr2001) suggested that the post-orogenic intrusions just provided the heat sources that resulted in driving of hydrothermal convection cells, where interstitial waters dissolved the available mineral species. The possible mixing between metamorphic–magmatic fluids during gold remobilization, transportation, and circulation of hydrothermal water has been discussed by many authors (e.g. Kerrich & Cassidy, Reference Kerrich and Cassidy1994; Hassaan & El Mezayen, Reference Hassaan and El Mezayen1995; Harraz, Reference Harraz2000; Goldfarb et al. Reference Goldfarb, Groves and Gardoll2001; Klemm et al. Reference Klemm, Klemm and Murr2001; Botros, Reference Botros2004; Abd El Monsef et al. Reference Abd El Monsef, Slobodník and Salem2018).
During crystallization of the host minerals, the trapped fluid inclusions (FIs) are good indicators for the physicochemical properties of source fluid, from which the mineralization has been released (Roedder, Reference Roedder1984). FIs are highly resistant and locally preserved in minerals (e.g. quartz, calcite, fluorite). Therefore, they can preserve a reliable record for characterization of the mineralizing fluid in terms of its temperature, pressure, composition, salinity and density at the time of the fluid inclusion’s formation. Moreover, the microthermometric measurements defined from the temperature measurements of the phase changes could contribute to accurate estimation of the composition and properties of the fluid. On the other hand, by determination of the fluid compositions and properties (i.e. salinity and density), the source and nature of the mineralized solution could be delineated (Roedder, Reference Roedder1984).
Haimur gold deposit (Figs 1, 2) (south Eastern Desert of Egypt) resembles a representative model for the vein-style gold deposits in Egypt (e.g. Sukari (Johnson et al. Reference Johnson, Zoheir, Ghebreab, Stern, Barrie and Hamer2017), Hamash (Johnson et al. Reference Johnson, Zoheir, Ghebreab, Stern, Barrie and Hamer2017), Fawakhir (Zoheir et al. Reference Zoheir, Creaser and Lehmann2015)). It hosts economic concentrations of Au and other sulphide minerals (the gold contents lie between 1 and 70 g t−1 based on the analyses of the Australian Gippsland Company (2005) (Klemm & Klemm, Reference Klemm and Klemm2012)). The purpose of this paper is to estimate the pressure–temperature (P–T) conditions that prevailed during gold deposition in the Haimur gold mine. Also, the nature and characteristics of gold-bearing fluids as well as the role of deformation and metamorphic processes during ore formation will contribute a strong linkage between the physicochemical conditions and the tectonic setting of the Haimur gold deposition. Detailed study of this kind of mineralization will help in better understanding the genetic factors leading to the potential concentration of the economic deposits (especially gold) in the specific area under investigation as well as in similar deposits in Egypt and/or worldwide. The current study may open a horizon toward further exploration and metal extraction in the area based upon reliable geologic information and data interpretation.
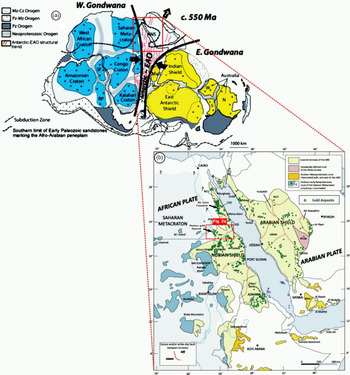
(a) Gondwana reconstruction for the Cambrian after Meert & Lieberman (Reference Meert and Lieberman2008) in which the Neoproterozoic Arabian–Nubian Shield (ANS) represents the northern part of the East African Orogen (EAO). (b) Gold occurrences in ANS, compiled from G Kochine & F Bassyuni (unpub. report, 1968) with distribution of the Archaean–Paleoproterozoic and Neoproterozoic rocks in the different terranes.

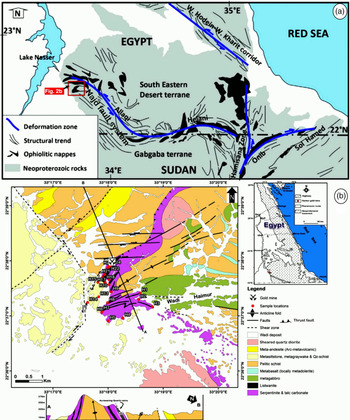
(a) Major deformation phases and structural trends in the south Eastern Desert and Northern Sudan. (b) Haimur geologic map modified after Klemm & Klemm (Reference Klemm and Klemm2012) and Zoheir & Emam (Reference Zoheir and Emam2014).

2. Nubian Shield (NS): regional geology and historical mining activities
The Arabian Nubian Shield (ANS) is part of the Pan-African orogenic belt (900–540 Ma; Kröner & Stern, Reference Kröner, Stern, Selley, Cocks and Plimer2004) which represents the northern extension of the East African Orogen (EAO) covering a large area (106 km2) that continued to the south of the Mozambique Belt (Fig. 1a). It was developed during the Neoproterozoic period (Kröner, Reference Kröner1979) by a complex accretion of terranes into existing pre-Pan African rocks. The ANS is flanked to the west by a broad tract of older crust “Nile Craton or East Sahara Craton” that was remobilized along with a significant amount of juvenile Neoproterozoic crust during the Neoproterozoic time (Bertrand & Caby, Reference Bertrand and Caby1978; Stern, Reference Stern1994; Kröner & Stern, Reference Kröner, Stern, Selley, Cocks and Plimer2004) with continuous oblique convergence between East and West Gondwana lands (Stern, Reference Stern1994) (Fig. 1a, b). The arc terranes collided as the Mozambique Ocean closed during the Pan-African Orogeny between 650 and 600 Ma (Meert, Reference Burke, Sengör, Barazangi and Brown2003). Therefore, the ANS comprises the ophiolite, intra-oceanic island arc, fore- and back-arc assemblages that resemble preserved remnants of the ancient Mozambique Ocean (Burke & Sengör, Reference Bertrand and Caby1986). With the Red Sea opening during Oligo-Miocene times (23 Ma?), the ANS separated into the Arabian Shield (AS) in the west including southern Palestine through western Arabia, and the Nubian Shield (NS) which is a juvenile (mantle-derived) crust in the east consisting of eastern Egypt, northeastern Sudan, Eritrea and Ethiopia (El-Gaby & Greiling, Reference El-Gaby and Greiling1988; Hargrove et al. Reference Hargrove, Stern, Kimura, Manton and Johnson2006; Liégeois & Stern, Reference Liégeois and Stern2010; Johnson et al. Reference Johnson, Andresen, Collins, Fowler, Fritz, Ghebreab, Kusky and Stern2011) (Fig. 1b). During the squeezing of the ANS between East and West Gondwana, post-accretionary structures, shear zones and fault systems were produced as: (1) N-trending shortening zones, such as the Hamisana shear zone (Fig. 2a), (2) NW-trending strike-slip faults, such as the Najd fault system (Fig. 2a) (Burke & Sengör, Reference Bertrand and Caby1986; Berhe, Reference Berhe1990; Abdelsalam, Reference Abdelsalam1994; Stern, Reference Stern1994; Abdelsalam & Stern, Reference Abdelsalam and Stern1996; Abdelsalam et al. Reference Abdelsalam, Abdeen, Dowaidar, Stern and Abdelghaffar2003) and (3) subordinate NE–SW-trending zones, such as the Qena–Safaga and Nugrus megashears (Stern et al. Reference Stern, Kröner, Manton, Reischmann, Mansour and Hussein1989; de Wall et al. Reference de Wall, Greiling and Sadek2001).
The ANS was previously known as the site of the earliest geologic efforts for gold extraction (Fig. 1b). Records exist of mining activities during Pharaonic, Predynastic (3500 BC), Old Kingdom (2700–2180 BC), Middle Kingdom (2130–1994 BC), New Kingdom (1550–1070 BC), Greek–Ptolemaic–Roman–Byzantine (332 BC–500 Anno Domini “AD”) and Islamic times (642 AD) and continued at different periods in the fifth ccentury (Klemm et al. Reference Klemm, Klemm and Murr2001). The world’s earliest surviving geological map was drawn showing the gold-working settlement at Bir Umm Fawakhir in 1150 BC with the topography and geology of the Wadi Hammamat area in the central Eastern Desert of Egypt (Fig. 1b) (Harrell & Brown, Reference Harrell and Brown1992). This map was discovered as papyrus around 1820 and is known as the Turin papyrus. From the nineteenth to the middle of the twentieth century (1958) most of the gold deposits in Egypt were rediscovered and reworked. Many mines were reopened and exploited for gold extraction by British workers (i.e. El Fawakhir, El Sid, Um El Rus, Hamash gold, Sukari, Um Ud, Hangalia, Um Rus and Barramiya mines). Recent times have seen a new stage of gold mining in Egypt being carried out at many gold mines by several international companies that are seeking to extract gold in the Eastern Desert of Egypt.
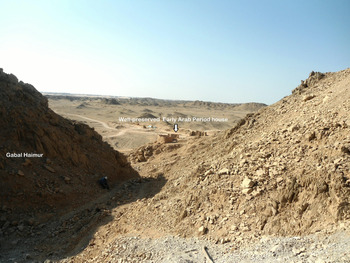
The Wadi Allaqi region is considered to be one of the largest sources of various metals other than gold, such as copper and copper–nickel sulphide deposits (Abu Swayel), chromite (Um Shilman, Dineibit El-Quleib, Haimur and Muksim), uranium (Um Ara), talc (Marahiq, Haimur, Um Shilman and Gabal El Hammary), barite (El-Hudi) and graphite (Haimur). Um Garayat and Haimur are well-known historical mines. In Haimur, ancient mining can be traced back to the New Kingdom (1550–1070 BC) (Klemm et al. Reference Klemm, Klemm and Murr2001). During this period, a new technique for gold production were applied, represented by a flat and oval-shaped grinding machine, 30–50 cm wide and 80 cm long (Roubet, Reference Roubet1989). Some of these millstones are still located in situ close to the tailing site and partial, very ill-preserved, multi-chambered New Kingdom houses (Klemm et al. Reference Klemm, Klemm and Murr2001). Mining restarted during EarlyArab times in which gold production was dependent on the wadi working (Klemm et al. Reference Klemm, Klemm and Murr2001) (Fig. 3).
Well-preserved Early Arab Period house at the foot of Gabal Haimur.

3. Geological and structural settings
The Haimur gold mine (22° 38′ N, 33° 18′ E) represents the central part of the Wadi Allaqi region in the south Eastern Desert of Egypt near Nasser Lake and the Nile valley (Figs. 1b, 2a). It is located at the extreme western side of the Allaqi–Heiani Belt which represents the western part of the main Allaqi–Heiani–Onib – Sol Hamed deformation zone (Fig. 2a). The Allaqi shear zone (Allaqi SZ) has remarkably different directions; NNW–SSE, NW–SE, and E–W perpendicular to the main wadi trend of the western side and aligned to the southern flank of the eastern part, where it is apparently cut by the N–S (to NNE–SSW)-trending Hamisana shear zone (Greiling et al. Reference Greiling, Abdeen, Dardir, El Akhal, El Ramly, El Din Kamal, Osman, Rashwan, Rice and Sadek1994; Abdelsalam & Stern, Reference Abdelsalam and Stern1996) (Fig. 2a). Most of the mineralized veins within the Allaqi–Heiani belt are related to NW- or NNW-trending shear zones (Kusky & Ramadan, Reference Kusky and Ramadan2002; Abdelsalam et al. Reference Abdelsalam, Abdeen, Dowaidar, Stern and Abdelghaffar2003; Zoheir, Reference Zoheir2008).
The Haimur area is made up of ophiolitic and island arc rocks (Fig. 2b). The ophiolite assemblage comprises serpentinite and talc carbonate, listwenite, metagabbro/amphibolite and metabasalt, having a tholeiitic nature with transitional mid-ocean ridge basalts (MORB) and island-arc tholeiitic (IAT) characters developed in a back-arc regime rather than mid-ocean ridge environment (El-Nisr et al. Reference El-Nisr, Moghazi and El-Sayed1996). The listwenite rock is the alteration product of serpentinized peridotite by the development of carbonation and/or silicification in association with hydrothermal activity (Azer, Reference Azer2013; Emam & Zoheir, Reference Emam and Zoheir2013), while the island-arc rocks are represented by metasediments and metavolcanics. The metasediments comprise pelitic metasediments (mica schist), meta-siltstone, meta-graywacke, and quartz–feldspathic schist having calc-alkaline affinity (El-Mezayen et al. Reference El-Mezayen, Ammar, Abd El Wahed and Wasfi1999). On the other hand, the metavolcanics are of andesitic composition, originating from more fractionated calc-alkaline magmas with tholeiitic tendencies, and their development was within the early immature stage of an island arc tectonic setting (El-Afandy, Reference El-Afandy1996; A Emam, unpub. PhD thesis, South Valley Univ., Aswan, 2005). The gold lode is clearly associated with listwenite rock in the central part of the mapped area along with the elongated belt of serpentinite and associated talc-carbonate rocks (Fig. 2b). The serpentinites and their associated talc-carbonate rocks are NE-elongate dismembered allochthonous slices along the Haimur shear zone (HSZ) and were thrusted over and mixed within the island-arc rocks (Fig. 2b). The serpentinites are characterized by mesh texture and composed of antigorite, lizardite and chromite with talc and carbonates. They are highly deformed and altered to talc-carbonate rocks along the HSZ.
The Haimur area belongs to the western Allaqi–Heiani suture that was explained, along with the Abu Swayel area (located to the east of the Haimur area), to be a gneissic belt with ophiolites and granitoids (Abd El-Naby et al. Reference Abd El-Naby, Frisch and Hegner2000). The gneissic rocks which have a metasedimentary origin and the ophiolites were supposedly formed in a back-arc basin prior to being metamorphosed at c. 600 Ma (Abd El-Naby et al. Reference Abd El-Naby, Frisch and Hegner2000). The age of metamorphism was also reported by Finger & Helmy (Reference Finger and Helmy1998) as 620–650 Ma using Th–U–Pb systematics. In addition, the ages of 570–550 Ma which were obtained from K/Ar of hornblende from the amphibolites and metagabbros represent the thermal events during late orogenic granite magmatism (Abd El-Naby et al. Reference Abd El-Naby, Frisch and Hegner2000).
The Neoproterozoic deformation in the western side of Wadi Allaqi (including the Haimur area) has been the subject of many studies (e.g. Greiling et al. Reference Greiling, Abdeen, Dardir, El Akhal, El Ramly, El Din Kamal, Osman, Rashwan, Rice and Sadek1994; YAHA El Kazzaz, unpub. PhD thesis, Univ. Luton, 1995; Abdelsalam & Stern Reference Abdelsalam and Stern1996; Smith et al. Reference Smith, O’Conner and Nasr1998; Kusky & Ramadan Reference Kusky and Ramadan2002). El Kazzaz (unpub. PhD thesis, Univ. Luton, 1995) determined five phases of deformation in the Wadi Allaqi district (D1 to D5), where D1 and D2 deformations represent the main tectonic phases and D3 to D5 are the late-deformation phases. The D1 deformation phase is distinguished by conspicuous NW–SE-oriented shear zones with penetrative foliation and approximately NE-plunging lineation, while D2 is related to subsequent deformation and generally characterized by major E–W shear trends. D3 is recognized by NE–SW-trending, brittle–ductile folding including kink-bands, whereas D4 is represented by minor structures and conjugate fractures generally trending NW–SE. The D5 phase includes a set of NNE–SSW-trending left-lateral strike-slip faults which displace the earlier E–W-trending right-lateral strike-slip faults. This study supposed that the earlier ductile events (D1 and D2) were followed by more brittle events (D3, D4 and D5). On the other hand, Kusky & Ramadan (Reference Kusky and Ramadan2002) determined four phases of Neoproterozoic deformation (D1, D2, D3 and D4) that developed in the western part of the Allaqi suture. These deformation events have a temporal relationship with the collision of East and West Gondwana between 750 and 650 Ma, in which D1 and D2 are related to the earlier collisional stages between the Gerf Terrane (to the north) and the Haya and Gabgaba Terranes (to the south). D1 represents the development of an E–W-striking, steeply N-dipping axial planar cleavage (S1) associated with E-plunging tight to isoclinal folds (Kusky & Ramadan, Reference Kusky and Ramadan2002). Along Wadi Haimur, D2 is represented by thrust-related shear zones formed during the emplacement of mafic–ultramafic rocks of the ophiolitic assemblages over the island arc volcano-sedimentary associations (Fig. 2b). D2 folds which deform the thrust surfaces are E–W oriented with W-plunging hinges and steeply N-dipping axial planar cleavage (Fig. 2b). However, D3 and D4 are associated with the late- to post-collisional stages (Abdelsalam & Stern, Reference Abdelsalam and Stern1996) or Najd-related deformation between 640 and 550 Ma (Abdeen & Abdelghaffar, Reference Abdeen and Abdelghaffar2011). D3 is represented by WNW–ESE and NW–SE shear zones varying in width from a few metres to as much as 3 km, with sharp to gradational boundaries and wrapping around lenses of less deformed rock (Fig. 2b) (Kusky & Ramadan, Reference Kusky and Ramadan2002). Moreover, minor E–W-trending strike-slip faults associated with some intrusions of dyke swarms were formed during D4 (Fig. 2a, b).
The Haimur area represents metamorphic sole in the southern part of the Egyptian Eastern Desert, in which the metamorphism is associated with arc/arc collision and deformation as well as alteration and mineralization (Abd El-Naby et al. Reference Abd El-Naby, Frisch and Hegner2000; Kusky & Ramadan, Reference Kusky and Ramadan2002). This area is affected by two metamorphic events (M1 and M2) which depict two different phases of deformation. M1 is confined to the Haimur metamorphic sole rocks in which the temperature ranges from 450 to 700 °C and pressure is from 5 to 8.5 kbar (Abd El-Naby et al. Reference Abd El-Naby, Frisch and Hegner2000). This event has been developed due to a regional metamorphism during the emplacement of the ophiolitic nappes and island arc assemblages (i.e. during D1–D2 of Kusky & Ramadan Reference Kusky and Ramadan2002). M2 is distinguished by temperatures ranging from 495 to 550 °C for the metamorphic peak and from 260 to 300 °C for the retrograde stage, while pressures range from 3.4 to 6.5 kbar (Abd El-Naby & Frisch, Reference Abd El-Naby and Frisch2002). It is also represented by rock assemblages metamorphosed up to the amphibolite facies at ∼600 Ma and defining the latest stages of N–S collision in the Allaqi zone or the onset of the left-lateral deformation (Najd-related). Abd El-Naby et al. (Reference Abd El-Naby, Frisch and Hegner2000) stated that the metamorphic profile of the area is an inverse one from upper amphibolite facies developed near the thrust plane to medium-pressure greenschist conditions in distant positions.
4. Analytical techniques
Field work was carried out in order to collect representative samples from the auriferous quartz / quartz-carbonate veins and lenses in the Haimur deposit. Thin-polished sections were prepared and examined under a reflected/transmitted research microscope with attached Canon digital camera at the Petrographic Lab at Tanta University, Egypt. A subset of mineralized samples was further investigated by X-ray spectrometry using a CAMECA SX-100 four spectrometer with electron microprobe analyser (EMPA) at the Institute of Geological Sciences, Masaryk University, Czech Republic. The mineral chemistry analyses were applied in order to ascertain the identity of some minerals and for fully quantitative mineral formulae for arsenopyrite grains. The applied operating conditions were: 25 keV accelerating potential and 20 nA for beam current. The beam size was 2 µm. Pure minerals (i.e. quartz and calcite) standards were used for calibration during analyses.
Fluid-inclusions microthermometry was performed at the laboratory of fluid inclusions of Masaryk University, Czech Republic, using heating/freezing stage Linkam THMSG600 for temperatures +600 to −196 °C, equipped with Nikon Eclipse 80i with objectives. The stage is attached by Pixelink digital camera for microphotographs. During heating, temperature rates of 5 °C min−1 were applied to observe phase changes below 60 °C (lower rate of 1 °C min−1 was adjusted near the expected temperatures) including homogenization temperature of CO2 (T h CO2), eutectic temperature (T eu), first melting of CO2 (T m CO2), final ice melting temperature (T m ice) and melting temperature for clathrate (T m clath), whereas a heating rate of 10 °C min−1 was applied for phases’ changes at temperature above 60 °C such as total homogenization temperature (T h total) and decrepitation temperature (T d). Fluid compositions, properties, molar volumes and isochore construction were obtained using the FLUIDS software package (Bakker, Reference Bakker2003) with the aid of online specific programs by Zhenhao Duan Research Group.
5. Gold mineralization
5.a. Ore geology
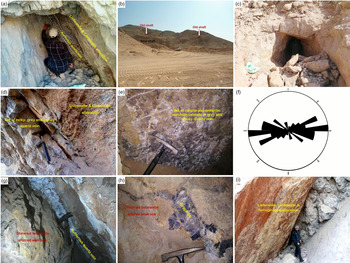
Haimur lode occurs within a highly tectonized–metamorphic association of schist and mylonitized serpentinite as well as associated listwenite rocks (Figs. 2b, 4a). Field and geological observations suggest that there are two main quartz veins observed following the shear foliation planes which had been mined from five shafts at two underground levels in antiquity on the western slope of Gebel Haimur (Figs 2b, 4b, c). The ore body is represented by a set of smoky/white gold-sulphide-bearing quartz / quartz-carbonate veins and lenses that cut across the hosting sheared and silicified–mylonitized listwenite rocks (Fig. 4d). Calcite and ankeritic dolomite occurred within these quartz veins (Fig. 4e). The mineralized quartz / quartz-carbonate veins strike in NE–SW trends dipping in the NW direction (dip angles = 35–50°) (Fig. 4f, g). They vary in thickness from a few centimetres to more than 1 m. Discontinuous quartz veins/lenses can be traced for more than 25 m along strike (Fig. 4d). The other one is the biggest vein striking in the NW–SE direction (Fig. 4f). Thin films of graphite occurred along the borders of wallrock with quartz veins within the shear zone (Fig. 4h). The graphite precipitation is interpreted as being due to the heterogeneous reaction between CO2 and CH4. Listwenitization, silicified and ferruginated alteration zones are observed around these auriferous veins and/or lenses in the ore zones which are still marked by traces of ancient mining activities with several adits, shafts and surface exposures (Fig. 4i).
(a) Haimur auriferous quartz veins within listwenite and carbonate zone. (b, c) Old and new shafts in the mining area on the western slope of Gebel Haimur. (d) Sets of white/smoky gold-bearing quartz(-carbonate) veins hosted in listwenite and carbonate zone. (e) Calcite and ankeritic dolomite occurred within these quartz veins. (f) Rose diagram showing for two main types of quartz veins. (g) NE–SW-trending auriferous quartz veins in sheared listwenite altered wallrock. (h) Graphite coatings along the borders of wallrock with quartz veins within the shear zone. (i) Listwenitization, silicified and ferruginated alteration zones occurred around these veins.

5.b. Ore mineralogy and paragenesis
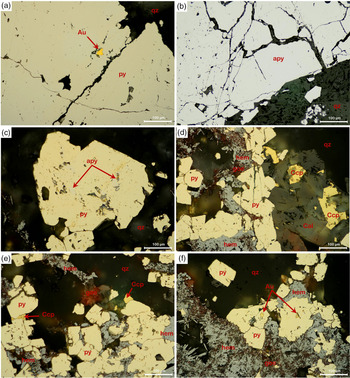
Twenty-four selected samples from the NE-trending mineralized quartz(-carbonate) veins and lenses were examined under a microscope for petrographic studies. The ore microscopic investigation revealed that the gold mineralization in the Haimur mine area is associated with sulphide minerals including arsenopyrite, early- and late-pyrite, chalcopyrite and subordinate hematite and goethite. Gold occurs as small irregular disseminated grains within late-pyrite crystals (Fig. 5a). Arsenopyrite is the most abundant sulphide mineral in the ore bodies, found in two forms: (a) large euhedral crystals (commonly rhombic) disseminated in the host silicate alteration (Fig. 5b) in association with early-pyrite and chalcopyrite, and (b) small subhedral–anhedral aggregates enveloped within large pyrite crystals reflecting that the arsenopyrite was formed earlier than the pyrite (Fig. 5c). Pyrite represents the second mineral in abundance and distribution relative to arsenopyrite; it occurs as idiomorphic to hypidiomorphic crystals (up to 300 μm). Occasionally, large pyrite crystals include relics of arsenopyrite and chalcopyrite (Fig. 5c), indicating that the pyrite was formed in the final stage of the sulphidation process at relatively lower temperature. Chalcopyrite is observed as small aggregates at the grain boundaries of arsenopyrite or along interstitial and partially healed fractures showing distinct brass-yellow colour and commonly associated with pyrite (Fig. 5d, e). Hematite is associated with the latest stage of hydrothermal activity and occurs as specular stringers and large clusters partially replacing pyrite at lower temperature (Fig. 5d–f). Goethite commonly forms a pseudomorph after pyrite (Fig. 5d–f). On the other hand, the ore minerals are hosted by other gangue minerals that are mainly represented by quartz and calcite with subordinate amounts of ankerite, plagioclase and rarely muscovite. Quartz is found as euhedral to subhedral grains with markable cracking and suture boundaries; occasionally it shows wavy or undulose extinction. Carbonate is detected as anhedral crystals and/or small veinlets cutting through quartz crystals. Plagioclase and muscovite are observed as small aggregates filling the interstitial spaces between other gangue minerals.
Photomicrographs of reflected light microscopy. (a) Inclusion of gold (Au) in the late-pyrite (py). (b) Arsenopyrite (apy) occurred in the altered rocks. (c) Small subhedral–anhedral aggregate of arsenopyrite (apy) enveloped within large pyrite crystals. (d, e) Chalcopyrite (ccp) associated with late-pyrite (py) with specular hematite (hem) in quartz (qz) and calcite (cal) alteration. (f) Late-pyrite (py) has inclusions of gold (Au) and is associated with specular hematite (hem).

Based on the textural and intergrowth relationships between the different ore-minerals in quartz and quartz-carbonate ore bodies, three paragenetic phases of mineralization could be distinguished as follows: (a) first phase (sulphide phase) is characterized by the formation of early-pyrite, arsenopyrite with minor chalcopyrite; (b) second phase (gold phase) in which gold was formed with late pyrite with some deposition of chalcopyrite filling the interstitial spaces within quartz and calcite grains; (c) third phase (latest phase) has hematite and goethite that have been formed as secondary minerals partially replacing pyrite (Fig. 6).
Paragenetic sequence of quartz, carbonate and listwenite with sulphide minerals and supergene minerals as defined by mineral assemblages.

6. Arsenopyrite geothermometry
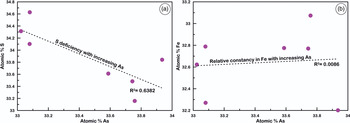
An attempt was made to estimate temperature and sulphur activities of components during ore formation through the application of Kretschmar & Scott’s (Reference Kretschmar and Scott1976) arsenopyrite geothermometer. During the equilibration of arsenopyrite, the liberated arsenic (As) may do one of the following: (1) react with the FeS in sphalerite or pyrrhotite to form metamorphic arsenopyrite; (2) change the existing arsenopyrite compositions depending on P–T conditions; or (3) mobilize out of the local system (Lentz, Reference Lentz1999, Reference Lentz2002).In the Haimur area, well-defined and free-standing arsenopyrite crystals from the auriferous quartz / quartz-carbonate ore bodies have been subjected to EMPA that were easy to analyse (Table 1). EMPA data reveals that these arsenopyrite minerals are homogeneous (lack zoning), S-rich without detectable Co, Ni, Cu or Au (see Table 1). Moreover, it exhibits great similarity between arsenopyrite grains hosted in quartz and those within quartz(-carbonate) ore bodies, revealing the same phase and conditions of mineralization. The mineral chemistry analyses show that the As contents increase slightly with the sulphur deficiency but with relative Fe constancy (Fig. 7a, b) indicating that the arsenopyrite is not Fe-deficient, similar to the sulphides from many mesozonal lode-gold deposits all over the world (Zachariáš et al. Reference Zachariáš, Frýda, Paterová and Mihaljevič2004). Moreover, arsenopyrite does not equilibrate on rapid cooling, so its chemical composition is usually still preserved in hydrothermal deposits that could reflect the temperature of formation (Choi & Youm, Reference Choi and Youm2000). Arsenopyrite is found in chemical equilibrium with mineral assemblages that can buffer chemical potentials which control sulphur and oxygen fugacity (Barton, Reference Barton1969; Kretschmar & Scott, Reference Kretschmar and Scott1976; Scott, Reference Scott1983; Sharp et al. Reference Sharp, Essene and Kelly1985). In the Fe–As–S system, the values of sulphur fugacity (ƒS2) and temperature are determined from the phase relationships and the compositions of the different sulphide minerals (Fig. 8) (Kretschmar & Scott, Reference Kretschmar and Scott1976). Using this geothermometer, the arsenopyrite is found to have arsenic content ranging from 33.02 to 33.94 at. % that deposited with pyrite in the phase position of arsenopyrite (asp) + pyrite (py) + L (sulphur–arsenic liquid) under an approximate temperature of 405–512 °C, with an average temperature of c. 476 °C, and has logarithmic values for sulphur fugacity (log ƒS2 values) of −5.5 to −4.5 (Fig. 8).
Representative electron microprobe data of arsenopyrite from different mineralized zones in the Haimur deposit

Correlation between As (atom. %) and other elements: (a) S (atom. %) and (b) Fe (atom. %) in arsenopyrite from the Haimur deposits.

Log f S2–T projection of the stability of arsenopyrite contoured in atom % of As (Kretschmar & Scott, Reference Kretschmar and Scott1976). The arsenopyrite stability field after Barton (Reference Barton1969) and arsenopyrite buffered curves from Kretschmar and Scott (Reference Kretschmar and Scott1976), pyrite–pyrrhotite lines after Scott & Barnes (Reference Scott and Barnes1971), sulphurliquid (SL) – Sulphurvapor (SV) after Braune & Peter (Reference Braune and Peter1951), and Fe–FeS after Robie & Waldbaum (Reference Robie and Waldbaum1968).

7. Fluid inclusions study
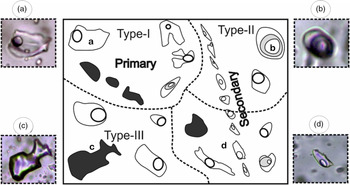
The ore-bearing fluid has been carried and preserved within the quartz crystals which are considered relatively hard, to keep a reliable record for the parent mineralizing fluid. As previously described in Section 5.b, there is no evidence for multi-phase generation of quartz during mineralization stages. This means that the trapped fluid inclusions within the hosting quartz minerals can act as good indicators for the physico-chemical properties of the mother fluids (Roedder, Reference Roedder1984). Based on the petrographic criteria of the FIs at room temperature (around 25 °C) within the hosting quartz grains, several types of FIs could be classified as follows: aqueous (type-I), mixed aqueous–carbonic (type-II) and hydrocarbonic (type-III) (Fig. 9). Fluid properties (salinity and density) were calculated using the ICE and BULK fluid inclusions program, version 01/03 of Bakker (Reference Bakker2003). Composition, characteristics, temperature ranges and fluid properties for all types of FIs are summarized in Table 2.
Distribution, abundance and mode of occurrences for the different FI types in the studied auriferous quartz vein in the Haimur deposits.

Microthermometric data of quartz-hosted fluid inclusions from the Haimur deposit

n refers to number of measured fluid inclusions.
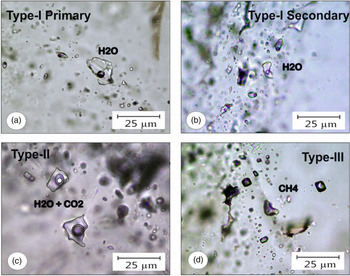
Type-I FIs represent 70 % of the total FIs found as two separated phases (liquid H2O + vapour) at room temperature. They are subdivided into primary and secondary FIs based on their genesis. The petrographic studies revealed that most FIs are of liquid-rich inclusion type having a vapour fill (F) (degree of filling = ratio of liquid volume vs gas volume in the cavity, F = V L/(V L + V V)) in the range F = 0.75–0.9 vol. % liquid and showing variable shapes (elongated, elliptical and irregular). The size of inclusions is usually 9–24 μm in the form of clusters or isolated inclusions, suggesting a primary origin (Fig. 10a). The eutectic temperatures were determined around −21.9 °C; these values correspond to the system of H2O–NaCl (Shepherd et al. Reference Shepherd, Rankin and Alderton1985). The primary FIs show final ice melting temperatures (T m ice) between −2.1 and −0.7 °C, and based on the equation of state of Bodnar (Reference Bodnar1993), their salinities range from 1.2 to 3.54 wt % NaCl equivalent with a mean of 1.9 wt % NaCl equivalent. The final homogenization temperatures (T h total) range between 224 and 366 °C (an average of 297 °C) (Fig. 11). Without exception, the homogenization for all FIs was taken placed into the liquid state before decrepitating. The total densities were estimated using the equation of state of Zhang & Frantz (Reference Zhang and Frantz1987); they are in the range 0.57–0.84 g cm−3 with a median of 0.72 g cm−3. On the other hand, the secondary FIs which were found in the form of trails in parallel arrangements are likely associated with healed microcracks or fractures cross-cutting the grain boundaries of the hosting quartz mineral (Fig. 10b). They are regularly shaped, mostly liquid-rich inclusions (F = 0.95 vol. % liquid) having a 12–21 μm diameter. Microthermometric data revealed that the T m ice is in the range −0.9 to −0.1 °C, with salinity ranging from 0.16 to 1.48 wt % NaCl equi. (with a mean of 0.82 wt % NaCl equi.). The measured T h total of fluid inclusions ranges from 139 to 208 °C with a mean of 176 °C. Density ranges from 0.86 to 0.93 g cm−3, with a median of 0. 9 g cm−3. The frequency distributions of T h total show the unimodal distribution of primary FIs and secondary FIs at temperatures around 310 and 190 °C, respectively (Fig. 11).
(a) Photomicrograph showing clusters or isolated inclusions of primary origin. (b) Trails of secondary FIs likely associated with healed microcracks or fractures cross-cutting the grain boundaries. (c) Three visible phases at room temperature observed in type-II FIs. (d) Single phase of liquid methane (CH4) of type-III FIs.

Histograms showing the frequency distribution of total homogenization temperatures (Th) of aqueous inclusions.

Three visible phases at room temperature were observed in type-II FIs (5–10 % of the total detected fluid inclusions): an outer aqueous-liquid phase, an inner carbonic-liquid phase and an innermost carbonic-vapour phase (Fig. 10c). Their carbonic phase ranges from 40 to 60 vol. % from the total volume. They are relatively small, ranging in size from 12 to 16 µm, mostly ellipsoidal/rounded in shape and found in the form of a colony and/or isolated inclusions, suggesting that they have a primary or pseudo-secondary origin. Both types of primary FIs (i.e. type-I primary and type-II FIs) are always found in close relationship as an assemblage within the same colony, which probably reveals the simultaneous trapping of these fluid inclusions within the same quartz crystals. Microthermometric measurements for type-II FIs showed that the melting temperatures of the carbonic phase (T m CO2) were detected at or a little below −56.6 °C, mostly proving the presence of CO2 as the dominant component. The melting temperature of ice (T m ice) ranges from −1.2 to −0.2 °C, with a median of −0.6 °C, and the melting of the CO2 clathrate (Tm clath.) occurred between 8.6 and 9.1 °C, suggesting a salinity range between 1.84 and 2.82 wt % NaCl equi. The partial homogenization of CO2 liquid + CO2 vapour (Th CO2) ranges between 28.1 and 29.6 °C with a median of 28.7 °C. Most of the type-II FIs were homogenized to vapour state, reflecting the low density of the carbonic phase. However, other FIs have been homogenized to liquid phase, showing the higher density of the liquid carbonic phase. The total homogenization temperatures (T h total) fall within the range 286–302 °C, with a median of 294.5 °C (Fig. 11); all of them were homogenized to liquid phase (water-dominated phase) before decrepitating. The bulk densities of FIs vary from 0.55 to 0.56 g cm−3.
Type-III FIs, which represent 20–25 % of the total number of FIs, contain a single phase of liquid methane (CH4) at room temperature. Most of these inclusions occurred in the form of an array with planar trends or sometimes randomly distributed having irregular shape and occasionally negative fluid inclusion with equant shape or negative cubic form (Fig. 10d). Some type-III FIs show necking down that may reflect post-entrapment re-equilibration. Their size is commonly between 8 and 24 µm. They show a wide range of temperatures of phase changes during the cooling and heating processes. During the cooling, methane bubbles appeared at temperatures between −99.8 °C and −136 °C, with a median of −103.7 °C; such a temperature range reflects the heterogeneous temperature of CH4 (Shepherd et al. Reference Shepherd, Rankin and Alderton1985). During the heating regime, the melting temperature of liquid methane (Tm CH4) was detected in the range −115.6 to −130.4 °C, with a median of −126 °C. The final homogenization temperatures of the methane (Th CH4) to liquid phase were achieved between −95.7 and −112.3, with a median of −102.3 °C (Fig. 11). Although the measured temperatures are higher than the critical temperature of pure methane (−82.1 °C, Shepherd et al. Reference Shepherd, Rankin and Alderton1985), this probably reflects the presence of tiny amounts of other gases besides the dominant CH4 molecules. The densities of methane FIs were estimated by the equation of state for Setzmann &Wagner (Reference Setzmann and Wagner1991) using the final homogenization temperature in the heating experiment. The density of type-III FIs ranges from 0.053 to 0.33 g cm−3.
8. Results and discussions
8.a. P–T conditions of deposition
Although H2O, CO2 and CH4 molecules have different physicochemical attributes, three different types of FIs (type-I, -II, -III FIs) were recorded with variable compositions; they also have a wide range of total homogenization temperatures and varying salinity and density due to continuous fluid evolution. In a first estimation, the presence of single-phase fluid inclusions and the coexistence of fluid inclusions with varying degrees of filling inside the same crystal could suggest that the formation of fluid inclusions was probably started by fluid immiscibility or phase separation, followed by heterogeneous trapping (Neumayr & Hagemann, Reference Neumayr and Hagemann2002). According to Roedder & Bodnar (Reference Roedder and Bodnar1980), fluid inclusions trapped under conditions of boiling or immiscibility are good indicators for P–T estimation because the entrapment temperature corresponds to the formation temperature. By combining the full range of isochores for fluid inclusions of primary nature (i.e. type-I primary and type-II FIs), using the homogenization temperatures at various densities, the temperature and pressure conditions of trapping can be provided from the isochore lines in the pressure–temperature space. Intersections of isochores for aqueous (type-I primary) and aqueous–carbonic (type-II) FIs (highest and lowest densities) give rise to a temperature range between 300 and 320 °C and a pressure range of 60–180 MPa (0.6–1.8 kbar) (Fig. 12). The ore-forming fluids show an evolutionary trend starting from early higher-temperature aqueous fluids (type-I primary FIs, T h total up to 366 °C), with higher density (0.57–0.84 g cm−3) and higher salinity (1.2–3.54 wt % NaCl equi.), then followed by lower-temperature aqueous–carbonic fluids (type-II FIs, T h total up to 302 °C), that exhibit lower density (d = 0.55–0.56 gm cm−3) and lower salinity (0.4–2.1 wt % NaCl equi.). On the other hand, the type-I secondary FIs were formed at later stages along partially healed fractures due to some deformation without any relationship to the mineralization period. They always offer a negative constraint, with the implication that secondary inclusions are not related to the timing of mineralization. Hence, they should be avoided during P–T estimation. The lower homogenization temperature of type-I secondary FIs (max. 208 °C) and lower salinity (max. 1.48 wt % NaCl equi.) could be attributed/related to meteoric/surface water. Type-III (methane-rich) FIs could have resulted from an effect of local re-equilibration, thus their lower density could not be an indicator for the trapping conditions (Vityk & Bodnar, Reference Vityk and Bodnar1995).
Construction isochores representing the P–T conditions of trapping in Haimur gold deposits. Lithostatic and hydrostatic depths were calculated assuming average listwenite rock density of 2.6 g cm−3.

However, the arsenopyrite geothermometer in this deposit gives a different view. The arsenopyrite is composed of 33.02–33.94 at. % As, which corresponds to temperatures between 405 and 512 °C. This temperature range is not consistent with the calculated temperature of fluid inclusions data (i.e. 300–320 °C). This may refer to the fact that the arsenopyrite, which is supposedly deposited from a fluid, was quite recrystallized and homogenized during early metamorphic recrystallization at the first stage of mineralization, and this pre-dated the gold deposition. Such a wide range of temperatures from arsenopyrite geothermometery may be attributed to ore formation or re-equilibration during the retrograde conditions of metamorphism (Kretschmar & Scott, Reference Kretschmar and Scott1976). Consequently, the deposition of the arsenopyrite is paragenetically earlier, which favours low-sulphidation environments (log ƒS2 = −5.5 to −4.5) (Heinrich & Eadington, Reference Heinrich and Eadington1986). Then the deposition of the gold + late pyrite ± chalcopyrite assemblage would be paragenetically later.
8.b. Type of mineralization and ore-bearing fluid source
The fluctuation of the estimated pressure (fluid inclusions data) correlates with an alternating lithostatic–hydrostatic fluid system. So, if the fluid pressure was supposed to be purely lithostatic, the provided pressures (0.6–1.8 kbar) give an estimated formation depth range starting from 2.4–7 km (average 4.7 km), based on the pressure–depth equation (P = h × g × ρ) assuming density of listwenite rocks ρ ≈ 2.6 g cm−3 and average specific gravity of the earth g = 9.8. The estimated depth for purely lithostatic pressure is to be considered a minimum depth, neglecting any extra hydrostatic effect of pressure, while the maximum depth can be inferred in a range of 6.1–18.3 km (average 12.2 km) assuming pure hydrostatic depth of pressure. Hence, the Haimur gold deposit was theoretically formed at a depth range from 4.7 to 12.2 km (presumably), which is correlated with the depth of mesozonal/orogenic ores (Goldfarb et al. Reference Goldfarb, Groves and Gardoll2001; Groves et al. Reference Groves, Goldfarb, Robert and Hart2003; Chen et al. Reference Chen, Pirajno and Qi2005).
The discrimination diagram of Wilkinson (Reference Wilkinson2001), modified after Roedder (Reference Roedder1984), was used to classify different types of deposits in the compilation of salinity vs homogenization temperature data. The studied fluid inclusions (type-I primary and type-II FIs) fall into the field of lode Au deposits (Fig. 13). The ore-bearing fluids of the Haimur area seem to have originated from a metamorphic source by plotting of the homogenization temperature against salinity (Wilkinson, Reference Wilkinson2001), in which the studied FIs fall into the field of metamorphic source. However, type-I secondary FIs considered to be trapped at later stages after cooling of quartz and primary ore minerals might be derived by percolation of meteoric/surface water (Fig. 14). Methane (type-III FIs) is most likely derived from the thermal decomposition of organic materials in metasedimentary associations. However, hydrocarbons play an important role in the deposition of gold, where the carrying-fluids need for redox agents can be found in carbon-bearing country rocks (i.e. pelitic schist, metasiltstone and metagraywake varieties).
Salinity vs homogenization temperature diagram illustrating typical ranges for fluid inclusions from different types of deposits with reference to fluid inclusions of the Haimur deposit after Wilkinson (Reference Wilkinson2001).

Homogenization temperature vs salinity (Wilkinson, Reference Wilkinson2001) for fluid inclusions of the Haimur gold deposit showing the average homogenization temperature–salinity distributions for different sources of hydrothermal solutions.

8.c. Transportation and deposition of gold
To define the mechanism of dissolution, transport, deposition and solubility of the metal (i.e. gold) in hydrothermal fluids, the complex ions and ligands should be determined (Pirajno, Reference Pirajno2009). Gold is generally transported as three main complex ions and ligands in the hydrothermal solution: sulphide [(Au(HS)° and Au(HS)2−], sulphur radical [Au(HS)S3−] and chloride [AuCl2−] (Stefánsson & Seward, Reference Stefánsson and Seward2003, Reference Stefánsson and Seward2004; Williams-Jones et al. Reference Williams-Jones, Bowell and Migdisov2009; Pokrovski et al. Reference Pokrovski, Kokh, Guillaume, Borisova, Gisquet, Hazemann, Lahera, Del Net, Proux and Testemale2015). At low to moderate temperature, the sulphide complex (HS–) is less dependent on such temperature; it is dominant in sulphur-rich reducing and neutral-alkaline solutions having low salinity (Pirajno, Reference Pirajno2009; Williams-Jones et al. Reference Williams-Jones, Bowell and Migdisov2009; Pokrovski et al. Reference Pokrovski, Kokh, Guillaume, Borisova, Gisquet, Hazemann, Lahera, Del Net, Proux and Testemale2015). Moreover, Shenberger & Barnes (Reference Shenberger and Barnes1989) showed that at a temperature range between 150 and 350 °C and pH 3–8, the gold may be transported and precipitated from aqueous hydrothermal fluid by both pH and redox changes and decreasing the activity of sulphide as Au(HS)2−. Pokrovski et al. (Reference Pokrovski, Kokh, Guillaume, Borisova, Gisquet, Hazemann, Lahera, Del Net, Proux and Testemale2015) stated that, at temperature >250 °C, pressure >100 bar and sulphur content >0.5 wt %, tri-sulphur radical complex [Au(HS)S3−] is very stable in hydrothermal fluids of metamorphic or magmatic origin at a wide range of pH and oxygen fugacity. On the other hand, at higher temperature, chloride complex (Cl2−) is predominant in chlorine-rich acidic and oxidizing solution having high salinity (Williams-Jones et al. Reference Williams-Jones, Bowell and Migdisov2009; Pokrovski et al. Reference Pokrovski, Kokh, Guillaume, Borisova, Gisquet, Hazemann, Lahera, Del Net, Proux and Testemale2015).
In the case of the Haimur gold deposit, the high concentration of sulphide minerals in the ore bodies indicates high sulphur content and wall rock sulphidation that may be the main factor for deposition of gold in association with the sulphide minerals (Sahoo et al. Reference Sahoo, Krishnamurthi and Sangurmath2018). Moreover, based on the fluid inclusion studies, the gold was transported and precipitated at temperatures ranging from 300 to 320 °C from low saline fluid, suggesting that the sulphide (HS¯) complex may be the major agent for gold transportation through hydrothermal fluids in the Haimur gold deposit. The gold deposition occurred while the change of pH of the mineralized fluid was taking place. The pH variation during gold transportation was controlled by CO2 buffering in the type-II FIs (Phillips & Evans, Reference Phillips and Evans2004). Also, the coexistence of methane-rich fluid inclusions (type-III) suggests that the mineralizing fluid was saturated with CH4 during the crystallization process (Mullis, Reference Mullis1979).
The P–T changes of the ore-bearing hydrothermal fluids depend on the geological processes: (1) cooling of ore fluid; (2) fluid / surrounding host rock interaction; (3) pressure decreases; (4) fluid immiscibility together with H2S loss (Gibert et al. Reference Gibert, Guillaume and Laporte1998; Mikucki, Reference Mikucki1998). All of these processes are responsible for changes in gold solubility and increase the ability of deeply sourced ore fluids to be transported from upper amphibolite to sub-greenschist conditions (Mikucki, Reference Mikucki1998). In the Haimur gold deposit, the changes of P–T conditions are associated with high sulphidation of reactive iron, higher hydrogen, lower aqueous sulphide activity, subsequent destabilization of Au(HS)2− complexes, and precipitation of gold with pyrite.
8.d. Deformation and metamorphism in ore formation
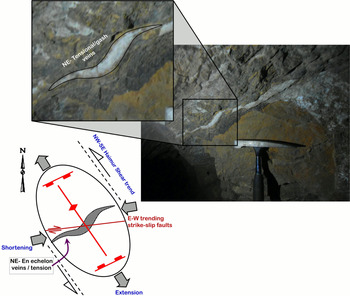
World-class orogenic Au deposits have direct linkage with the deformational and metamorphic events within a regional orogeny (Groves et al. Reference Groves, Goldfarb, Gebre-Mariam, Hagemann and Robert1998; McCuaig & Kerrich, Reference McCuaig and Kerrich1998; Goldfarb et al. Reference Goldfarb, Groves and Gardoll2001, Reference Goldfarb, Baker, Dube, Groves, Hart and Gosselin2005; Phillips & Powell, Reference Phillips and Powell2010). The present study reveals that the Haimur NE-trending gold-bearing quartz(-carbonate) veins which are confined to the listwenite zone are concurrent with D3 and D4 deformation phases of Kusky & Ramadan (Reference Kusky and Ramadan2002) in which D4 has resulted from D3. During D3 deformation in the WNW–ESE and NW–SE shear trends, the NW-trending left-lateral strike slip movements caused transtensional regime in the NE trends accompanied by open space and fractures filling with auriferous quartz veins (Fig. 15). The orientation of gold-bearing quartz veins in the Haimur area was formed due to extensional to transtensional shearing related to the Najd fault system.
Sketches of faults, fractures and extensional/gash quartz veins in the Haimur area.

While metamorphism plays an important role in ore formation in the Haimur area, in which the gold mineralization was supposed to be derived from metamorphic fluids created by dehydration and decarbonation of ophiolitic mélange assemblages and volcano-sedimentary rocks, such rocks are always located between two types of suture zones (arc–arc or arc–continental collisions) during the regional metamorphism process. However, the timing of these gold mineralizations relative to the time of metamorphism is still controversial, with regard to whether this was through syn-metamorphism or through post-metamorphic processes. Hence, the Au-bearing fluids in the present study have seemed to be migrated upward through uplift in the Earth’s crust via a crustal level of about 0.6–1.8 kbar, combined with a temperature drop in the range 300–320 °C (fluid inclusion data), where the solubility of gold and other base metals was decreased and then deposition has taken place. Therefore, the ore-forming processes are assumed to post-date the peak metamorphism but be synchronous with the retrograde metamorphic stages.
8.e. Metallogenic model of Haimur gold deposit
Similar models for gold deposition in Egypt and worldwide have been studied for characteristics and conditions of formation for the metamorphic/orogenic gold deposits (Essarraj et al. Reference Essarraj, Boiron, Cathelineau and Fourcade2001; Uemoto et al. Reference Uemoto, Ridley, Mikucki, Groves and Kusakabe2002; B Zoheir, unpub. PhD thesis, Ludwig-Maximilians-Universität München, 2004; Saravanan & Mishra, Reference Saravanan and Mishra2009; Klein & Fuzikawa, Reference Klein and Fuzikawa2010; Zoheir & Lehmann, Reference Zoheir and Lehmann2011; Abd El Monsef et al. Reference Abd El Monsef, Slobodník and Salem2018; Abd El Monsef, Reference Abd El Monsef2019) (Table 3). Based on the geologic, field relationships and petrographic data, the Haimur area comprises an arc – back-arc system that is expressed by obducted ophiolite slices into the island arc metavolcanics (meta-andesite). The plutonism in the study area is represented by the intrusion of granitoids (quartz diorite). Generally, the gold in the listwenite was supposed to be derived from the breakdown of serpentinite and dissolution of gold-rich oxides (Buisson & Leblanc, Reference Buisson and Leblanc1987). The Haimur gold mineralization in the listwenite depends mainly on the initial concentration in the serpentinite protolith. The hydrothermal evolution of the gold lode in Haimur was supposed to be started by dehydration of ophiolites and volcanoclastic rocks during metamorphism; the evolved fluids were able to extract gold and other metals from the hosting rocks, resulting in local concentration of precious metal through transportation. The metamorphic fluids resemble type-I primary and type-II FIs as primary fluid inclusions. Near the surface, a shower of cool meteoric water was responsible for the formation of low-salinity fluid inclusions through cracks and fissures (type-I secondary FIs). During uplift of mineralizing fluids, the Haimur auriferous quartz(-carbonate) veins/lenses are localized within listwenite zones along the NE-extensional to transtensional ductile shearing (Fig. 16). Precipitation of gold from solution could then have occurred when the pH, temperature and/or pressure dropped to the appropriate levels (Bohlke, Reference Bohlke1989).
Characteristic features of Haimur gold deposits in comparison with other orogenic gold deposits in Egypt and worldwide (modified after Abd El Monsef, Reference Abd El Monsef2019)

Sketch model of the Haimur gold deposit based on the deformation and fluid inclusion data (not to scale).

9. Conclusion
The gold lode in the Haimur area is represented by vein-style deposits that have been formed during the NE-extensional to transtensional deformation stage (D3). The ore fluids were probably sourced by the metamorphic dehydration and tectonic dewatering of the hosting ophiolitic and island arc assemblage in the study area. The first stage of ore formation began with a sulphide stage at a temperature range of 405–512 °C (arseonpyrite thermometry) that reflects the peak of the metamorphic event. Then another stage of mineralization followed through the retrograde metamorphism with a decrease in temperature of between 300 and 320 °C (fluid inclusions data). The gold was transported in the form of bi-sulphide complexes; constituently the ore-bearing fluids were migrated upward through the crustal level with the consequent temperature–pressure drop until specific conditions at which the gold became insoluble and started to deposit.
Acknowledgements
The authors are grateful to Prof. Marek Slobodník (Masaryk University, Czech Republic) for hosting the first author at the Institute of Geological Sciences, Masaryk University, Czech Republic, and for his help in making accessible the analytical work for fluid inclusions and EMPA. We deeply thank Prof. Mahmoud Mekkawi (NRIAG-Cairo, Egypt) for his support during the field trip. We also appreciate the personal communication of Prof. Wael Hagag (Benha University, Egypt) in the structural geology part. Some analyses in this study were financially supported by the STDF project (ID: 25288). Other geochemical analyses were funded by the Benha University research project, Egypt. Additionally, the authors are grateful to Prof. Dr Kathryn Goodenough (Executive Editor) and two anonymous reviewers for constructive comments and helpful suggestions, which greatly improved the manuscript.
Supplementary material
To view supplementary material for this article, please visit https://doi.org/10.1017/S0016756820000655.