In the UK National Health Service (NHS) Cancer Plan of September 2000, the British Government expressed the desire to improve cancer services (3). To this end, the Policy Research Programme of the Department of Health initiated a research study to estimate the costs and benefits of the current bowel cancer service in England and to examine the potential costs and benefits of alternative developments in service provision. The study of bowel cancer service provision was undertaken by a research team formed from the Health Economics and Decision Science Group from the School of Health and Related Research (ScHARR) at the University of Sheffield, United Kingdom, and the York Health Economics Consortium (YHEC) at the University of York, UK.
ScHARR developed a treatment pathway model that gave the possible sequences of presentation, diagnosis, treatment, and outcomes that could be followed by a patient with suspected colorectal (bowel) cancer. Model parameters had to be specified that gave the probabilities or probability distributions governing the path taken at each branch of the pathway model, with these probabilities depending on covariates such as patient characteristics. The treatment pathway model was used as the basis for a simple spreadsheet model to estimate the costs of current service provision and a discrete-event simulation model to evaluate the costs and benefits of options for change.
The majority of information required for the study could be quantified from available data sources. For some quantities, however, information was only available in the background knowledge and experience of experts. In this study, we describe the process through which expert opinion was elicited in the form of statistical quantities that were then used in the quantitative evaluation of potential changes in bowel cancer service provision.
Expert opinion has been quantified in probabilistic terms in a variety of medical contexts. It was used to provide probabilities for a Bayesian network developed for the diagnosis of esophageal cancer, in diagnostic radiology and in the diagnosis of pulmonary embolism (Reference Berbaum, Dorfman, Franken and Caldwell1;Reference Christiansen, Nilsson, Mare and Carlson2;Reference Sostman, Coleman, DeLong, Newman and Paine7;Reference Van Der Gaag, Renooij, Witteman, Aleman and Taal10). Harmanec et al. (Reference Harmanec, Leong and Sundaresh5) constructed a decision model with subjective probabilities for the management of severe head injuries and Tan et al. (Reference Tan, Chung, Tai, Cheung and Machin8) elicited subjective probability distributions for a phase III randomized controlled trial of treatments for hepatocellular carcinoma. Further examples are given in O'Hagan et al. (Reference O'Hagan, Buck, Daneshkhah, Eiser, Garthwaite, Jenkinson, Oakley and Rakow6, pp 195-204).
METHODS
Empirical evidence was lacking for the following quantities that relate to parameters of the pathway model; they are the quantities for which expert opinion was elicited.
(i) The time from the onset of symptoms related to colorectal cancer to a patient going to their GP.
(ii) The proportion of patients referred for investigation of symptoms associated with colorectal cancer that undergo flexible sigmoidoscopy, colonoscopy, barium enema, colonography.
(iii) The proportion of patients who present as emergency cases who currently undergo/potentially could undergo stenting.
(iv) The proportion of patients with Dukes’ B/C colorectal cancer who receive adjuvant chemotherapy following complete resection of their primary tumor.
(v) The proportion of patients who receive alternative sequences of chemotherapy for metastatic colorectal cancer.
(vi) The proportion of patients with metastatic colorectal cancer who receive downstaging chemotherapy.
(vii) The proportion of patients with metastatic colorectal cancer who currently undergo/could undergo liver or pulmonary resection.
(viii) The proportion of rectal cancer patients who undergo preoperative/postoperative radiotherapy (with/without chemotherapy).
(ix) The survival duration of patients with metastatic colorectal cancer who receive best supportive care with no further active intervention.
Conduct of the Elicitations
Four medical experts were identified who were willing to participate. Between them, their expertise covered the range of issues on which expert knowledge was required. Before the elicitation sessions, they were given an information pack detailing the background and context to the work, the purposes and potential impact of their input, and a short summary of available information related to each parameter of interest.
Covariate structures that might relate to these quantities were also suggested. For example, for the first quantity, time from onset of symptoms to going to GP, the suggested covariates were sex, age, underlying disease, whether there was an obstruction, whether there were multiple symptoms, socioeconomic group, and access to care. Discussion with the expert (by email and/or telephone) then identified the covariates that he (the experts were all male) believed to be relevant.
In addition, the experts were given an outline of the questions that they would be asked. With regard to emergency stenting, for instance, they were told that they would be asked about:
• The proportion of people who undergo stenting as a bridge to surgery.
• The proportion of patients unfit for surgery who undergo stenting to relieve obstruction.
• The potential proportion of patients who could undergo stenting as a bridge to surgery.
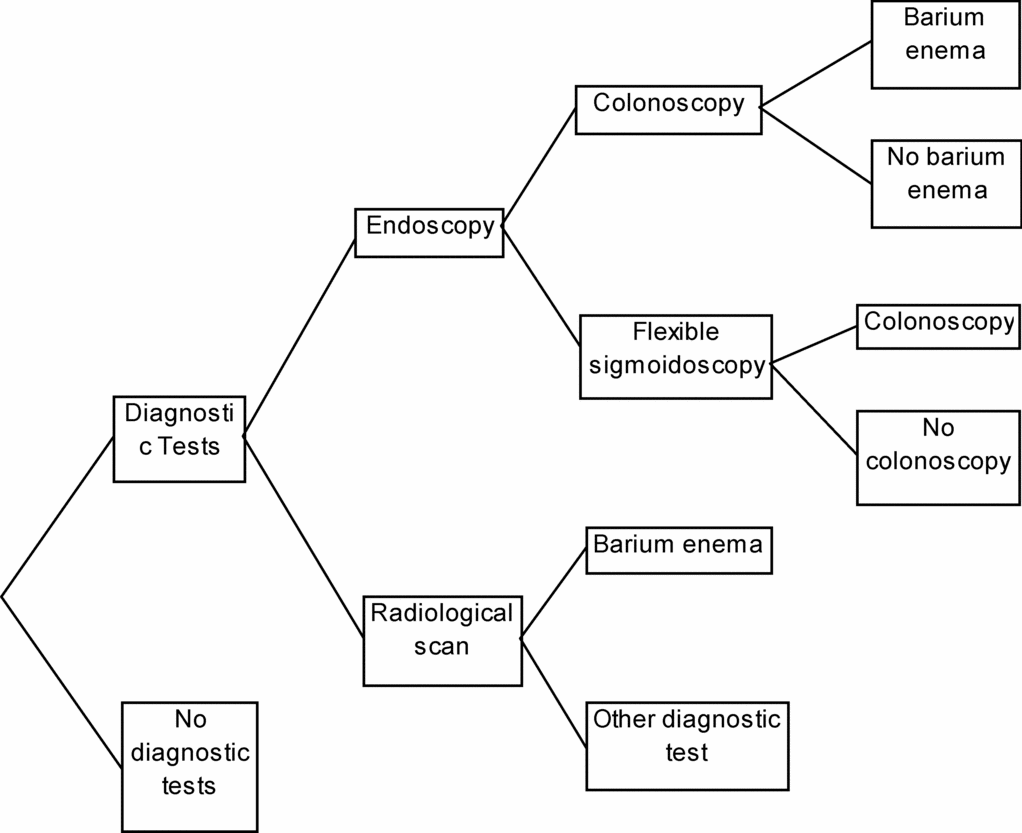
Questions typically related to a set of possible actions or outcomes that had an inherent structure and the probabilities attached to them had to satisfy particular requirements to be coherent. For example, the possible actions might form a set of exhaustive and mutually exclusive events and the probabilities attached to them would then need to sum to one. However, while this type of requirement is easily explained to the expert when he or she is giving point estimates of the probabilities, it is not obvious what requirements should be satisfied when he is quantifying his uncertainty by giving interval estimates of each probability. Also, requirements for statistical coherence should not be prominent in an expert's mind when he is giving assessments; otherwise there is a danger that he will focus on satisfying these requirements rather than on representing his opinions accurately. To avoid these problems, in the actual elicitation sessions sets of questions were structured so that each question involved exactly two possible actions or outcomes. Often this resulted in a set of conditional questions. For example, the following questions were asked about diagnostic investi-gations.
(a) What proportion of patients referred for investigation of symptoms of bowel cancer do not undergo diagnostic testing (i.e., go straight to surgical intervention)?
(b) What proportion of the patients referred undergo endoscopy (flexible sigmoidoscopy or colonoscopy) as their first investigation rather than a radiological scan (barium enema, colonography)?
(c) Of those patients undergoing endoscopy, what proportion undergo colonoscopy as their first investigation?
(d) Of those patients undergoing colonoscopy, what proportion then have a barium enema?
(e) Of those patients who undergo flexible sigmoidoscopy, what proportion then have a colonoscopy?
(f) Of those patients undergoing a radiological scan, what proportion undergo a barium enema as their first investigation?
These questions relate to a section of the pathway model shown in Figure 1.
Pathway for diagnostic tests.

Similarly, when the quantity of interest was the time to an event or the time between events, the time scale was partitioned into a set of intervals and the probabilities that the quantity lay in each interval were determined through a sequence of questions. Conditional questions were used to ensure that requirements for statistical coherence were satisfied. To illustrate, the following questions were used to quantify opinion about the time from onset of symptoms related to colorectal cancer to a patient going to their GP.
(a) What proportion of patients would have had symptoms for over 2 years before going to their GP?
(b) Given that it is less than 2 years, what proportion would have had symptoms for more than 1 year?
(c) Given that it is less than 1 year, what proportion would have had symptoms for more than 6 months?
(d) Given that it is less than 6 months, what proportion would have had symptoms for more than 3 months?
The four medical experts were questioned in separate sessions. Three of the sessions were conducted face-to-face but the fourth had to be conducted by telephone because of time constraints. The first expert found it difficult to express his judgment quantitatively and instead altered the questions he was asked so that he could give answers on the basis of data that were available to him. The revisions to questions made it difficult to make full use of his answers. The second medical expert was very numerate; for example he understood the meaning of a median, lower quartile and upper quartile, often analyzed data and could readily quantify his judgment. This session went smoothly, and the expert assessed medians and quartiles for a range of quantities. Early in the session, the following conversation helped the expert develop a strategy for assessing quartiles.
Facilitator: What is your median estimate of the time between a patient first experiencing rectal bleeding and visiting his GP?
Expert: Seven days.
Facilitator: So you reckon that the probability that the patient will go to his GP in less than 7 days is equal to the probability that it will be longer?
Expert: Yes.
Facilitator: What is your lower quartile for the time between a patient first experiencing rectal bleeding and visiting his GP?
Expert: Two days.
Facilitator: Do you think the patient is more likely to go to his GP in less than 2 days or between 2 and 7 days? Which would you bet on: less than 2 or between 2 and 7?
Expert: The latter. I think he is more likely to go to his doctor between 2 and 7 days.
Facilitator: That means your lower quartile should be bigger than 2. What about 3? Would you bet on the patient going to his GP in less than 3 days or between 3 and 7 days?
Expert: It's hard for me choose between them. Neither one seems noticeably more likely than the other. That means that 3 is my lower quartile?
Facilitator: Yes.
A similar check was done after the expert gave his upper quartile. For subsequent quartile assessments, it was clear that the expert was using this strategy of indifference between bets when formulating his opinions.
The third and fourth experts were each questioned about a large number of quantities and both gave useful assessments. For all quantities, a median was assessed. In addition, for most quantities quartiles were also assessed or, less frequently, a minimum and maximum value interpreted as the 1st and 99th percentile. Which quantities were elicited reflected the expert's preferred manner of expression, as the elicitation sessions were conducted in a flexible way so as to tailor the assessment tasks to suit the expert.
For most quantities, the experts’ opinions about their value were independent of any covariates. However, the expert questioned about diagnostic tests included a patient's level of fitness (whether the patient was sufficiently well to undergo an endoscopy) as a covariate and the expert questioned about adjuvant chemotherapy had five covariates associated with the probability that this chemotherapy would be used. When covariates were involved, experts’ opinions were elicited using specially developed software. This software has a range of applications and is described in the next section.
Elicitation Software
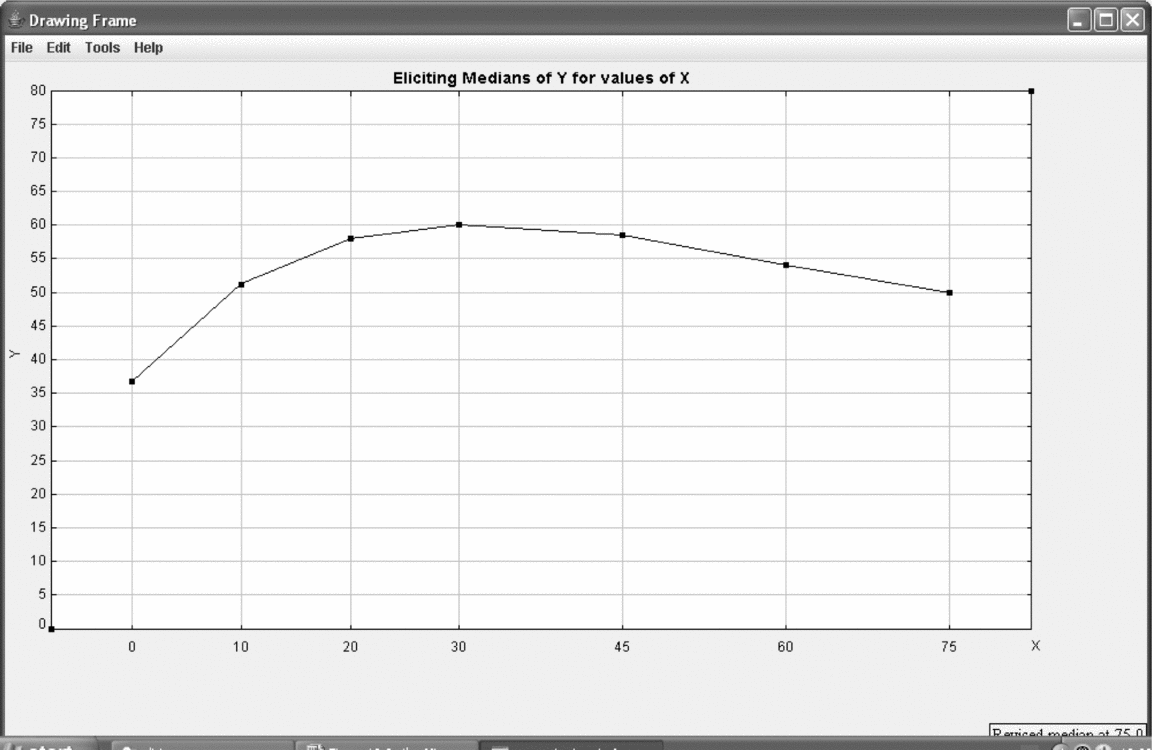
Let Y denote the quantity of interest. For example, Y might be the probability that a patient will receive adjuvant chemotherapy. Covariates are continuous variables (such as the age of a patient) and factors, such as tumor location (colon or rectum). The elicitation software assumes that Y is related to the covariates by a generalized piecewise-linear model. Figure 2 illustrates a piecewise-linear relationship between Y and a continuous covariate X; the relationship corresponds to a sequence of straight lines that form a continuous line. Places where the slope of the line changes are referred to as knot points.
A piecewise-linear relationship given by median assessments.

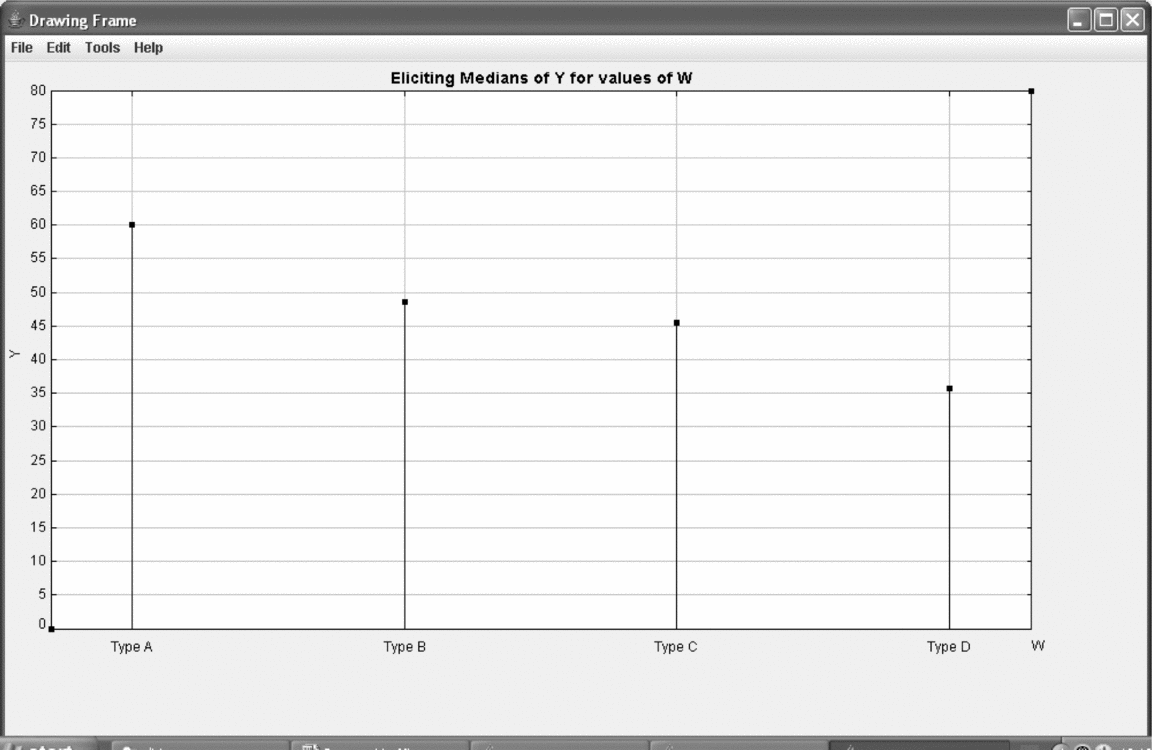
If a covariate, W say, is a factor (i.e., taking values in a set of alternatives, called levels) then the relationship between Y and W corresponds to a bar-chart, as in Figure 3 where W takes four levels, A, B, C, and D. The aim of the elicitation is to quantify opinion about the slopes of the straight lines (for continuous variables) and the heights of the bars (for factors).
Median assessments for a factor.

The software is interactive, requiring the expert to either type in assessments or plot points on graphs and bar-charts using interactive graphics. The following outlines the steps of the elicitation process. A fuller description is given in Garthwaite and Al-Awadhi (Reference Garthwaite and Al-Awadhi4), where detail of formulae used to determine model parameters is also given.
(a) Continuous covariates are specified with their minimum and maximum value; factors are specified and their levels listed according to the size of their effect on Y.
(b) A reference point is chosen for each covariate. For a factor, the reference point is taken as its first-named level; for a continuous variable either the value where Y is a maximum or a minimum is chosen. The origin is the setting for which every covariate is at its reference point. For example, for adjuvant chemotherapy, the origin was age = 60 years, tumor location = colon, disease status = Dukes C, perforation/obstruction = no, fitness for cytotoxic therapy = yes.
(c) Using a dialogue box, the median, and lower and upper quartiles of Y at the origin are assessed.
(d) For each continuous variable, knot points are chosen by the expert or default values are specified by the computer. With adjuvant chemotherapy the knot points for age were 40, 50, 60, 65, 70, and 80 years.
(e) For each covariate in turn:
• The computer displays a graph/bar-chart with Y along the vertical scale and the covariate along the horizontal axis.
• The median of Y at the reference point (elicited in step c) is plotted by the computer.
• The expert gives his median estimate of Y at other knots/factor levels by “clicking” the mouse on vertical lines that the computer has drawn through each knot or level. For continuous covariates, straight lines are drawn between the “clicked” points, as in Figure 2, and vertical bars are drawn for factors, as in Figure 3. The expert may change any number of his assessments by re-clicking on the vertical lines.
(f) For each covariate in turn, the computer displays the graph/bar-chart of the medians assessed for the covariate in step e and sets of conditional quartile assessments are elicited:
• For the first set of quartile assessments the condition is that the median assessment of Y at the reference point is correct. The expert assesses lower and upper quartiles of Y at other knots/levels by clicking on the vertical lines at each knot/factor level.
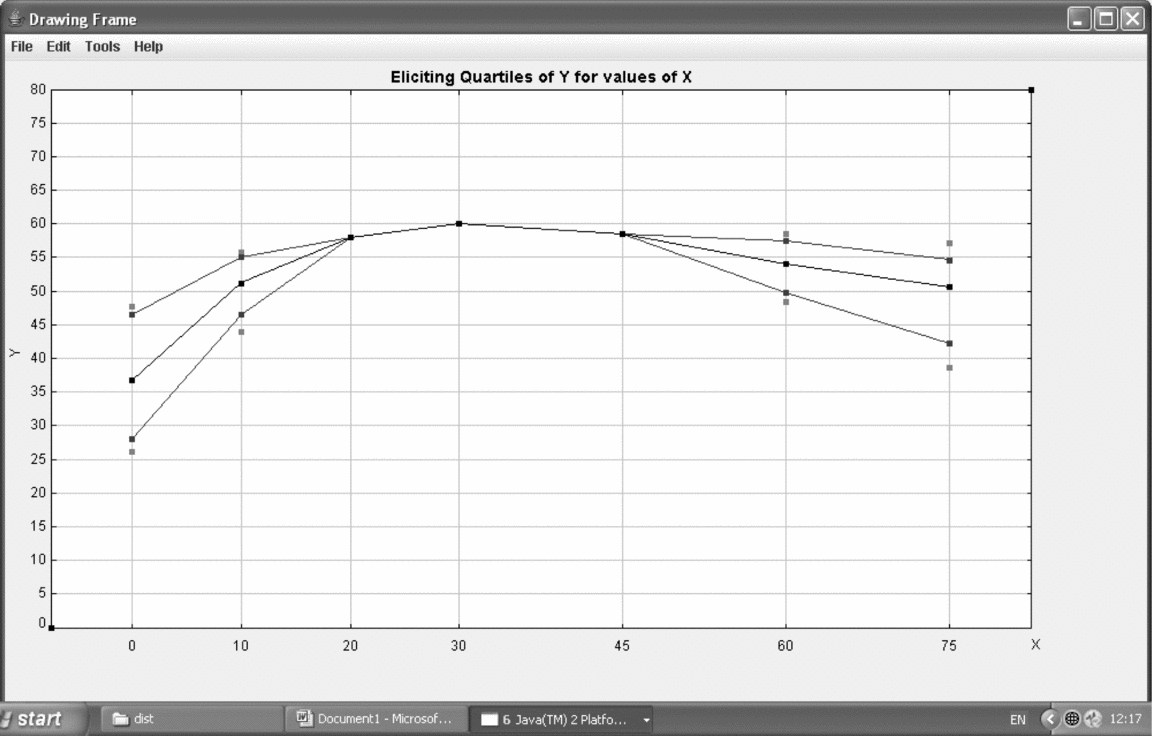
• For subsequent sets of quartile assessments, the condition is that the assessed medians for Y at the reference point and adjacent knots/levels are correct. For example, for the second set of assessments for age, Y-values were treated as correct for ages 50, 60, and 65 years and, for the third (final) set, at ages 40, 50, 60, 65, and 70. Quartiles of Y at each of the other knots/levels are elicited. In Figure 4, the condition is that the medians at the middle three knots are correct and conditional quartiles at the other knots have been assessed.
Conditional quartile assessments for a continuous variable.

The assessments are used to determine a multivariate normal distribution to represent the expert's opinions about the regression coefficients of the generalized piecewise-linear model. A software program and user guide for the elicitation method are freely available at http://statistics.open.ac.uk/elicitation.
RESULTS
The results of the elicitation sessions are given in detail in Appendix B: Elicitation Methods and Calibration of the report Bowel Cancer Services: Costs and Benefits (Reference Trueman, Lowson, Bending, Ganderton, Chaplin, Wright, Duffy, Saxby, Chilcott, Tappenden, Pilgim, Shorthouse and Tappenden9). That report was intended to inform government policy on NHS bowel cancer services, and we will refer to it as the YHEC-ScHARR report.
In all, medians and quartiles were assessed for thirty-four quantities, point estimates with minimum and maximum values were assessed for seven quantities, and point estimates were assessed on their own for four quantities. The experts’ assessments are listed in the YHEC-ScHARR report. In addition, expert opinion was quantified as a multivariate normal distribution for two quantities, using the computer software described above. The parameters of these distributions are also given in Appendix B of the YHEC-ScHARR report.
When assessments from more then one expert were elicited for a quantity the different sets of assessments were compared. Typically, there was good agreement between them. For example, commenting on assessments about adjuvant chemotherapy, the YHEC-ScHARR report notes that “The [pathways] model uses expert 1's responses as part of a generalized linear model and is validated by expert 2's responses.” (Reference Trueman, Lowson, Bending, Ganderton, Chaplin, Wright, Duffy, Saxby, Chilcott, Tappenden, Pilgim, Shorthouse and Tappenden9, Appendix B, p. xiv). Similarly, for the usage of downstaging chemotherapy, expert 1's mid-range was 13 percent and expert 2's mid-range was 16 percent; the YHEC-ScHARR report comments “The model uses expert 2's responses which are very similar to expert 1’s.” (Reference Trueman, Lowson, Bending, Ganderton, Chaplin, Wright, Duffy, Saxby, Chilcott, Tappenden, Pilgim, Shorthouse and Tappenden9, Appendix B, p. xv).
On two occasions, an expert had data that related to a quantity of interest while assessments about the quantity were also provided by another expert. For one quantity, there was agreement between the data and the expert's assessments; the YHEC-ScHARR report uses the data noting that it captures the same proportion of patients without chemotherapy (11–22 percent) as suggested by the assessments of expert 2 (10 percent for patients aged under 75; 40 percent for those over 75). For the other quantity, there were slight differences between the expert's assessments and the data, but the number of data was not large. The YHEC-ScHARR report took a cautious but sensible approach: “The model uses expert 1's audit data as central estimates with greater uncertainty than specified to allow for expert 2's estimates.” (Reference Trueman, Lowson, Bending, Ganderton, Chaplin, Wright, Duffy, Saxby, Chilcott, Tappenden, Pilgim, Shorthouse and Tappenden9, Appendix B, p. xvi).
The case study project, funded by the Department of Health, had two objectives. First, to assess the costs and outcomes delivered by the current NHS services for colorectal cancer and, second, to provide an evaluation of potential options for service development. A conceptual model of treatment pathways in colorectal cancer was developed. This conceptual model was used as the basis for two distinct mathematical models: a baseline model to estimate costs and outcomes under the current services provision and an options model to quantify the likely costs and benefits of different modifications to the service provision. The models both required estimates of many quantities, mainly proportions/probabilities, and both models required that the current levels of uncertainty should be characterized in all parameters. Much of the data collected and used were common across the two models and the models were validated and calibrated against each other.
The YHEC-ScHARR study represented the most robust attempt to date to capture the full costs of treating bowel cancer in England. The research estimated that bowel cancer costs almost £1.1billion per annum to manage. The options appraisal exercise suggested that outcomes could be improved and in some cases costs reduced through changes to the current treatment pathways. For example, the study indicated that increasing the usage of colonoscopy from 70 percent to 90 percent was potentially the most economically attractive option for improving outcomes for bowel cancer patients. Also, introducing an Enhanced Recovery Programme was likely to be cost saving with initial indications of a low associated risk of detrimental clinical outcomes. At the same time, many of the options assessed within the model displayed high levels of uncertainty, making it difficult to differentiate between their relative effectiveness. The model was, therefore, equally useful in directing future clinical and economic research requirements in addition to identifying specific beneficial changes to the bowel cancer service.
DISCUSSION
Quite commonly, not all the information that is required for decision making or planning is available. To make progress, often numbers are inserted where required and this is done without noting that they are based on judgment. The consequence is that the way in which the judgments were reached is not documented (and may not have used good assessment strategies or qualified experts) and uncertainty that should be associated with the judgments is not catered for in any modeling. The latter fault can result in firm conclusions being drawn from inadequate knowledge.
This study illustrates that quantifying and using expert judgment can be acceptable in real problems of practical importance. The YHEC-ScHARR report could be open about its use of expert assessments because of the care with which opinion was elicited and used. The work demonstrates the following points of good practice in using expert judgment.
• The experts were well chosen: they indeed had expert knowledge on the areas they were questioned about.
• In advance of the elicitation sessions, discussion took place with the experts to determine appropriate questions, such as identifying any covariates that the expert thought would affect the quantities of interest.
• Sets of questions were formed in such a way that requirements for statistical coherence were satisfied by elicited assessments without the expert focusing on these requirements, so the experts could concentrate on representing their opinions.
• Elicitation sessions were conducted in a flexible way so that, where possible, assessment tasks could be tailored to suit the expert.
• Assessments for some quantities were validated, both by eliciting the opinions of more than one expert and comparing their answers, and by comparing an expert's opinion with data.
• Interval estimates for a quantity were normally assessed (as well as a point estimate) so as to quantify an expert's uncertainty.
• Models allowed appropriately for uncertainty in the quantities that drove their outputs and confidence intervals for the outputs were determined, making it clear which conclusions were firm and which could only be tentative.
• The conduct of the elicitation process and the resulting assessments were reported in detail.
CONTACT INFORMATION
Paul H. Garthwaite, PhD (p.h.garthwaite@open.ac.uk), Professor of Statistics, Department of Mathematics and Statistics, The Open University, Walton Hall, Milton Keynes, MK7 6 AA, UK
James B. Chilcott, MSc (j.b.chilcott@sheffield.ac.uk), Technical Director, ScHARR-Technology Assessment Group, Senior Research Fellow, School of Health and Health Related Research, The University of Sheffield, Regent Court, Sheffield, S1 4DA, UK
David J. Jenkinson, PhD (d.j.jenkinson@abdn.ac.uk), Statistician, Health Services Research Unit, University of Aberdeen, Forresterhill, Aberdeen, AB25 2ZD, Scotland, UK
Paul Tappenden, MSc (p.tappenden@sheffield.ac.uk), Research Fellow, School of Health and Health Related Research, The University of Sheffield, Regent Court, Sheffield, S1 4DA, UK