Introduction
The Hawaiian beet webworm, Spoladea recurvalis (Fabricius, Reference Fabricius1775) (Lepidoptera: Crambidae: Spilomelinae; fig. 1A, B), is an important agricultural pest and one of the most widely distributed moth species (Powell and Opler, Reference Powell and Opler2009). Sometimes referred to by the shortened common name of ‘beet webworm’, two other crambid moths in the subfamily Pyraustinae, Loxostege sticticalis (Linnaeus) and L. munroealis Leraut, are also known by the same name, thus ‘Hawaiian beet webworm’ is the preferred usage. Although mainly a tropical and subtropical species, S. recurvalis also can be found in temperate regions, with documented records from all continents except Antarctica (iNaturalist, 2026). Larvae feed on a wide variety of agricultural crops and ornamental plants throughout its range, including, but not limited to, those in the families Poaceae (maize), Solanaceae (tomato, eggplant), and Amaranthaceae (amaranth, coxcomb, beets, spinach) (Arabi et al., Reference Arabi, Idder-Ighili, Nani and Idder2025). In Africa and Asia, larvae of S. recurvalis are considered one of the most devastating pests of cultivated amaranth (Othim et al., Reference Othim, Ramasamy, Kahuthia-Gathu, Dubois, Ekesi and Fiaboe2019, and references therein). The only other species in the genus Spoladea is the morphologically distinct S. mimetica (Munroe, Reference Munroe1974) from Papua New Guinea (fig. 1C).
Photos of voucher specimens and identification codes of Spoladea in the Barcode of Life Data System (BOLD). (A) S. recurvalis, haplotype Group A, Maryland, USA (MNAI331-09); (B) S. recurvalis, haplotype Group B, Queensland, Australia (IMLQ955-08); (C) S. mimetica, Papua, New Guinea (EPNG4596-11). Photo credits: (A) Jean-Francois Landry; (B) Ian McMillan; (C) Smithsonian Institution, National Museum of Natural History, S. mimetica (EPNG4596-11). Copyrighted photos of S. recurvalis were used under the terms of the Creative Commons Attribution License; the photo of S. mimetica is not under copyright.

Although much information is available on chemical and biological control measures (Othim et al., Reference Othim, Ramasamy, Kahuthia-Gathu, Dubois, Ekesi and Fiaboe2018, Reference Othim, Ramasamy, Kahuthia-Gathu, Dubois, Ekesi and Fiaboe2019), scant information is available on the population genetics of S. recurvalis. Importantly, it is unknown if it should be considered a panmictic population, or whether population subdivision has occurred over its broad geographic range. Phenotypically, no obvious differences in wing maculation are apparent in adults from different regions (Ratnasingham and Hebert, Reference Ratnasingham and Hebert2007; iNaturalist, 2026; fig. 1A, B). However, the possibility of population differentiation in morphologically conserved S. recurvalis, accompanied by underlying differences in life history or ecological traits that may have evolved in diverged populations, could potentially affect the efficacy of control measures in this important pest. The aim of the present study is to address the population structure question by conducting a genetic study based on publicly available mitochondrial DNA barcodes of S. recurvalis obtained from a global sample of specimens (Ratnasingham and Hebert, Reference Ratnasingham and Hebert2007).
Materials and methods
Standard 658 base pair (bp) barcodes of the cytochrome c oxidase subunit I (COI or cox1) gene (Hebert et al. Reference Hebert, Cywinska, Ball and deWaard2003) were sourced from the Barcode of Life Data System (BOLD; Ratnasingham and Hebert, Reference Ratnasingham and Hebert2007). There are approximately 475 sequences of S. recurvalis obtained from 50 countries and oceans currently deposited in BOLD, 137 of which are listed as private. Of the approximately 340 publicly available barcodes, 79 were selected for analysis, together with the single available barcode for S. mimetica (table 1). The rationale for selecting a subset of the 340 sequences is described in the ‘Results’ section. The trimmed dataset (table 1) consisted of a geographically representative sample of S. recurvalis from 42 countries and oceanic islands. Although S. recurvalis is widely distributed in South America (iNaturalist, 2026), no barcodes were available from that region. The decrease from 50 to 42 geographic localities sampled in the trimmed dataset results from the significant number of unavailable private sequences in BOLD.
COI barcode records of Spoladea recurvalis and S. mimetica sourced from the Barcode of Life Data System (BOLD)

Table 1 Long description
Records list geographic locality, geographic coordinates, BOLD ID, base pairs in bp, and haplotype group for Spoladea recurvalis and Spoladea mimetica. Spoladea recurvalis entries are grouped by region: North America, Europe, Africa, Asia, South East Asia, Australia, and Oceania. North America includes Canada, USA, Cuba, Martinique, Mexico D. F., and Costa Rica, with haplotype group A throughout and base pairs ranging from 588 to 658, including one Martinique record at 610 and one Manitoba record at 588. Europe lists Portugal, Spain, Italy, Germany, Norway, Greece, and Cyprus, all haplotype group A with base pairs from 654 to 658. Africa lists Madagascar, Seychelles, Mozambique, Kenya, Nigeria, Tanzania, South Africa, Ivory Coast, Algeria, and Morocco, all haplotype group A with base pairs from 653 to 658. Asia includes Israel, United Arab Emirates, Pakistan, Kerala in India, Bangladesh, Bhutan, Japan, South Korea, China Sichuan, China Shandong, and Taiwan, mostly haplotype group A with one Kerala record in haplotype group B at 563 bp and base pairs otherwise ranging from 579 to 658. South East Asia includes Thailand, Vietnam, and the Philippines, with haplotype group B for Thailand and two Vietnam records, and haplotype group A for the remaining Vietnam and Philippines records; base pairs range from 596 to 658. Australia lists multiple localities across Queensland, Western Australia, South Australia, New South Wales, Tasmania, and Cocos Keeling Islands, all haplotype group B with base pairs from 549 to 658. Oceania lists French Polynesia Marquesas and Tahiti in haplotype group B at 658 bp, and Hawaii and Fiji in haplotype group A at 657 and 658 bp; several rows show missing geographic coordinates using two hyphens.
Uncorrected pairwise genetic distances (p-distances) among barcodes were calculated in MEGA version 5.0.5 (Tamura et al., Reference Tamura, Peterson, Peterson, Stecher, Nei and Kumar2011) and abbreviated here as ‘d’. A haplotype network of barcodes was created based on statistical parsimony implemented in TCS version 1.21 (Clement et al., Reference Clement, Posada and Crandall2000). Calculations of COI genetic diversity indices and neutrality tests, Tajima’s (Reference Tajima1989) D and Fu’s (Reference Fu1997) F S, were performed in DnaSP v5.10.01 (Librado and Rozas, Reference Librado and Rozas2009). The threshold values for ranking haplotype diversity (h) and nucleotide diversity (π) as high were h = 0.701 and π = 0.00356 (Goodall-Copestake et al., Reference Goodall-Copestake, Tarling and Murphy2012). Analysis of molecular variance (AMOVA), carried out in ARLEQUIN v.3.5.2.2 (Excoffier and Lischer, Reference Excoffier and Lischer2010), was used to test for population structure.
Results
Preliminary screening of one (or two if available) arbitrarily selected barcodes (658 bp) from each geographic region were imported into MEGA and easily aligned by eye. Two sequences from Australia showed several nucleotide substitutions not apparent in the remainder of the dataset. Therefore, 16 additional barcodes arbitrarily selected from different states in Australia, together with several additional barcodes from South East Asia and North America, were added to the final trimmed dataset comprised of 79 sequences (table 1). All sequences were of high quality, with no stop codons or indels evident. The translated barcodes, including the single sequence in S. mimetica, showed no amino acid substitutions. The geographic localities of nine specimens with shorter barcodes (549–610 bp) were informative but were omitted from genetic diversity analysis. There were 20 variable sites and 14 haplotypes in the full-length trimmed barcode dataset of S. recurvalis (n = 70). Of the variable sites, 18 were third codon position transitions, 1 was a first position transition (nucleotide site 401, and 1 was a third position transversion (site 565).
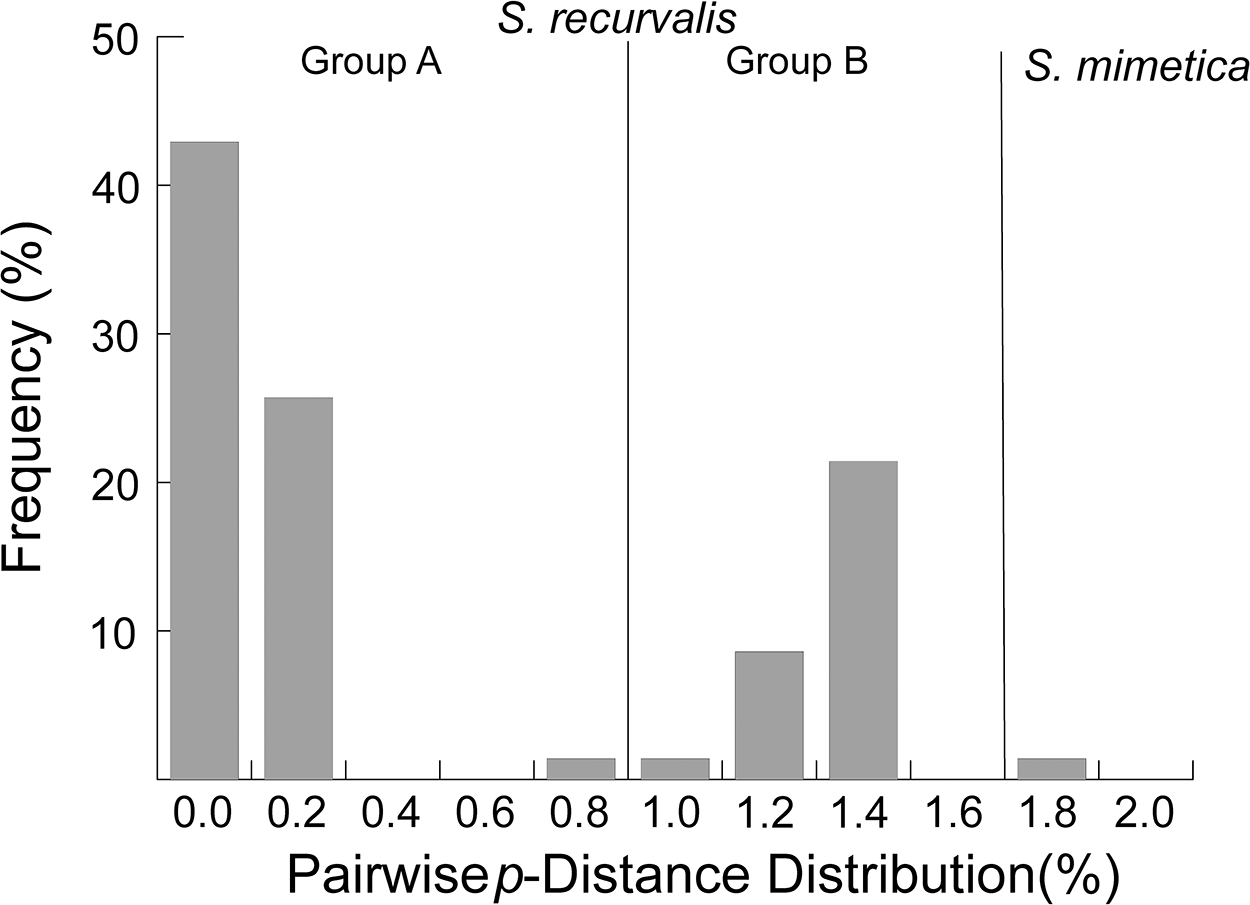
To assess whether the trimmed dataset was representative of the larger publicly available dataset, the Barcode Index Number (BIN) for Spoladea recurvalis (BOLD:AAA3666) was consulted. A bar graph showing the frequency of pairwise genetic distance ‘d’ values among the 349 S. recurvalis (plus S. mimetica), in which barcodes could be as short as 500 bp (Ratnasingham and Hebert, Reference Ratnasingham and Hebert2013), showed a bimodal distribution, with peak values at d = 0.0–0.2% and d = 1.2–1.4%. Most (48%) of the d values were found within the first peak, with 36% of the d values found in the second peak. The frequency of pairwise d values among the 70 S. recurvalis (plus S. mimetica) showed a similar bimodal distribution to that seen in BOLD, with 68% and 30% of the values resolving within in the first and second peaks, labelled Groups A (n = 48) and B (n = 22), respectively (fig. 2). Thus, the trimmed dataset is in general agreement with the larger BOLD record. The mean pairwise divergence between Groups A and B was d = 1.3% (range 0.9–1.4%). Pairwise comparisons of the single S. mimetica with those of Group A yielded d = 1.8% (range 1.7–1.9%) and d = 1.7% (range 1.5–1.9%) for those in Group B. Both fig. 2 and the bar graph in BOLD include S. mimetica in the same BIN as S. recurvalis because their pairwise d values are less than the threshold of d < 2.2% established for BIN members (Ratnasingham and Hebert, Reference Ratnasingham and Hebert2013).
Frequency distribution of pairwise d values in the trimmed barcode dataset of S. recurvalis, including the single S. mimetica (n = 71).

Geographical distribution of barcodes in Groups A and B of S. recurvalis, and of S. mimetica, is shown in fig. 3. Group A was the most widely distributed, found in North America, Africa, Europe, and Asia, and on the Pacific islands of Hawaii and Fiji. Barcodes from S. recurvalis Group B were found only in Australia (including the Cocos [Keeling] Islands and Tasmania), southern India, Southeast Asia, and French Polynesia.
Geographical distribution of barcode sequences of Spoladea recurvalis resolving in Group A (green symbols) and Group B (red symbols). Also shown is the location of the single barcode of S. mimetica from Papua New Guinea (yellow symbol).

Figure 3 Long description
The geographical distribution of barcode sequences for Groups A and B of S. recurvalis and S. mimetica. Green symbols represent Group A, which is widely distributed across North America, Africa, Europe, Asia and the Pacific islands of Hawaii and Fiji. Red symbols indicate Group B, found in Australia, including the Cocos Islands and Tasmania, southern India, Southeast Asia and French Polynesia. A yellow symbol marks the location of S. mimetica in Papua New Guinea. Specific locations labeled include Hawaii, Socorro Island, Marquesas Islands, Tahiti, Martinique, Seychelles, Cocos Islands and Lord Howe Island.
The TCS haplotype network of the trimmed dataset (fig. 4) showed a total of 14 barcode haplotypes resolving in two distinct groups, which correspond to geographic locality for Groups A and B shown in fig. 3. The two haplotype groups were separated by a minimum of six nucleotide substitutions. The major haplotype in Group A was present on all continents sampled (except Australia) and on Fiji. The Hawaii haplotype was the most divergent of those in Group A. Also consistent with fig. 3 was the absence of Group A haplotypes in the 18 Australian barcodes analysed. These barcodes resolved in one major (n = 13) and one minor (n = 5) haplotype in Group B. The major haplotype in Group B was also present in Southeast Asia (Vietnam) and on the Marquesas in Oceania. To further explore if haplotype Group A was absent in Australia, 60 additional BOLD barcodes from Australia were added to the TCS dataset. Again, only two Group B haplotypes were present, with total number of individuals for each added in parentheses to fig. 4. Spoladea mimetica was separated from S. recurvalis (Group A) by a minimum of 12 nucleotide substitutions, and separated by a minimum of 10 nucleotide substitutions from group B. The AMOVA indicated significant population structure (ΦST = 0.880; P < 0.001) between Groups A and B.
TCS haplotype network of geographically representative samples of Spoladea recurvalis barcode sequences sourced from BOLD (n = 70). The single available sequence for the phenotypically distinct S. mimetica from Papua New Guinea (yellow circle) also resolved within the network. Other geographical locations are given in the coloured key. Specific locations for samples from Oceania are labelled. Numbers within circles represent the number of individuals with that haplotype if greater than 1. Numbers in parenthesis for the two haplotypes from Australia represent the total number of individuals with that haplotype when 60 additional barcodes from Australia were added to the trimmed dataset (see the ‘Results’ section). Each line segment between haplotypes represents a single nucleotide substitution. The black dots represent inferred intermediate haplotypes that were not sampled.

Figure 4 Long description
Haplotype network illustrating the geographic distribution of Spoladea recurvalis. It features two main groups, labeled as Haplotype Group A and Haplotype Group B. Group A is shown at the top with a large central circle divided into segments representing different regions: North America, Europe, Africa, Asia, South East Asia, Australia and Oceania. Each segment is color-coded according to the key on the left. Numbers within the segments indicate the number of individuals with that haplotype. Smaller circles connected to the central circle represent specific locations, such as Hawaii and Fiji. Group B is depicted at the bottom with two main circles, one larger and one smaller, representing Tahiti and Marquesas. The numbers in parentheses next to the circles indicate the total number of individuals when additional barcodes were added. Black dots along the connecting lines represent inferred intermediate haplotypes not sampled. Spoladea mimetica is shown as a separate circle connected to Group B, indicating a minimum of 12 nucleotide substitutions separating it from Group A and 10 from Group B.
Genetic diversity indices and results of neutrality tests on the trimmed dataset (Groups A and B combined), and the two separate groups, are shown in table 2. Also included in table 2 are results of the Group B dataset augmented with 60 barcodes from Australia (Group B + 60). Both haplotype diversity (h) and nucleotide diversity (π) in the combined dataset rank in the high range (Goodall-Copestake et al., Reference Goodall-Copestake, Tarling and Murphy2012). In separate groups, however, values for both indices decrease dramatically and fall into the low range. The Group A value for Tajima’s D is significant (P < 0.01); the large negative value for Fu’s F S is also significant (P < 0.001). A large increase in sample size (n = 82) had little or no effect on results for Group B (table 2).
Genetic diversity indices and results of neutrality tests (Tajima’s D and Fu’s F S) in COI barcodes of Spoladea recurvalis

Table 2 Long description
Genetic diversity indices and neutrality test results are listed for four haplotype groups, with columns for n, k, K, h with standard deviation, nucleotide diversity with standard deviation, Tajimas D, and Fus FS. Group A plus B reports n 70, k 20, K 14, h 0.762 plus or minus 0.041, nucleotide diversity 0.00638 plus or minus 0.00053, Tajimas D minus 0.016, and Fus FS minus 0.663. Group A reports n 48, k 13, K 10, h 0.592 plus or minus 0.078, nucleotide diversity 0.00134 plus or minus 0.00034, Tajimas D minus 2.120 with an asterisk, and Fus FS minus 6.340 with an asterisk. Group B reports n 22, k 5, K 4, h 0.502 plus or minus 0.105, nucleotide diversity 0.00188 plus or minus 0.00048, Tajimas D minus 0.317, and Fus FS 0.583. Group B plus 60 reports n 82, k 5, K 4, h 0.410 plus or minus 0.051, nucleotide diversity 0.00136 plus or minus 0.00019, Tajimas D minus 0.273, and Fus FS 0.927. Across rows, k and K are highest for Group A plus B, while Group B and Group B plus 60 share the same k and K but differ in n, h, nucleotide diversity, Tajimas D, and Fus FS.
* Significant values for Tajima’s D and Fu’s F S are shown in bold type; n, number of sequences; k, number of variable sites; K, number of haplotypes; h, haplotype diversity; π, nucleotide diversity.
Three diagnostic nucleotide transition substitutions are present in Group B barcodes (n = 82) at nucleotide sites 229 (A), 401 (C), and 616 (T) that separate that Group from Group A barcodes (n = 48). Group identity at several localities shown on fig. 3 was assigned from shorter barcodes (<611 bp; see table 1) based on the presence of two or three of the diagnostic barcode nucleotides for that group. The shorter barcodes in Group A were found in Bangladesh (n = 3), Manitoba, Canada, and Martinique; those in Group B were from Western Australia, Cocos [Keeling] Islands, Vietnam, and Kerala in south-west India.
In Southeast Asia, both haplotype groups are present, although sample sizes are low. The Philippines (n = 2) showed Group A, Thailand (n = 1) possessed Group B, and the sample from Vietnam (n = 6) showed both groups (table 1). Importantly, the two haplotype groups occurred sympatrically in the Ha Tinh region of northern Vietnam (table 1). Given the evidence for Group B haplotypes in Southeast Asia, 34 additional BOLD barcodes from China were screened for diagnostic group nucleotide sites. Of these, 32 additional barcodes were found to correspond to Group A in agreement with the 2 Group A barcodes from China shown in table 1. The barcode region of the complete mitochondrial genome of S. recurvalis from Sichuan, China (He et al., Reference He, Zou, Zhang, Ma, Zhang and Yue2015) was also examined and found to possess the three diagnostic nucleotides of Group A. One barcode of Group B (QMA1681-13), however, occurred in southeast China in Yunnan Province near the Laos border. Of the approximately 180 full-length barcodes analysed or screened here, all but 1 showed the three diagnostic nucleotide sites that placed them either in haplotype Group A or Group B. BOLD sequence CNPYA164-10 from Sichuan province in China, however, showed two sites characteristic of Group B and one site (site 616) characteristic of Group A, suggesting the possibility of mitochondrial introgression resulting from hybridisation between individuals from each group, or possible nucleotide reading errors that are a times encountered in BOLD output files (Pfeiler et al., Reference Pfeiler, Nazario-Yepiz, Pérez-Gálvez, Chávezmora, Laclette, Rendón-Salinas and Markow2017).
Discussion
Population genetics
Genetic analysis of a representative global sample of barcodes in S. recurvalis (except for South America) has revealed the presence of geographic partitioning and population structure. Of the two distinct haplotype groups found, Group A is the most widespread and thus far the only group found in North America, Africa, Europe, and Asia (except for a single record for Group B in southernmost India), but it is apparently absent in Australia where only Group B has been documented. In Southeast Asia, however, both haplotype groups are present. Currently, no public barcodes for South American specimens are available in BOLD. Also, the BOLD barcode distribution map for S. recurvalis, which includes private sequences, only shows three records for South America, two in Peru and one on the northern coast. Therefore, although S. recurvalis is widely distributed in South America (iNaturalist, 2026), the haplotype group(s) remains uncertain. However, the single barcodes from Costa Rica and Martinique, the closest populations to South America analysed here, resolved in Group A (fig. 3; table 1). Seventeen additional public BOLD barcodes screened from Costa Rica also showed the three diagnostic nucleotide sites of Group A suggesting that this group should also occur in South America. However, even if Group B haplotypes appeared in South America it would not change the conclusion that there is significant divergence between the two groups.
The results of genetic analyses suggest differences in the demographic history of haplotype Groups A and B. The significant values for Tajima’s D and Fu’s F S are consistent with a population expansion in Group A, whereas non-significant neutrality values in Group B suggest a stable population size. However, the factors that have contributed to geographic partitioning and apparent differences in demographic history in the two groups are unclear. One possibility is that a selective sweep owing to a parasitic Wolbachia infection is responsible for the complete absence of Group A haplotypes in Australia. A Wolbachia-driven selective sweep might also explain the decreased genetic diversity in haplotype Group B compared with Group A (table 2), an effect seen in other insect studies (Jiggins, Reference Jiggins2003: Deng et al., Reference Deng, Chauhan, Futahashi, Galimberti, Hansson, B, Takahashi, Svensson and Duplouy2021; Katlav et al., Reference Katlav, Nguyen, Chhagan, Jamieson, Robertson, Cheesman, Learmonth, Trębicki, Cook and Riegler2024). Thus, future genetic research on S. recurvalis should specifically screen for Wolbachia infection.
Given that S. recurvalis is polyphagous, and known hosts are available worldwide, it is unlikely that changes in host plant preference resulted in population divergence. Differences in dispersal capability, however, is a possibility. The seasonal appearance of large numbers of S. recurvalis in temperate regions suggests strong migratory ability from tropical and subtropical areas (Shirai, Reference Shirai2006; Senthilkumar and Srinivasan, Reference Senthilkumar and Srinivasan2019). Migratory behaviour, however, has been little studied and the possible contribution of wind-assisted dispersal and human activity is unknown. Interestingly, this moth has also been found on isolated small islands worldwide. In our study of the butterfly fauna on the volcanic Isla Socorro (132 km2) in the eastern Pacific Ocean (Pfeiler et al., Reference Pfeiler, Barba-Acuña, Hernández-Cervantes and Markow2021), a single individual of S. recurvalis was found but not reported or barcoded (see fig. 3 for location). The species is also recorded for Aldabra Atoll, Seychelles (area 155 km2) and Cocos (Keeling) Islands (area 14 km2) in the Indian Ocean, and Lord Howe Island (15 km2) and Norfolk Island (35 km2) – northwest of Lord Howe Island – in the western Pacific Ocean (fig. 3) (Turner, Reference Turner1917; iNaturalist, 2026).
Taxonomic considerations
Although haplotype Groups A and B are morphologically indistinguishable (1A, B), differences in geographic distribution and population genetic analyses suggest that Group B might warrant recognition as a distinct cryptic subspecies of S. recurvalis. The mean pairwise divergence of barcodes between Groups A and B of S. recurvalis (d = 1.3%) is consistent with divergence values seen at the subspecies level in other phenotypically similar species of Lepidoptera (Silva-Brandão et al., Reference Silva-Brandão, Almeida, Moraes and Cônsoli2013; Pfeiler et al., Reference Pfeiler, Nazario-Yepiz, Hernández-Cervantes and Markow2020; Zhang et al., Reference Zhang, Cong, Shen, Song, Gott, Boyer, Guppy, Kohler, Lamas, Opler and Grishin2022). No differences in wing maculation, however, are apparent between the two haplotype groups. Given the similarity of male genitalia between S. recurvalis and the phenotypically distinct S. mimetica (Munroe, Reference Munroe1974), it is also unlikely that diagnostic difference would be found in male genitalia among the two groups of S. recurvalis. Thus, the difference in nucleotide composition of COI barcodes currently represents the only diagnostic feature separating them. Further research addressing the ecology and life history of the Australian Group B population, in addition to additional genetic data utilising nuclear markers, will be required before a subspecies designation is proposed. Currently, only two studies utilising nuclear sequences for S. recurvalis have appeared, and both of these analysed samples from regions were Group A was either expected (Taiwan; Chang and Ramasamy, Reference Chang and Ramasamy2018) or confirmed (Morocco; table 1; Mally et al., Reference Mally, Hayden, Neinhuis, Jordal and Nuss2019).
Any future studies on the taxonomic status of haplotype Group B will also need to address the original type locality (‘habitat’) of S. recurvalis, ‘India orientali’ (Fabricius, Reference Fabricius1775). Based on the original description, the type locality was recently reported as India (Kaleka and Hassan, Reference Kaleka and Hassan2022), but the validity of this assignment is uncertain and may be impossible to confirm.
Ambiguities and errors in localities are found in the species’ descriptions in the early taxonomic works of Fabricius (Reference Fabricius1775), as described in detail by Zilli and Grishin (Reference Zilli and Grishin2019). For example, Fabricius (Reference Fabricius1775, p, 452) described Marpesia chiron (Lepidoptera: Nymphalidae) from India, but this species occurs only in the New World. For S. recurvalis, a further conundrum is that only a single barcode from southern India was available, and it resolved in haplotype Group B, although Group A (n = 3) occurs in Bangladesh (i.e. the eastern region of India at the time of Fabricius) (table 1). The global distribution of S. recurvalis, coupled with a lack of an unambiguous original type locality, suggests that the identity of the haplotype group that Fabricius described could have been either Group A or B. Given these uncertainties, the most parsimonious view considered here is that Fabricius most probably described a specimen of the most widespread Group A of S. recurvalis.
Acknowledgements
No generative artificial intelligence (AI) was used in the preparation of this manuscript.
Competing interests
The author declares none.