Introduction
Sex differences in social dominance (or related concepts like assertiveness) have been well documented (Feingold, Reference Feingold1994; Mazur & Booth, Reference Mazur and Booth1998; Luxen, Reference Luxen2005) and it has been suggested that testosterone (T) may play a role in the aetiology of inter- and intra-sexual differences in social dominance. Serum levels of T are related to dominance in animals (Mazur & Booth, Reference Mazur and Booth1998); however, in humans, the situation is less clear-cut.
Although research has shown that T may predict a variety of behaviours related to dominance (Dabbs & Hargrove, Reference Dabbs and Hargrove1997), few studies have directly examined the relationship between T and dominance as a personality trait. Boys perceived as socially dominant have been found to have higher levels of T than boys perceived as less socially dominant (Schaal et al., Reference Schaal, Tremblay, Soussignan and Susman1996). Sellers et al. (Reference Sellers, Mehl and Josephs2007) have found modest associations between dominance and T in a small group of undergraduate students without reporting different estimates for boys and girls. Udry & Talbert (Reference Udry and Talbert1988) have found that, out of 300 possible adjectives, young women with higher T levels selected ten adjectives including ‘dominant’ more frequently than women with lower T levels. Similarly, Baucom et al. (Reference Baucom, Besch and Callahan1985) found that females with higher T concentrations perceived themselves as self-directed and action-oriented. Despite these findings, existing evidence on the relationship between dominance and testosterone is limited and several issues have been underexplored.
First, few studies have controlled for the possibility that physical differences that may be related to hormones, like differences in stature and/or weight or pubertal development (e.g. more masculine appearance), may allow for greater dominance display, especially among adolescents, but may not cause such behaviour sensu strictu. Drigotas and Udry (Reference Drigotas and Udry1993) found that T, as such, was a marker of a general growth trajectory related to behaviour (including dominance) without being directly involved in its aetiology.
Second, the relationship between testosterone and dominance may depend on characteristics of the adolescent's peer group. Particularly in adolescence, the peer group plays an important role in shaping the individual's behaviour (Harris, Reference Harris1995; Capaldi et al., Reference Capaldi, Dishion, Stoolmiller and Yoerger2001; Vitaro et al., Reference Vitaro, Brendgen and Tremblay2000; Espelage et al., Reference Espelage, Holt and Henkel2003). On the one hand, peers tend to affiliate based on similar characteristics like sex and ethnicity (Cairns & Cairns, Reference Cairns and Cairns1994), attitudes and behaviours while, on the other hand, because of reciprocal socialization, members of a peer group become more alike (Henry et al., Reference Henry, Guerra, Huesmann, Tolan, Vanacker and Eron2000; Espelage et al., Reference Espelage, Holt and Henkel2003). Sex differences in preferences for peer relationship are well documented. Girls prefer more close and intimate relationships with friends than boys (Williams, Reference Williams1985; Shulman et al., Reference Shulman, Laursen, Kalman and Karpovsky1997) while the assertion of ‘autonomy’ is more compatible to boys than to girls' interpersonal relationship (Chodorow, Reference Chodorow1978; Rosenfield et al., Reference Rosenfield, Vertefuille and McAlpine2000; Van Gundy, Reference Van Gundy2002). As such, dominance behaviour may be differently valued among girls' same-sex peers than among boys' same-sex peers. Interestingly, in a sample of co-residential college women, Cashden (Reference Cashdan1995) found an association between T and assertiveness. However, the association between T and ‘popularity with women’ as judged by their female peers was negative, while no association between T and ‘popularity with men’ (again as judged by their female peers) was found. This may indicate that girls' dominance-related behaviours are more strongly disliked by girls than by boys. As such, if girls and boys adapt their behaviour to norms prevailing in the peer group, the relationship between T and dominance may be altered depending on the gender context of the peer group.
Third, another aspect that may be relevant in explaining social dominance in adolescence is the concept of ‘gender ideology’. It is argued that with the onset of puberty, boys and girls experience an intensification of gender-related expectations (Hill & Lynch, Reference Hill, Lynch, Brooks-Gunn and Petersen1983) and they begin to act in ways that resemble the stereotypical female or male of their culture (Huston & Alvarez, Reference Huston, Alvarez, Montemayor, Adams and Gullota1990; Jackson & Tein, Reference Jackson and Tein1998). Traditional ideals of masculinity emphasize status, toughness and anti-femininity (i.e. that men should not adopt traditional feminine qualities and behaviours) (Thompson & Pleck, Reference Thompson and Pleck1986), while traditional ideals of femininity include ‘being attractive and thin’, a focus on ‘nurturance’ and being ‘domestic’ (Mahalik et al., Reference Mahalik, Morray, Coonerty-Femiano, Ludlow, Slattery and Smiler2005). It has been shown that a more traditional ideal of masculinity is related to risk-taking behaviour (Pleck et al., Reference Pleck, Sonenstein and Ku1994; O'Neil et al., Reference O'Neil, Good, Holmes, Levant and Pollack1995), relationship violence (Jakupcak et al., Reference Jakupcak, Lisak and Roemer2002) and sexual aggression (Gale, 1996), while traditional femininity is associated with eating disorders (Mahalik et al., Reference Mahalik, Morray, Coonerty-Femiano, Ludlow, Slattery and Smiler2005). No studies exist on traditional masculine and feminine ideology and dominance; however, it can be hypothesized that masculine ideology is positively associated with dominance in boys while traditional feminine ideology may be negatively associated with dominance in girls. Although the evidence that hormonal changes at puberty are directly associated with ‘gender intensification’ is limited (Galambos et al., Reference Galambos, Almeida and Petersen1990), traditional ideals of masculinity/femininity may moderate the relationship between hormones and behaviour.
Summarizing, this study will (i) analyse the relationship between T and dominance controlling for pubertal development, stature and weight in a sample of adolescent boys and girls and (ii) analyse if and how gender ideology and peer group orientation moderate this relationship.
Data and Methods
Sample
The target group of this study was a population of third-grade students (14 to 15 years old) selected within an educational setting in Belgium (Vermeersch et al., Reference Vermeersch, T'Sjoen, Kaufman and Vincke2008a, Reference Vermeersch, T'Sjoen, Kaufman and Vincke2008b). In exchange for their participation, students were given an incentive. The Ethical Committee of the University Hospital of Ghent approved informed consent letters (for parents and for students) and privacy guarantees. Seventy-one per cent of the eligible students participated, making up a total sample of 599 third-grade adolescents: 301 boys and 298 girls. The distribution of the girls in the sample across the different tracks of the Flemish educational system was relatively well balanced compared with the distribution of the general third-grade population. More information on the sample is available in Vermeersch et al. (Reference Vermeersch, T'Sjoen, Kaufman and Vincke2008a) and Vermeersch et al. (Reference Vermeersch, T'Sjoen, Kaufman and Vincke2008b). Girls using oral contraception (n=19) were, in accordance with Harris (Reference Harris1999), excluded from all analyses.
Measurements
Testosterone
Serum samples were collected between 9 am and 12 noon. Commercial immuno-assays were used to determine the serum concentrations of T (Orion Diagnostica, Espoo, Finland), SHBG (sex hormone-binding globulin) (Orion Diagnostica, Espoo, Finland). The assay sensitivity for T was 10 ng/dl; the intra-assay coefficient of variation (CV) fell between 4.6% and 10.1% and the inter-assay CV between 5.2% and 11.7%. The sensitivity for SHBG was 0.7 nmol/l; the intra-assay CV fell between 2.6% and 8.5% and the inter-assay CV between 3.4% and 9.6%. This paper will report on the relationship between dominance and free testosterone (FT). Free testosterone was calculated from total hormone levels, SHBG and albumin concentrations by means of validated equations derived from the mass action law (Vermeulen et al., Reference Vermeulen, Verdonck and Kaufman1999). Free testosterone was used in the analyses, rather than total testosterone, as testosterone bound to SHBG is thought to be biologically inactive.
Orientation on same-sex peer groups
Same- or other-sex peer group orientation was measured by three items: ‘I have more friends of the other sex than friends of my own sex’, ‘I feel more at ease with friends of the other sex than friends of my own sex’ and ‘I can talk better about my interests with my friends from the other sex than with friends from my own sex’. Cronbach's alpha was 0.70 with Corrected Item-Total correlations varying between 0.47 and 0.58. High scores on this scale indicate having primarily same-sex friends and being oriented on same-sex peers.
Traditional masculine ideology
To measure masculine ideology in boys, seven items were used to be rated on a 5 point-scale. Items included aspects of ‘status’ and ‘autonomy’ (e.g. ‘A man should avoid being dependent on others’), ‘toughness’ (e.g. ‘A real man doesn't give in, he fights back’) and ‘anti-femininity’ (e.g. ‘There is definitely something wrong with a boy practising ballet as a hobby’) central to traditional masculinity ideology. Cronbach's alpha was 0.77 with Corrected Item-Total correlations varying between 0.42 and 0.58.
Traditional feminine ideology
To measure feminine ideology in girls, eight items were used to be rated on a 5-point scale. Items included aspects such as ‘being attractive and thin’ (e.g. ‘It's only natural that girls spend more attention to their looks than boys’), a focus on ‘nurturance’ (e.g. ‘Kids are the main responsibility for women’) and being ‘domestic’ (e.g. ‘It is in the best interest for everyone if women do the housekeeping’). Cronbach's alpha was 0.70 with Corrected Item-Total correlations varying between 0.28 and 0.50.
Pubertal development (PD)
Pubertal development was measured by Tanner stage (Tanner, Reference Münster, Schmidt and Helm1962), assessed by a physician. Two scores reflected, respectively, primary and secondary sex characteristics on a scale of 1 (prepubertal) to 5 (adult). Scores were added, resulting in an index from 2 to 10.
Menstrual cycle-related controls
Menstrual cycle phase was controlled for by adding five dummy variables. These dummies compared girls at day 1 up to day 8 of the menstrual cycle (reference category; n=48), whose hormonal levels presumably reflect those of the early follicular phase, respectively, with (i) girls at day 9 up to day 21 who presumably have increased T levels characteristic of the late follicular and early luteal phase (n=92), (ii) girls at day 22 up to day 35, whose hormonal levels more typically reflect those of the mid to late luteal phase (n=55), (iii) premenarcheal girls (n=26), (iv) girls experiencing the condition of oligomenorrhoea (n=26) (Münster et al., Reference Münster, Schmidt and Helm1992), i.e. girls who have not started menses during the last 35 days, (v) girls who failed to report the start of their menses (n=32). More information and hormonal comparisons of these different groups can be found in Vermeersch et al. (Reference Vermeersch, T'Sjoen, Kaufman and Vincke2008b).
Dominance
To measure dominance, respondents were asked to complete the California Psychological Inventory-Dominance scale (CPI-D). The CPI-D consists of eleven items to be rated on a 5-point scale and was developed and validated by Gough & Bradley (Reference Gough and Bradley1996). Items included: ‘I try to surpass others' accomplishments’, ‘I want to control the conversation’, ‘I put people under pressure’. Cronbach's alpha for this scale was 0.83 while Corrected Item-Total correlations varied between 0.38 and 0.61. The sum of the item scores was used.
Age, stature and weight
Age was measured as ‘years completed at the time of the research’; stature and weight were measured by a trained nurse using the calibrated equipment.
Analyses
Bivariate associations and OLS regressions were used to analyse the data. To avoid high multicollinearity, independent variables were standardized before product terms were calculated. All analyses were performed in SPSS 15.0. Several respondents had missing values on one or more variables: respectively 12, 10 and 5 girls had a missing value for FT, pubertal development and feminine ideology; with respect to boys, missing values were present on dominance (n=3), pubertal development (n=11), peer group orientation (n=2) and masculine ideology (n=4). As several boys and girls had missing values on more than one variable, all multivariate analyses included 285 boys and 254 girls.
Results
Sample characteristics
Hormonal profiles of boys and girls have been discussed more profoundly in Vermeersch et al. (Reference Vermeersch, T'Sjoen, Kaufman and Vincke2008a, Reference Vermeersch, T'Sjoen, Kaufman and Vincke2008b). Boys were on average 14.4 years old (SD=0.74) and had an average PD score of 8.4 (SD=1.91); girls were on average 14.2 years old (SD=0.55) and had an average PD score of 9.1 (SD=1.12). An ANOVA analysis showed that boys have significantly higher levels of dominance (F=61.59, p<0.001). No sex difference in same-sex peer group orientation was found.
Bivariate associations
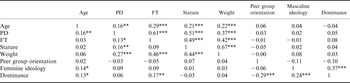
In boys, dominance was unrelated to any of the hormonal or control variables. Free testosterone was related to age (r=0.29, p<0.001), PD (r=0.61, p<0.001), height (r=0.49, p<0.001) and weight (r=0.42, p<0.001). Masculine ideology was related to dominance (r=0.37; p<0.001).
In girls, dominance was related to age (r=0.13, p<0.027) and FT (r=0.17, p<0.007). Free testosterone was related to PD (r=0.13, p<0.050) and weight (r=0.46, p<0.001). Dominance was related to same-sex peer group orientation (r=−0.29; p<0.001) and feminine ideology (r=0.24; p<0.001).
Multivariate associations
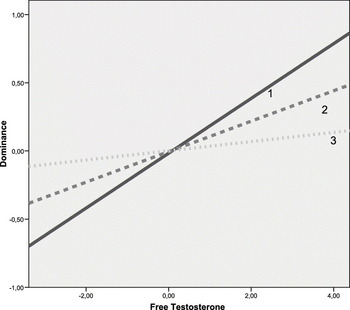
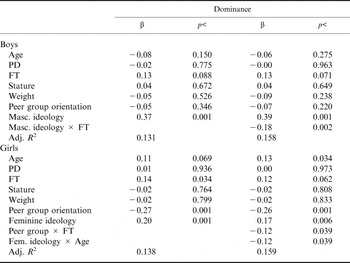
In boys, no direct association between FT and dominance was found. Masculine ideology was positively associated with dominance (β=0.37; p<0.001). The interaction between FT and masculine ideology was significant (β=−0.18; p<0.002) (visualized in Fig. 1) indicating that the effect of FT was significantly stronger in boys with low masculine ideology. No other interaction effects were found.
Relationship between free testosterone and dominance for boys with low (1) (R 2=0.04), medium (2) (R 2=0.01) and high (3) (R 2=0.00) traditional masculine ideology, controlling for all other variables.

In girls, after controlling for age, PD, weight and length, FT remained significantly associated with dominance (β=0.14, p<0.034). Feminine ideology was positively associated with dominance (β=0.20; p<0.001); however, an interaction effect (Feminine ideology × Age: β=−0.12; p<0.039) was found indicating that this relationship decreased with age. In addition, same-sex peer group orientation was associated with dominance (β=−0.27; p<0.001) indicating that girls who tend to have boys as friends are more dominant than other girls.
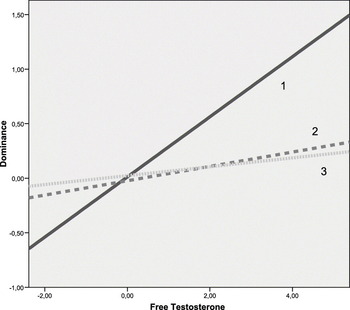
The interaction between FT and same-sex peer group orientation (Peer group orientation × FT: β=−0.12; p<0.039) indicated (Fig. 2) that the relationship between FT and dominance was particularly strong in girls less oriented to same-sex peers.
Relationship between free testosterone and dominance in girls with low (1) (R 2=0.08), medium (2) (R 2=0.01) and high same-sex (3) (R 2=0.00) peer group orientation, controlling for all other variables.

Hormonal cycle-related controls (not in tables) did not affect this relationship and none of the control variables was associated with dominance.
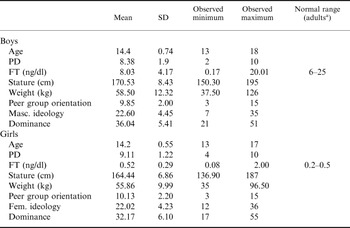
Characteristics of the sample of boys (N=301) and girls (N=279): mean, standard deviation, observed minimum and maximum and normal adult range for all variables

a Reference values from commercial immune-assay kits.
PD: pubertal development; FT: free testosterone.
Bivariate associations between independent and dependent variables

Boys: above diagonal; girls: under diagonal.
PD: pubertal development; FT: free testosterone.
* p<0.05,
** p<0.01,
*** p<0.001.
Results of multivariate OLS regression, all independent variables (Step 1), and interaction-effects (Step 2)

PD: pubertal development; FT: free testosterone.
Discussion and Conclusion
This study analysed, in a large sample of adolescent boys and girls, whether (i) free testosterone is related to dominance, controlling for age, pubertal development, stature and weight and (ii) if this relationship is moderated by gender ideology and same-sex peer group orientation.
In multivariate models, a direct association between FT and dominance was found in girls but not in boys. In addition, evidence was found indicating that gender ideology in boys and same-sex peer group orientation in girls moderated the relationship between FT and dominance.
With respect to boys, traditional masculine ideology was, as expected, strongly and positively related to dominance. Adherence to cultural ideals of masculinity may help to explain dominance behaviour and risk-taking (Pleck et al., Reference Pleck, Sonenstein and Ku1994; O'Neil et al., Reference O'Neil, Good, Holmes, Levant and Pollack1995) during adolescence. Masculine ideology, while in itself not related to T, moderated the relationship between T and dominance: T was more important in explaining dominance in boys with less traditional masculine ideology. If adolescence is a period of ‘gender intensification’ (Hill & Lynch, Reference Hill, Lynch, Brooks-Gunn and Petersen1983; Huston & Alvarez, Reference Huston, Alvarez, Montemayor, Adams and Gullota1990) and adherence to masculine ideals as ‘toughness’ may increase dominance, the underlying relationship between T and behaviour may be camouflaged. As such, this finding is an example of Raine's (Reference Raine2002) ‘social push hypothesis’: the effect of biological variables on outcomes may be obscured when psychosocial factors are present that ‘push’ individuals to the same behavioural outcome.
In girls, same-sex peer group orientation was negatively associated with dominance: girls who had more boys as peers and were more oriented to boys as peers were more dominant than other girls. Peer groups are formed based on similar attitudes and behaviours (Espelage et al., Reference Espelage, Holt and Henkel2003). If dominance-related behaviours are inconsistent with girls' preference for more close and intimate relationships (Williams, Reference Williams1985; Shulman et al., Reference Shulman, Laursen, Kalman and Karpovsky1997), dominance may be trait on which peer group selection is based. In addition, the interaction between T and same-sex peer group orientation in girls may indicate that if members of a peer group become more alike because of reciprocal socialization (Henry et al., Reference Henry, Guerra, Huesmann, Tolan, Vanacker and Eron2000; Espelage et al., Reference Espelage, Holt and Henkel2003) and dominance is more discouraged in girls' same-sex peer relationships, the relationship between T and dominance may have decreased in girls who tend to be more oriented on same-sex peer groups compared with girls who tend to affiliate with boys as peers.
The analyses presented confirm the results of earlier studies on a relationship between T and dominance (Baucom et al., Reference Baucom, Besch and Callahan1985; Udry & Talbert, Reference Udry and Talbert1988; Cashden, Reference Cashdan1995). They go beyond these studies by documenting how psychosocial variables may moderate the relationship between hormones and dominance, like earlier studies did with other forms of behaviour (Udry, Reference Udry1988; Rowe et al., Reference Rowe, Maughan, Worthman, Costello and Angold2004; Booth et al., Reference Booth, Johnson, Granger, Crouter and McHale2003; Updegraff et al., Reference Updegraff, Booth and Thayer2006; Vermeersch et al., Reference Vermeersch, T'Sjoen, Kaufman and Vincke2008a, Reference Vermeersch, T'Sjoen, Kaufman and Vincke2008b).
Some issues, however, require further research. In girls, unexpectedly, traditional feminine ideology was positively associated with dominance. The strong changes in women's position in society over the last decades, following the increase in women's employment, may have affected stereotypical gender roles that adolescents have been exposed to (Paulson et al., Reference Paulson, Komin and Hill1990; Richards & Duckett, Reference Richards and Duckett1994) and may have resulted in more diverse cultural injunctions that define ideal femininity today (Mahalik et al., Reference Mahalik, Morray, Coonerty-Femiano, Ludlow, Slattery and Smiler2005). In this study ‘feminine ideology’ was measured in a global way and it was not possible to differentiate among these diverse and possibly conflicting cultural ideals. While the interaction between feminine ideology and age indicated that the positive effect of feminine ideology on dominance was less expressed in older girls, further research should measure feminine ideology less as a global construct and should assess the salience of different feminine norms for individual girls when analysing its moderating role with respect to hormonal or other biological characteristics and behaviour.
While the results are controlled for potentially confounding factors like pubertal development, stature, weight and menstrual cycle-related hormonal variability, some aspects of this study design limit the scope of its conclusions. First, this study is cross-sectional and not longitudinal. The relationship between hormones and dominance is complex and may be more dynamic (Mazur & Booth, Reference Mazur and Booth1998). Second, only one single-point measure of T was used: given the hormonal fluctuations due to the menstrual cycle, a single-point measure may be a relatively poor measure of T. While adding menstrual cycle-related controls in the analyses did not affect the results substantially, menstrual cycle-related hormonal variability may have increased the error in the models and as such weakened the strength of the effects. Third, the measures of dominance and same-sex peer group orientation were obtained by self-report scales; future studies could benefit from trying to include data on peer ratings of dominance and adolescent's actual involvement in social networks – and attitudes prevailing in such networks – in analysing the role of peer groups with respect to the relationship between testosterone and dominance.
In summary, the relationship between testosterone and dominance was analysed in a sample of adolescent boys and girls. In boys, evidence was found that this relationship is moderated by masculine ideology, and in girls by same-sex peer group orientation. More research is needed to study the more dynamic relationship between hormones, behaviour and characteristics of the social environment.