Introduction
The problem of poverty amongst working families has been receiving increasing attention in the UK in recent years. In December 2013, a report published by the Joseph Rowntree Foundation found that, ‘for the first time on record, the majority of people in poverty are in working families’ (MacInnes et al., Reference MacInnes, Aldridge, Bushe, Kenway and Tinson2013: 26). Working families have accounted for a growing share of people in poverty over the past 15 years (ibid), and a recent study finds that as many as six in ten people in poverty in the UK were living in working households in 2014–15 (Hick and Lanau, Reference Hick and Lanau2017).
Despite the growing concern with in-work poverty, it remains a relatively under-examined topic – certainly, at least, in comparison with the voluminous literature on low pay, with which in-work poverty is often conflated. Of the literature on in-work poverty that does exist, there is high reliance on cross-sectional studies and, by contrast, we know relatively little about the experience of in-work poverty over time. This paper aims to contribute to, and to extend, the sparse literature on the longitudinal analysis of in-work poverty (e.g. Gutiérrez et al., Reference Gutiérrez, Ibáñez, Tejero, Fraser, Gutiérrez and Peña-Casas2011; ONS, 2015; Grzegorzewska and Thévenot, Reference Grzegorzewska and Thévenot2014) by examining the transitions, trajectories and trigger events associated with entries to and exits from working poverty in the UK.
In doing so, our study analyses the extent to which key findings from the existing literature on longitudinal poverty more broadly (or what we label ‘total’ poverty) are observed when one is focussing on poverty amongst working households only. At the same time, while we seek to compare in-work and ‘total’ poverty, a study of in-work poverty over time must engage with the more complex trajectories that people can experience in the case of in-work poverty. In particular, households may exit working poverty by leaving poverty or by leaving work (or both, a rarer case that we do not explore in detail in this paper).
Examining in-work poverty transitions, and their inherent complexity, matters for at least two reasons. First, it provides us with a better understanding of the nature of in-work poverty itself. There are multiple trajectories that people can and do take from in-work poverty, and this requires us to acknowledge at the outset that not all working poverty exits are equal. On the contrary, policy will need to maximise the ‘good’ trajectories (exiting poverty) while minimising the ‘bad’ ones (exiting work). To do this, we first need to understand the nature and extent of these different trajectories. Secondly, as in-work poverty is a growing problem, understanding the ways that people do, in fact, move in and out of in-work poverty can help to identify policy solutions that can successfully reduce poverty amongst working households.
The paper is comprised of four sections. In the next section, we outline some of the key findings from the literature in this field, while at the same time pointing to questions that have yet to be adequately addressed. Subsequently, we detail the data and methodological approach employed in this paper. Following this, we present our analysis in four sub-sections – which focus on the probability of in-work poverty transitions; the different kinds of transition that people can experience when entering and exiting in-work poverty; the triggers that help to explain entries to and exits from in-work poverty, and the determinants of working poverty transitions. The conclusion summarises the key messages.
Lessons from previous research and the contribution of this study
Arguably the central finding from the longitudinal analysis of poverty is that there is a significant degree of movement in-and-out of poverty (see Jenkins, Reference Jenkins2011, inter alia). Indeed, Vaalavuo (Reference Vaalavuo2015) shows that poverty in the UK is more transitory than in most other European countries. The existing literature on the longitudinal experience of in-work poverty, too, has pointed to the extent of mobility to and from working poverty (Gutiérrez et al., Reference Gutiérrez, Ibáñez, Tejero, Fraser, Gutiérrez and Peña-Casas2011). However, without like-for-like estimates, we get little sense from this literature of how – if at all – working poverty differs from poverty amongst working-age adults more generally (or what in this paper we call ‘total’ poverty). A starting point for this paper, then, is to ask: is mobility in relation to in-work poverty greater or less than total poverty? Moreover, we move beyond a focus on average transitions to examine how in-work poverty transitions vary for selected groups.
The study of in-work poverty over time, we have noted, also requires us to negotiate the more complex transitions that people can and do experience: a person experiencing in-work poverty may ‘exit’ by ceasing to be poor, ceasing to work, or both. This is not unlike the multiple possible trajectories that can be taken by a low-paid worker, who can exit low pay by increasing their pay or by exiting the labour market altogether (see Marx and Nolan, 2000: 115 for a discussion). Thus, it is crucial to understand the likelihood of these pathways and who experiences them. In comparative analyses of in-work poverty in UK, Spain, France and Poland, Gutiérrez et al. (Reference Gutiérrez, Ibáñez, Tejero, Fraser, Gutiérrez and Peña-Casas2011: 186–191) find that the working poor were much more likely to remain in work (whether experiencing poverty or not) than to exit work in the subsequent year. However, their analysis considers only the multiple destinations that the working poor can take; they do not consider the multiple origins for those who enter working poverty. We extend this analysis here by presenting a matrix examining all possible origins and destinations in terms of in-work poverty status.
Moreover, we need to know how people do, in fact, move in and out of in-work poverty. Within the wider poverty literature, studies typically focus on ‘trigger’ events that co-occur with transitions in and out of poverty, often drawing on a framework proposed by Jenkins (Reference Jenkins2011). These trigger events are typically divided into two or more broad categories such as labour market events (e.g. changing number of workers, hours of work, or pay), demographic events (e.g. changes in household size and composition) and non-labour market income events (e.g. changes in social security receipt) (see Davies and Lloyd-Williams, 2014).
Existing research using this framework typically identifies labour market triggers as explaining a majority share of poverty transitions (e.g. Polin and Raitano, Reference Polin and Raitano2014; Layte and Whelan, Reference Layte and Whelan2003; Fouarge and Layte, Reference Fouarge and Layte2005). Research by the Office for National Statistics (2015) has partially applied this framework to the study of in-work poverty, and finds that positive employment events, such as securing a pay increase by moving jobs, or the household gaining a worker, are associated with an 80 per cent probability of exiting in-work poverty from one year to the next. However, the more complex transitions that arise when looking at working poverty are not considered, and the application does not examine in-work poverty entries at all. What is required in this area is an analysis that both focusses on in-work poverty specifically, but which also considers the ways that these triggers interact with the more complex transitions that occur in the case of in-work poverty.
In seeking to understand how past labour market participation influences in-work poverty, Halleröd et al. (Reference Halleröd, Ekbrand and Bengtsson2015) adopt a different approach, focusing not on in-work poverty transitions but on how past employment trajectories are related to one's current in-work poverty status by constructing 36-month employment profiles, using the rotating panel element of the EU-SILC. They analyse these profiles for 22 European countries, and find that those who are consistently employed face a very low risk of in-work poverty. They conclude that ‘in-work poverty is mainly an unemployment problem, not a low-wage problem’ and that ‘it is mainly the existence of a peripheral labour market that causes in-work poverty’ (Halleröd et al., Reference Halleröd, Ekbrand and Bengtsson2015: 1, 14).
Finally, the literature on in-work poverty has been substantially dominated by analysis of the relative income poverty measure (see Hick and Lanau, Reference Hick and Lanau2017, for a discussion). In this paper, we extend the analysis of in-work poverty by incorporating a measure of in-work deprivation in our analysis, as this measure can provide an alternate and, at times, divergent perspective on poverty trends (Hick, Reference Hick2015, inter alia). As we explain below, the deprivation data is not as rich as those available for income-centric analysis. Partly for this reason, rather than this analysis occupying a discrete sub-section of the paper, we describe within each section how a deprivation perspective reinforces or calls into question the findings from the income-centric analysis. Such testing matters because where the deprivation analysis corroborates the key findings from the income-centric analysis, we can have greater confidence in the validity of these findings.
This paper contributes to the sparse literature on in-work poverty transitions and extends the literature in the field in the following ways: it will (i) directly compare the probability of transitions between in-work poverty and poverty amongst working-age people more generally; (ii) move beyond an analysis of averages to explore how in-work poverty transitions vary for different groups; (iii) explore the more complex nature of in-work poverty transitions, considering all possible origins and destinations; (iv) integrate analysis of poverty triggers to these more complex, multiple destinations which arise when examining in-work poverty, and (v) draw on a deprivation perspective to assess the extent to which the findings from the income perspective are robust to the selection of another widely-recognised poverty measure. In doing so, the paper aims to enrich the evidence base on a topic of growing public concern.
Data and method
This paper presents analysis based on four waves of data from the Understanding Society survey, collected between 2010 and 2014 (waves 2–5). Understanding Society is a longitudinal survey, with a sample of about 40,000 households in its first wave. From wave 2 it incorporated some members from the previous British Household Panel Survey. Data collection takes place over overlapping two-year periods, with individuals being interviewed around the same time each year (Knies, 2015: 8). The survey is of value because it contains detailed information about income, employment and deprivation status, as well as relating to a wide range of household and personal characteristics. As such it is the primary survey of concern in the UK for those interested in longitudinal analysis.
We do not analyse data from wave 1 due to concerns about the income data. As Barnes et al. (Reference Barnes, Lord and Chanfreau2015: 25) have previously noted, reported incomes from benefits and pensions were markedly lower in wave 1 than in wave 2, with equivalent differences not observed in other surveys. They suggest that changes in how benefit and pensions income was collected from wave 2 onwards is likely to have influenced the reported amounts (Barnes et al., Reference Barnes, Lord and Chanfreau2015: 91). This poses a problem for the analysis of transitions because we do not want changes in the way income is measured to signify poverty transitions in the data which did not, in fact, occur. For this reason, we rely on data from waves 2–5 only.
The main analysis presented here is based on 52,493 cases where complete data is available (with the exception of the Markov model towards the end of the paper where, as we explain, the base sample is more restrictive). The sample size of Understanding Society acts as a major advantage over UK data from EU-SILC, which also contains a longitudinal component. We restrict attention to working-age adults living in households where all members have responded to the survey (around 77 per cent of all working-age adults). We thus exclude individuals living in households where interviews for some members have been conducted by proxy, since these proxy interviews contain no information about income source (e.g. employment income, social security income, etc.), which we utilise in our analysis.
It is widely recognised that the definitions of ‘working’ and ‘poor’ are of fundamental importance in terms of understanding in-work poverty (Horemans et al., Reference Halleröd, Ekbrand and Bengtsson2015). We define in-work poverty as a circumstance where an individual lives in a household where at least one person is currently working (at least one hour in the last week, according to the ILO definition) and where the household is also experiencing poverty. This definition of work is more encompassing than most analyses conducted at the European level, where a threshold of having worked at least seven months of the last year is typically employed (e.g. Eurofound, 2011), but it has the advantage that it serves ‘not to exclude from the outset any category of disadvantaged workers’ (Crettaz and Bonoli, Reference Crettaz, Bonoli, Fraser, Gutiérrez and Peña-Casas2011: 48). In the main analysis, the measure of poverty is selected as being where equivalised household income falls below 60 per cent of the median. Thus, our interest is in individuals who experience poverty and live in working households, and thus in-work poverty can be experienced by both workers and non-workers. This is in line with previous analyses in the UK (e.g. Tinson et al., Reference Tinson, Ayrton, Barker, Born, Aldridge and Kenway2016), but contrary to much analysis at the European level, where the focus is typically on workers only (e.g. Crettaz, Reference Crettaz2011). Given that the focus is on in-work poverty, the analysis is restricted to respondents of working age (i.e. those between 16 and 64 across waves) only.
This focus on all (working-age) individuals in the household has at least one significant advantage over the standard European approach: if we only count workers in the definition of in-work poverty, then the employment and income variables will be measured using different units of analyses, since the income variable (and thus the poverty status) considers all income sources in the household and thus, implicitly, all individuals, while the employment variable focuses on workers only. In our view, the exclusive focus on workers frustrates understanding in-work poverty as a problem requiring a ‘whole household’ solution and risks the common, if erroneous, conflation between in-work poverty and low pay (see Hick and Lanau, Reference Hick and Lanau2017, for a discussion).
Previous research has identified the extremes of the income distribution as being more susceptible to measurement error (van Kerm and Pi Alperin, Reference Van Kerm and Pi Alperin2011). To reduce measurement error, the top and bottom 1 per cent of the total income distribution and the 0.5 per cent of the main income components (i.e. earnings, working-age and child social security benefits, and pensions) have been excluded from the analyses. This results in a loss of around 2 per cent of the longitudinal sample.
Data on material deprivation are not available in each wave: specifically, such data is only available in waves 2 and 4 of those considered here and, thus, we have also constructed a reduced dataset based on waves 2 and 4 only. This second dataset is constructed primarily to analyse the deprivation data. However, to present like-for-like comparisons with the income data, we construct income measures for these waves only, too, to ensure that the messages from the deprivation analysis are not driven by the differing observation window.
Material deprivation is measured using a sum-scoring approach which reflects the enforced lack of the following items because of a lack of resources: keeping the house in a decent state of repair, being able to replace worn out furniture, replacing or repairing major electrical goods, a week's holiday away from home, content insurance and making regular savings of at least £10 a month. The index also includes items which ask whether the household can keep their accommodation warm enough in winter, and whether they are currently behind on any bills or have been in arrears with their mortgage or council tax in the previous 12 months. Households lacking four or more of these items are classified as deprived. We selected this threshold because it leads to a more similar incidence of in-work poverty and in-work deprivation than any available alternative.
The individual is selected as the unit of analysis, and this is necessary because households are not stable entities through time. The data are weighted to account for initial design effects (unequal selection probabilities), non-response and attrition. We select the longitudinal weights from the last wave to weight data prior to analyses (Knies, 2015: 61). The identification of weights in longitudinal analysis is not unproblematic. For instance, difficulties in determining longitudinal weights for new sample members and children of sample members (‘joiners’) means that these are excluded from the analysis (given a longitudinal weight of zero), even if they have complete information. Moreover, when pooling data across waves, the population of interest to which we are trying to draw inferences is not always clear (Jenkins, Reference Jenkins2011: 90). In this paper, we report the main findings based on weighted estimates, but have re-run an unweighted analysis as a sensitivity analysis (not shown here). Having done so leads us to concur with Jenkins (Reference Jenkins2011) that the use of weights does not typically alter key substantive findings.
Analysis
The analysis presented in this paper is comprised of four sections: (i) the frequency of in-work poverty transitions; (ii) the types of transitions people make [trajectories], (iii) the triggers that explain in-work poverty transitions, and (iv) the determinants of these transitions.
Transitions
We start by examining how transitions in in-work poverty compare in terms of those for ‘total’ poverty amongst working-age adults. Our focus here is on simple movements in and out of in-work poverty (that is, on any movement above or below the poverty line).Footnote 1
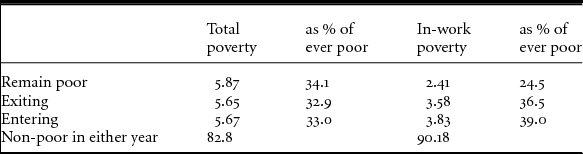
In Table 1 we present in-work poverty persistence profiles for pooled two-year periods based on total poverty (left-hand columns) and in-work poverty (right-hand columns). From this we can observe that the incidence of in-work poverty in any given year is about six per cent (this can be seen by adding those remaining in in-work poverty from one year to the next and either those exiting or entering). This estimate is marginally lower than that observed for the UK in a recent Eurofound (2017) report, which found that the UK had the 11th highest in-work poverty rate of the EU-28, using the European definition (see discussion above). In Table 1, we observe that a smaller proportion of working-age adults experience in-work poverty than total poverty (indeed, the percentages are lower in each of the ‘remaining’, ‘exiting’ and ‘entering’ categories). This is inevitable because the definition of in-work poverty requires a dual condition – i.e. to be poor, but also in a working household. Thus, by design, people experiencing in-work poverty are a sub-set of the ‘total’ experiencing poverty.
Comparison of ‘total’ poverty and in-work poverty transitions, working-age respondents

Source: USoc waves 2–5, weighted
What is more significant, we argue, is the ratio of those who enter (or exit) in-work poverty to those who remain. In the case of ‘total’ poverty, the ratio is about 1:1 – in any given year, about half of working-age people in poverty exit, and as many people enter poverty. The ratios in terms of in-work poverty are somewhat different (around 1.5: 1): more people will enter and exit working poverty from one year to another than will remain (this difference is statistically significant). These results suggest that in-work poverty is more transitory than total poverty amongst working-age adults.
If we repeat the analysis, but use material deprivation as our measure of poverty (not shown here), we find that income poverty (for both total poverty and poverty amongst working households) is more transient than material deprivation. This is likely to be because changes in incomes can occur rapidly while material deprivation data contain both stock and flow measures and may reflect accrued deprivation over time (Layte et al., Reference Layte, Whelan, Maître and Nolan2001). But, importantly, our principal finding from the income-centric analysis also holds – i.e. in-work deprivation is more transient than total deprivation.
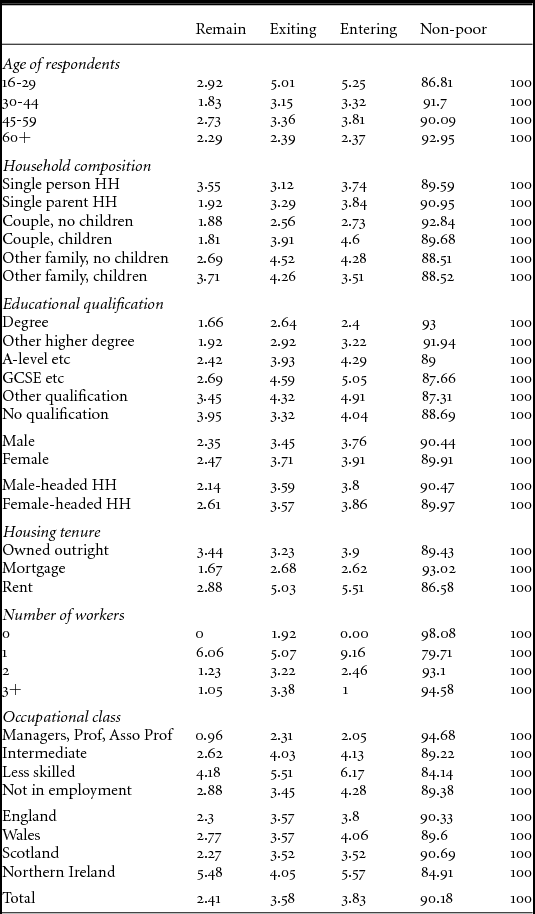
Who experiences in-work poverty transitions?
In Table 2, we present the equivalent transition probabilities for a range of population sub-groups, where the groups are defined in the second year of the two-year observation window. The group with the greatest experience of in-work poverty over a consecutive two-year period (i.e. those with any experience of in-work poverty) are households with only one worker, one-in-five of whom experienced working poverty at least once over a two-year period, more than double the average rate. This demonstrates the difficulty that one-earner families face in avoiding poverty in a society where two-earner households have increasingly become the norm. Other groups with a pronounced rate of in-work poverty over a two-year period were individuals working in low-skilled occupations, those living in Northern Ireland and, to a lesser extent, respondents living in rented accommodation, and younger people.
In-work poverty transition probabilities by sub-group

Source: USoc waves 2–5, weighted
If we then consider the relative probability of transitions (i.e. the ratio of the probability of entering and exiting vs that of remaining), it is noticeable that transitions in and out of working poverty were relatively more common for younger people. Older people, on the other hand, had a lower probability of experiencing in-work poverty but those who did experience it had a lower probability of exiting in the subsequent year. Other groups with low relative transition probabilities are households with one worker, people living alone and respondents living in Northern Ireland. These are the groups for whom, when in-work poverty occurs, it is more likely to be persistent.
Trajectories
We have noted, however, that exiting (or entering) in-work poverty is not as straightforward as in the study of poverty more broadly. This is because, as in-work poverty reflects a dual condition, exiting may be the result of leaving work or of leaving poverty. Some might argue that such complexity is not necessary, on the grounds that we are not interested in people who leave in-work poverty by exiting work. We believe, in contrast, that it is important that we understand the relative balance between these competing trajectories and that policy-makers take steps to maximise the positive trajectory (exiting poverty) and minimise the negative one (exiting work).
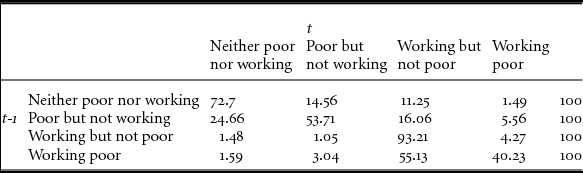
In Table 3 above, we create a four-way in-work poverty classification reflecting these potential trajectories. For people experiencing in-work poverty at time t-1, the probability that they would experience in-work poverty at time t is 0.4. However, more than half were still in-work but no longer poor at time t, with the remaining 4.5 per cent no longer living in a working household. People who experience in-work poverty are thus more likely, in the subsequent year, to exit than to remain, and the vast majority of households who exit in-work poverty remain in work.
Four way in-work poverty transition matrix

Source: USoc waves 2–5, weighted analysis
But this ‘optimistic’ perspective should not blind us to two rather more concerning figures, both of which warrant attention. First, the working poor are three times more likely than non-poor workers to become poor and workless (3 per cent vs 1.1 per cent). Secondly, and perhaps even more troubling, of respondents living in poor workless households who find work, 25 per cent only go as far as to enter working poverty (that is, 5.6 per cent of those who are poor and not working transition to become working poor of the 22 per cent (5.6 + 16.1) who transition into work).
Thus, while exiting poverty is the dominant trajectory, there is also a link between in-work poverty and worklessness that requires consideration. Re-running the analysis using the deprivation measure (not shown here) leads to similar conclusions, though again we observe the greater persistence of material deprivation than income poverty. The consequence of this is that as many as 57 per cent of respondents in workless, deprived households who gain employment remain deprived in the subsequent observation period (which may be as much as two years later, as noted above).
Triggers that may help to explain in-work poverty entries and exits
In this section, we examine the triggers that may help to explain entries to and exits from in-work poverty. There are two methods that one can adopt to understand such trigger events. In the first method, proposed by Bane and Ellwood (Reference Bane and Ellwood1986), a mutually exclusive set of trigger events is identified. This adopts a hierarchical approach in which, first, events explained by a change in household head are identified. Of the remaining exits (or entries), these are classified as demographic when needs (i.e. the equivalence scale) changes by a greater proportion than income. The remaining cases, where income changes by a greater proportion than the equivalence scale, are identified as income events. This division of trigger events is subsequently used to identify which accounts for the largest share of poverty entries (or exits) (Jenkins, Reference Jenkins2011: 257).
The second approach, pioneered by Jenkins (e.g. Reference Jenkins2011), identifies a set of non-mutually exclusive events that explain poverty exits (or entries). Since the set of triggers are not mutually exclusive, they are measured independently of one another and the analysis thus overcomes the sequencing problems that can occur in the former method (where the ‘prior’ events can come to dominate the analysis arbitrarily). We adopt this second approach, applying it here to the analysis of in-work poverty entries (or exits) specifically.
While these triggers reflect the proximate events that co-occur with a poverty transition, this does not mean, of course, that they should be interpreted as causal effects. As Layte and Whelan (Reference Layte and Whelan2003: 181) note:
This [framework] sounds simple enough, but such [trigger] events may themselves actually be highly complex and difficult to analyse. For example, a person may have become poor because the income of their household fell. Yet the separation or divorce of the married partners in the household and the exit of one employed adult may have triggered this train of events.
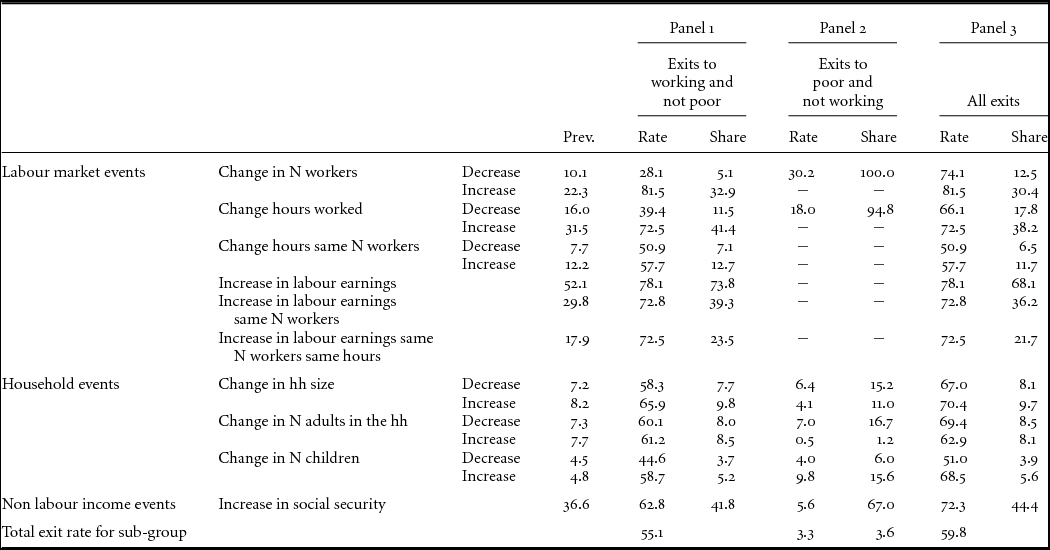
In Table 4, we examine the trigger events for in-work poverty exits. This table contains three important pieces of information. It details the prevalence of each event (i.e. the proportion of the working poor who experience the event), the risk or rate of exit conditional on the event, and the share of all in-work poverty exits accounted for by the event. The methods which underpin this analysis are straight-forward cross-tabulations and, thus, there is no attempt to adjust for confounding effects. Nonetheless, this approach has an important advantage over a regression-based approach, which is that these figures all have a more intuitive interpretation than effect sizes and R-squared statistics in the case of binary variable models.
Trigger events and in-work poverty exits

Note: Changes in hours is defined as being of 10 hours or more. Changes in earnings or social security income defined as 20% or more and at least £10 per week.
Source: USoc waves 2–5, weighted
It is important to distinguish between these pieces of information since an elevated risk of exit conditional on a particular event may or may not account for a large proportion of total exits, because the share statistic is driven by both the prevalence of the trigger and the conditional risk associated with this. There are, then, two ways that an event is categorised as an ‘important’ predictor of in-work poverty: a) it accounts for a large share of all entries or exits (what Jenkins calls ‘aggregate’ importance), or b) it substantially increases/decreases the probability of an individual entering or exiting poverty conditional on experiencing the trigger (which he labels ‘individual’ importance’; see Jenkins, Reference Jenkins2011: 244).
Given that in-work poverty exits can come in quite different forms, we disaggregate the analysis by type of exit. Panel 1 of Table 4 presents trajectories to the destination most of interest – namely, working families who are not in poverty. Panel 2 presents data for the lesser-examined destination – that is, poor families who are without work. Panel 3 presents the figures for all trajectories, including those to the fourth category, those neither in work nor poor, which is not presented separately here. Both increases and decreases in terms of the main triggers are considered. We classify changes in income of 20 per cent and at least £10/week as representing an income event and changes of 10 hours or more as representing an hours event.
We begin our discussion of the analysis in Table 4 by noting the variation in prevalence of the triggers amongst those who experience working poverty. Half of respondents experienced a rise in earned income of more than 20 per cent, and one-third experienced an equivalent increase in social security income. Indeed, the income events were more prevalent than the remaining labour market events such as gaining a worker or additional hours of work, which were, in turn, more prevalent than the household events. This is significant because the more prevalent events have a greater potential to lift greater numbers of people out of poverty, all else being equal.
Turning to the exit rates conditional on the trigger (the column ‘rate’ in Panel 1), we find that, of those experiencing in-work poverty, 55 per cent will exit and become non-poor in the following year, as we have noted above. Increasing the number of workers, the number of hours worked, or experiencing an increase in labour earnings or social security income is associated with a rise in the exit rate of between 15 and 25 percentage points. These labour market events lead to a very substantial increase in the probability of exiting in-work poverty.
Changes in social security income also raise the probability of a family exiting towards becoming a non-poor working family, though the exit rate, while elevated, is lower than for the labour market events. Changes in total household size, or in the number of adults in the household, do not in most cases dramatically alter the exit rate from the average because changes in household composition are ‘ambiguous’ – that is, households that gain an additional adult may either gain a worker or a dependent. These quite different scenarios are likely to have opposite effects on the poverty exit risk and will, on aggregate, partially cancel out. As we might expect, the equivalent ‘negative’ labour market triggers are associated with below-average exit rates – which falls to as low as just over one in four when households lose a worker.
Turning to the share statistics, we can see that three-quarters of those exiting working poverty, towards being a working non-poor family, experience a positive labour income event; while more than four in ten exits co-occur with an increase in social security income. These figures are both substantial and point to the importance of focussing on changes in both the labour market and the welfare state in seeking to understand working poverty exits.
As we have noted, these triggers are not mutually exclusive, so we can also consider the extent to which income events co-occur with other labour market events. About 45 per cent of exits to working non-poor households (Table 4: Panel 1) are associated with changes in the number of workers while the remaining 55 per cent are accounted for by cases where the number of workers does not change. Of the latter group, 60 per cent of exits are accounted for by ‘pure’ earnings increases (i.e. when the number of workers or hours of work does not change), while the remaining 40 per cent experience changes in the number of hours worked in the household.
So far, we have focused on households who escape poverty but remain attached to the labour market. A less examined but nonetheless important perspective is provided in Panel 2 of Table 4, which focusses on respondents who exit working poverty by leaving work, but remain poor. Here, we find that a substantial minority of those who live in working poor households that experience a negative labour market shock will transition to the non-working group (one-third in the case of those that lose workers; 18 per cent of those whose hours in work reduce). Losing an adult or gaining a child is also associated with increasing the probability of becoming a poor workless household, though the exit rates deviate less from the average in these cases. This nonetheless suggests that relationship breakdown and the arrival of a child accounts for a minority of exits towards the workless group, though again we see that the labour market events are more significant predictors than household events.
Finally, Panel 3 of Table 4 contains the relevant information for all destinations. Here, we can observe elevated exit rates for both the positive and negative trajectories and this tells us something of importance about in-work poverty itself – namely, the families in working poverty are vulnerable to negative shocks as well as positive ones. The triggers thus help to explain working poverty exits in both directions – e.g. gaining a worker, or extra hours or earnings, increases the probability of becoming working non-poor families, but the equivalent ‘negative’ triggers are also more likely to prompt working poverty transitions – but towards being workless households. It thus appears that the labour market triggers result in a U-shaped exit risk, which increases from the average either when the positive or the negative trigger is experienced. This makes sense if we think of the working poor as a better-off subset of people who experience poverty (see also Hick and Lanau, Reference Hick and Lanau2017). It is also important in policy terms as it reminds us of the significance of supporting positive transitions while seeking to minimise negative ones.
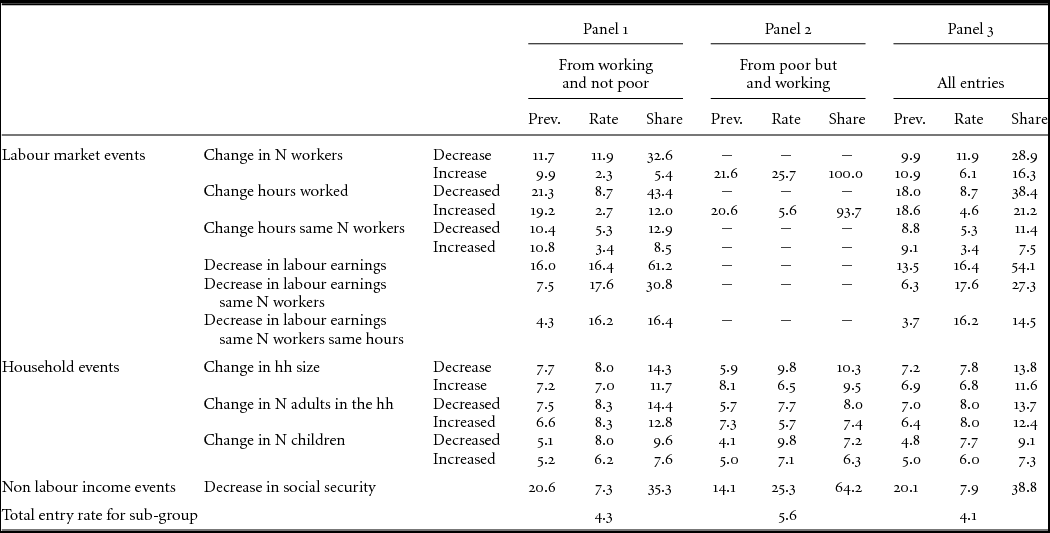
In Table 5, we present three panels relating to working poverty entries but, this time, we include prevalence statistics in each panel, since here the groups are defined by their distinct origins and thus the base sample that can experience the trigger amongst each group varies. The first panel relates to those who enter in-work poverty from being non-poor workers. Panel 2 refers to those who were previously workless families living in poverty who enter working poverty, while Panel 3 relates to all entries.
Trigger events and in-work poverty entries

Note: Changes in hours is defined as being of 10 hours or more. Changes in earnings or social security income defined as 20% or more and at least £10 per week.
Source: USoc waves 2–5, weighted
For all people, the average entry rate is 4.1 per cent (Table 5: Panel 3). This figure does not vary substantially depending on the origin of the entry: 4.3 per cent for those working and not poor, 5.6 per cent for those who are poor and not working. In terms of the prevalence of the triggers, no event is widespread – the most common is a reduction in social security income, experienced by about 20 per cent of those not in in-work poverty. All other events are experienced by fewer than 20 per cent of the non in-work poor, most by fewer than 10 per cent of this group.
Focusing now on respondents in working non-poor households who enter in-work poverty (Panel 1), the most common events are a decrease in the number of hours worked and in social security income (both 21 per cent): changes in the number of workers and changes in household composition are far less common. The conditional entry rate varies to a greater extent from the average than in the previous analysis – 16 per cent of all those who experience a reduction in earnings will enter working poverty (almost four times the average entry rate for this group). This accounts for six in ten entries amongst non-poor working families. Around two-thirds of those have experienced a reduction in the number of hours worked, half of them a reduction in the number of workers. Reductions in social security income account for one-third of working poverty entries for this group.
While, in the analysis of poverty exits, household events had little impact in terms of varying the average exit rate, when we turn to in-work poverty entries, we find that households events do alter the probability of a working household entering in-work poverty. Family change – whether gaining or losing an adult or losing a child – elevates the entry rate to about twice the average.
Turning to Panel 2 of Table 5, those entering from initially being workless and poor, we observe that one-in-five respondents live in families that will gain a worker from one year to the next, and one-quarter of these will become working poor families. Thus, the step into employment fails to lift a sizeable minority of people from poverty. However, this figure, while worrying, is lower than previous estimates from other European nations (ONS, 2015) or for the UK from previous studies (Grzegorzewska and Thévenot, Reference Grzegorzewska and Thévenot2014), though these studies have been based on smaller sample sizes. While our own sample size means we cannot be confident about the differences between the composition of this group and the broader population, a simple descriptive analysis suggests that lone parents are disproportionately represented, and households with three or more children are somewhat over-represented amongst this group (not shown here). This suggests that the balance between work and family life (or family needs) helps to explain why families struggle to rise above the poverty line when they enter work.
When we re-run the analysis using the in-work deprivation measure (see online supplementary material Appendix 1 and 2), we observe that deprivation is ‘stickier’ than low income, as we have noted above. This means that, in the entry model, transitions to becoming working non-deprived are not the majority circumstance, but still remain very common (47 per cent). The deviations from the average exit (and entry) rate for households with labour market or household events are considerably smaller than in the income model. In terms of the model for entries, of those who gain work from being workless households, more than one-half of those who gain a worker will become working deprived households (see online supplementary material Appendix). Thus, a substantial proportion of workless, deprived families who gain work do not exit material deprivation – more than twice the rate of the income model.
Modelling determinants of working poverty transitions
In this final sub-section, we construct a Markov model of the determinants of transitioning in and out of working poverty to analyse the structural factors that shape in-work poverty dynamics (Alcock, Reference Alcock2004). The advantage of regression-based models is that they enable one to control for confounding effects between the independent variables. The Markov model is distinct among such models in that it restricts analysis to those who experienced working poverty in the previous year (who, then, may or may not exit in the subsequent year) and, for the entry model, focuses only on workers not in poverty in the previous year and models the probability of entry. Having focussed on some of the less common trajectories in the previous section, in this section we focus only on movements in and out of working poverty for those who remain in employment (i.e. for working families who enter or exit poverty). In the model relating to entries, negative values reflect variables that reduce the probability of entering in-work poverty for those who are non-poor workers. In the model relating to exits, positive values indicate circumstances that increase the probability of in-work poor respondents exiting poverty while remaining in work.
The first thing one should observe from Table 6 is that having two, or three or more, workers in the household very significantly reduces the risk of entering, and increases the risk of exiting, in-work poverty. Being employed in a lower-skilled occupation raises the likelihood of entering working poverty and reduces the probability of exit, relative to their higher-skilled counterparts. Relative to single-person households, larger households are significantly more likely to enter working poverty, and single parent households and couples with children are more likely to exit in-work poverty. Larger families are more likely to enter in-work poverty, though the large family ‘penalty’ is less visible in terms of exits.
Markov model of determinants of working poverty entries and exits

Source: USoc waves 2–5, weighted
Similarly, having lower educational qualifications than a primary degree increases the probability of entering but does not change the probability of exiting working poverty. Renters are more likely both to enter and to exit working poverty, which may partially be capturing an age effect, while respondents in Northern Ireland are also more likely to enter working poverty and less likely to exit, suggesting that Northern Ireland has a somewhat distinctive dynamic of working poverty. Age has a U-shaped effect where, relative to respondents aged 45–59, both younger and older respondents are less likely to enter working poverty, while there is no relationship between age and the likelihood of exiting working poverty. While many of the coefficients fall in the expected direction, the relationship between the number of workers in the household and the probability of in-work poverty transitions occuring is very strong, even after adjusting for confounding variables.
Conclusions
The problem of poverty amongst working families has received increasing attention in recent years, but academic studies on the longitudinal experience of in-work poverty remain few in number. In this paper, we have sought to extend the literature in this area by presenting an analysis of the probability of in-work poverty transitions, through exploring the different types of trajectories that people can face, and the triggers associated with these transitions.
Our research identifies findings in four key areas. First, we have shown that, while the transitory nature of poverty is widely-known, there is even more mobility in terms of working poverty than in poverty in the working-age population generally. Households with only one worker face the greatest risk of experiencing in-work poverty over a two-year consecutive period, of the groups considered here, which points to the strong relationship between low work intensity and in-work poverty.
Second, we have noted that in-work poverty transitions come in different kinds – namely, whether households leave working poverty by exiting work or exiting poverty – and we have examined the relative probability of these. We find that the big picture is an optimistic one: people who experience working poverty in a given year are more likely to exit in the following year than remain, and most exits are ‘positive’ ones (exiting poverty and still working). But the figures also identify two more troubling findings: first, that those in working poverty are three times more likely to become workless than non-poor working households, illustrating, perhaps, their marginal attachment to the labour market even when in work. And secondly, of respondents living in workless households who find work, one-quarter will only go as far as to enter working poverty. This is surely a failure of policy given the stated aim of all political parties to ensure that work pays and given repeated exhortations to the effect that work is the best route out of poverty.
Third, we have examined the triggers that help to explain in-work poverty transitions. In assessing such triggers, we must first note the prevalence of the income events – increases in earnings or social security occurred more often than any of the other triggers considered here. We find that labour market events increase the in-work poverty exit rate to a greater extent than household events and the share of in-work poverty exits accounted for by employment and social security increases is about three-quarters and 40 per cent, respectively.
Indeed, the prevalence of such events is perhaps surprising given the level of change needed for an event to be classified – more than 20 per cent (as well as more than £10 in absolute terms). More than 50 per cent of working poor families see an increase of this magnitude in a year and this dramatically exceeds the proportion of non-poor families who receive equivalent increases (which was just one in five), which again should give cause for optimism that people can and do exit working poverty by gaining more work, or higher wages, or both.
By integrating the multiple trajectories working poor families can take, into the study of poverty transition triggers, we can observe that in-work poverty exits display a U-shaped risk, whereby both positive and negative triggers increase the risk of working poverty exit. However, while the former increases the probability of becoming non-poor, the latter increases the likelihood of worklessness. This points to the importance of trying to support these positive transitions and minimise negative shocks on working poor families.
In our analysis of working poverty entries, we find that a reduction in earnings provides for the greatest increase in the entry rate of the triggers considered here, and accounts for six in ten entries. About half of these are cases where households lose a worker; in the other half of cases, income from employment falls either through reduced hours or through reduced hourly pay. Of those who are workless and poor, one quarter of those who gain a worker exit worklessness only to enter in-work poverty. Lone parents are over-represented in this group, as are families with three or more children.
In the final sub-section, we modelled working poverty transitions using a Markov model, in which we estimate the probability of transitioning in and out of poverty for working households only. This again demonstrates the significance of the number of workers in the household as the prime predictor of in-work poverty, and the difficulty of maintaining an adequate standard of living in a one-earner household. Respondents working in low-skilled occupations, and those living in Northern Ireland were also more likely to enter, and less likely to exit, in-work poverty.
Overall, we see a picture that is mostly positive in terms of a high likelihood of working poverty exit, and a predominance of positive transitions, out of poverty, over those into worklessness. Nonetheless, while working poor families are indeed working, their position is on average more vulnerable and precarious compared to those higher up the income distribution. Losing a worker, or working fewer hours, is something that they can scarcely afford, and these negative shocks help to explain the transition to worklessness. On the other hand, for too many workless families, finding work does not lift them out of poverty. In both cases, policy needs to support those with a weak labour market attachment and, especially, families with children. Only when this becomes a reality can work truly be said to guarantee a route out of poverty.
Acknowledgements
The material presented in this paper draws on research funded by the Nuffield Foundation (award ECO/42545). The authors thank Rhys Davies, as well as participants at the Child Poverty and Social Mobility Seminar Series at the University of Essex, and at ‘In conversation with Profs. Grusky, Hout and Snipp’, an event at Cardiff University – both held in 2016 – at which an earlier version of this paper was presented. We also thank the three reviewers for their comments and suggestions. The remaining errors are ours alone.
Supplementary material
To view supplementary material for this article, please visit https://doi.org/10.1017/S0047279418000028