1. INTRODUCTION
Ultrashort and short pulse lasers have found wide spread applications in various fields, since they offer high precision and reproducible machining because of the minimized thermal load and lower ablation thresholds compared to longer laser pulses (Chichkov et al., Reference Chichkov, Momma, Nolte, Von Alvensleben and Tunnermann1996; Chaurasia et al., Reference Chaurasia, Munda, Ayyub, Kulkarni, Gupta and Dhareshwar2008; Colgan et al., Reference Colgan, Abdallah, Faenov, Pikuz, Skobelev, Fortov, Fukuda, Akahane, Aoyama, Inoue and Yamakawa2008; Faenov et al., Reference Faenov, Magunov, Pikuz, Skobelev, Giulietti, Betti, Galimberti, Gamucci, Giulietti, Gizzi, Labate, Levato, Tomassini, Marques, Bourgeois, Dufrenoy, Ceccotti, Monot, Reau, Popescu, D'oliveira, Martin, Fukuda, Boldarev, Gasilov and Gasilov2008; Trtica et al., Reference Trtica, Radak, Gakovic, Milovanovic, Batani and Desai2009; Wang et al., Reference Wang, Zheng and Zhou2009). During laser machining, the formation of nanoparticles always occurs independent from the pulse duration or wavelength applied (Barcikowski et al., Reference Barcikowski, Hahn and Chichkov2007a, Reference Barcikowski, Hahn, Kabashin and Chichkov2007b; Fazio et al., Reference Fazio, Neri, Ossi, Santo and Trusso2009). For shorter pulse durations, nanoparticles are generated with higher efficiency (mass per energy) (Semerok et al., Reference Semerok, Chaléard, Detalle, Lacour, Mauchien, Meynadier, Nouvellon, Sallé, Palianov, Perdrix and Petite1999). The energy specific nanoparticle generation rate is one order of magnitude higher in the case of ultrashort, compared to nanosecond pulsed laser ablation in air (Bunte et al., Reference Bunte, Barcikowski, Puester, Burmester, Brose and Ludwig2004). At the same pulse energy, femtosecond and picosecond pulses release similar share (>80%) of nanoparticles, quantified as airborne particles with aerodynamic size below 100 nm (Barcikowski et al., 2008). In the same study, it has been shown that femtosecond laser ablation releases a significantly higher share of 7 nm sized nanoparticles during machining of metals (steel, brass) and ceramics (Zirconia). These nanoparticles may have the same chemical composition as the ablated material (iron-chromium-nickel alloy, yttria-doped zirconia). This indicates that nanoparticle formation happens in non-equilibrium state, as known from fundamental models of ultrafast laser ablation.
The ablated material ejected from the irradiated zone is made of ions, atoms, and nanoparticles with different atomization state depending on laser fluence. Fast imaging and emission spectroscopy experiments have proven that ablated matter splits in two components during the plume expansion: a fast component made up of atomic and ionic species and a slow component consisting of clusters (Noël et al., Reference Noël, Hermann and Itina2007).
Two different thermalization paths of the laser-excited electrons in the target occur depending on the absorbed laser fluence (Gamaly et al., Reference Gamaly, Luther-Davies, Kolev, Madsen, Duering and Rode2005a, Reference Gamaly, Madsen, Duering, Rode, Kolev and Luther-Davis2005b, Reference Gamaly, Rode and Luther-Davies2000). At low laser fluences optical absorption is responsible for superficial excitation of the target while at high laser fluence, thermal electron diffusion produces a deeper interaction. The thermodynamic evolution of the irradiated material and other external factors, for instance, the confinement of the plume, induce different ablation rates and ejected cluster morphology.
The majority of laser systems provide laser pulses with a Gaussian intensity distribution at the fundamental transversal mode:
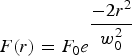
where F 0 is the peak fluence and w 0 is the beam radius (1/e 2). The fluence spatial distribution in the irradiated area may cause the coexistence of different ablation regimes at a single laser pulse. Given that the ablation mechanism depends on the laser fluence regimes, a uniform intensity profile should result in a better control on the ablation regimes (Eliezer et al., Reference Eliezer, Eliaz, Grossman, Fisher, Gouzman, Henis, Pecker, Horovitz, Fraenkel, Maman and Lereah2004, Reference Eliezer, Eliaz, Grossman, Fisher, Gouzman, Henis, Pecker, Horovitz, Fraenkel, Maman, Ezersky and Eliezer2005). Moreover, the presence of two populations of ablated material (fast and slow component) leads to broad size or even bimodal particle size distribution (Kabashin & Meunier, Reference Kabashin and Meunier2003), so that a uniform laser intensity distribution may produce monomodal and narrower size distributions. According to these aspects, we have studied the influence of the laser intensity distribution on the particle size distribution generated during femtosecond laser ablation of silver in air. (Fazio et al., Reference Fazio, Neri, Ossi, Santo and Trusso2009; Latif et al., Reference Latif, Anwar, Aleem, Rafique and Khaleeq-Ur-Rahman2009)
Beam shaping and homogenizing has been shown to improve the quality of laser machining during a variety of applications. Optical devices such as masks, refractive optics, mirrors, fiber bundles, and micro-optical elements are implemented for this purpose. However, the laser light is dispersed and absorbed in the optical set-up before reaching the target. With diffractive optical elements (DOE), phase front modification is induced by diffraction and not refraction. Hence, thinner devices are fabricated and for this reason, they exhibit enormous advantages for high power and ultrashort-pulsed laser technology (Momma et al., Reference Momma, Nolte, Kamlage, Von Alvensleben and Tünnermann1998). We took advantage of these optical systems to compare the ablation of silver by a Gaussian and a flat-top intensity profile. The consequently generated nanoparticles were on-line captured and their aerodynamic diameter measured to study the changes on size distributions. Fumes and aerosols are characterized by their aerodynamic diameter (and not Feret diameter), as it has been shown to be the principal parameter for nanoparticles deposition mechanisms and rates of nanoparticles in filters or the respiratory system. For example, toxicological studies (International Commission on Radiological Protection, 1994) proved that particles with aerodynamic diameters of 20 nm are deposited in the alveolar region with an efficiency of 50% (Hinds, Reference Hinds1998). From this point of view, a correct control and characterization of airborne particles is interesting not only for the study of toxicological hazard but also for potential inhalative drug delivery (Borm & Kreyling, Reference Borm and Kreyling2004).
2. EXPERIMENTAL SET-UP
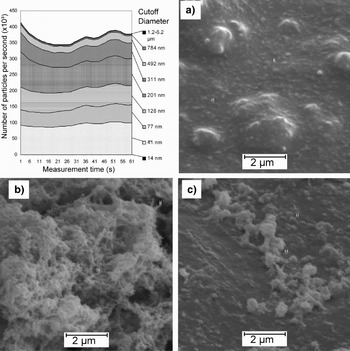
Experiments were carried out with a Ti:Sapphire laser (Spectra Physics, Spitfire PRO, Mountain View, CA) delivering 120 fs pulses with a repetition rate of 5 kHz at a wavelength of 800 nm, and a maximal pulse energy of 300 µJ. The beam with 1.8 mm (1/e 2) radius was focused by an achromatic 100 mm focal length lens in order to obtain a Gaussian intensity profile. The flat-top profile was obtained with the implementation of the corresponding DOE (Silios Technologies, Peynier, France). Ablation took place inside a tubular chamber of 360 ml volume (constant volume flow rate of 10 l/min) in which the target was placed normal to the laser beam. An optical window on top allowed the entrance of the laser and full capture of the aerosol. An online-coulomb low-pressure cascade impactor (Dekati, ELPI, Tampere, Finland) connected to the chamber measured the particle size distributions at 1 Hz data acquisition rate in the aerodynamic diameter range from 7 nm to 10 µm. An example of the measurement results is presented in Figure 1. The particle number rate detected in each impactor stage is plotted as a function of time. The monotonous temporal trend of the results shows the constancy of the relative share of the particulate fractions during the ablation process. The different grey-shaded areas represent the total number of particles detected during 1 min (60 measurements). The fraction of microparticles is comparable low and is grouped to 1.2–6.2 µm fraction. The aerodynamic sized distribution ranges from 40–790 nm.
Particle number rate at each stage of the cascade impactor and SEM micrographs of particles deposited on stages with cutoff diameter 40 nm (a), 201 nm (b), and 128 nm (c), generated by a laser ablation with Gaussian beam at 0.62 J/cm2.

3. EXPERIMENTAL RESULTS
Particle generation experiments were carried out at the image plane of the DOE, determined with an optical microscope measuring the ablated patterns in a silicon wafer. In order to determine the dimensions of the beam, silicon was irradiated at different pulse energies with 50,000 pulses (50,000 on 1). From the ablated patterns (inset in Fig. 1), certain Gaussian intensity decay on the borders of the beam can be assumed. The ablated spot, D abl, can hence be related to the real dimensions of the beam, L, as follows:

as fluence is related to the pulse energy and beam side with:

where E p is the input pulse energy, F th is the ablation fluence threshold. The resulting square side obtained from the semi-logarithmic fit is 57 ± 9 µm (Fig. 2).
Ablated spots of flat-top intensity profile in silicon at different pulse energies. The dashed line is the fit obtained with Eq. (2). Inset: typical ablated pattern.
Femtosecond laser ablation with Gaussian intensity distribution was made placing the target in the focal plane of the achromatic lens. The diffraction limited beam waist is 14 ± 1 µm. The pulse energy of the Gaussian beam necessary to have the same peak fluence as the flat-top profile is calculated based on the obtained beam dimensions. Of course, for tightly focused beams (Gaussian beam in our case), the pulse energy required to reach a determined peak fluence is much lower than for defocused beams (flat-top beam). The pulse energy for the Gaussian beam was varied form 2 to 13 µJ, while for the flat-top profile it was varied from 20 to 140 µJ.
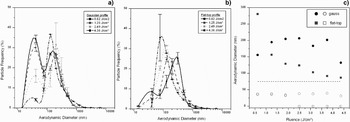
Particle size distributions generated during femtosecond laser ablation of silver at 0.62, 1.25, 2.49, and 4.36 J/cm2 and measured online are shown in Figure 3. In the fluence range from 0.62 to 3.74 J/cm2 particle size distributions obtained by femtosecond laser ablation with Gaussian beam are bimodal. Two particle number frequency maxima appear at approximately 40 and 200 nm. This may be caused by the coexistence of two different ablation zones with cluster or particle densities. As fluence increases, the relative abundance of the small particles decreases, indicating that at higher peak fluence one of the two-ablation mechanisms is dominant. At low fluences (0.64 and 1.25 J/cm2) two-particle number frequency maxima are detected also in the case of the flat-top laser intensity profile, where at higher fluences >1.25 J/cm2 the particle size distributions resulted monomodal (Fig. 3).
Influence of the laser intensity profile on the particle size distributions generated by a Gaussian (a) and flat-top (b) profile at fluences 0.62, 1.25, 2.49, and 4.36 J/cm2. (c) Mode values of the size distributions. Filled symbols represent the frequency maximum of big (submicron) particles and hollow symbols the frequency maximum of small (sub-100 nm) particle population.
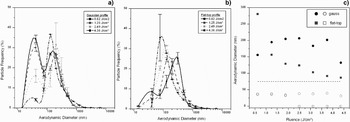
The bimodal particle distribution is consisting of submicron particles with aerodynamic diameter >75 nm and nanoparticles with diameter <75 nm. Laser fluence affects the number frequency of the respective particle population in the bimodal aerosol and the average particle diameter increases with the laser fluence applied. However, in the case of the Gaussian femtosecond laser beam the aerodynamic diameter of the particles remains almost constant for different laser fluences. In contrary, when a flat-top profile is used for femtosecond laser ablation of silver, the particle size of both populations is reduced as the fluence increases (Fig. 3c). As peak fluence applied for both beam profiles was the same, we attribute this effect to the pulse energy. An explanation could be that pulse energies above a certain threshold increase the particle concentration in the volume above the target. Independent from the intensity profile used for femtosecond laser ablation, an increase in the laser fluence causes a reduction in the population of small particles but an increase in the abundance of bigger particles (Fig. 3).
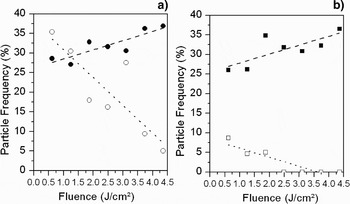
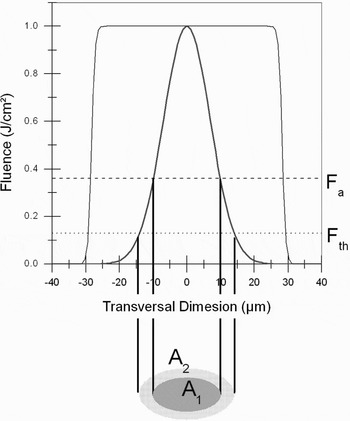
At about 1.2 J/cm2, the number share of the two particle populations are equal in the case of Gaussian beam ablation. Assuming that particles size differences are originated in two ablation regions, at this laser fluence both mechanisms are balanced. Geometrically, the irradiated area on silver can be divided into two zones. The inner area, A1, corresponds to fluences higher than a determined threshold, F a, and the outer area, A2, corresponds to fluences between the ablation threshold of silver, F th, and F a (Fig. 4).
Frequency of the peak maxima for aerodynamic particle size distribution generated by a Gaussian (a) and a flat-top (b) profile in the fluence range [0.6–4.4] J/cm2. Filled symbols represent the particle frequency of peak maximum of particle >75 nm and hollow symbols the peak maximum of small particle population (<75 nm).

Transversal laser fluence distribution for a Gaussian and flat-top profile. F a and F th represent the fluence thresholds for different ablation mechanism, and delimitate the irradiated areas with different fluence ranges.

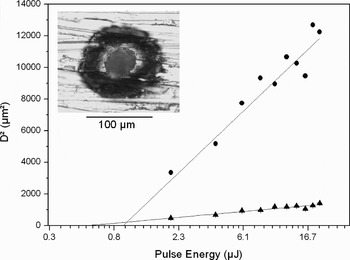
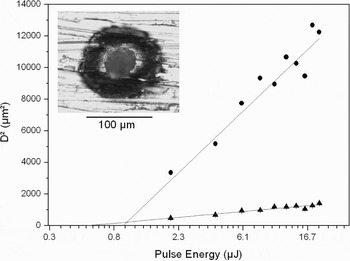
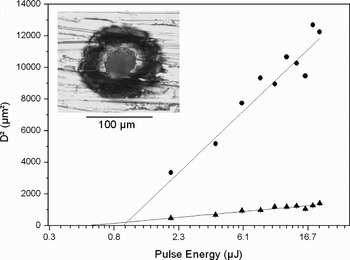
These fluence thresholds were determined from the ablated patterns in silver (Fig. 5) with an ablation threshold F th (from the outer diameter, D out) of 0.031 J/cm2 and F a (from the inner diameter, D in) of 0.19 J/cm2. From Eq. (2), the relation between irradiated area and the corresponding threshold fluence can be determined as follows:

Determination of ablation thresholds F th and F a: Square ablated diameters (inner, triangles; outer, circles) versus pulse energy. Inset: ablated spot on silver with 20 µJ.

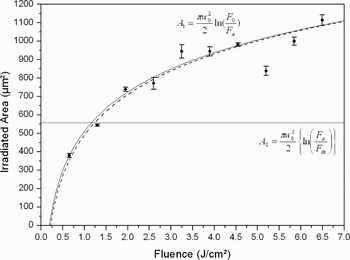
These areas are supposed to be related to areas of two different thermalization mechanism of the target and consequently of two different nanoparticle populations formed subsequent to the thermalization. The dependence of the size of these two areas from the laser fluence is shown in Figure 7 for the experimentally determined parameters (F a = 0.19 J/cm2, F th = 0.03 J/cm2 and w 0 = 14 µm), predicting that at approximately 1 J/cm2 both laser ablation mechanisms are equally dominant. This is in accordance to the experimental results in Figure 4a, where at about the same value (1.2 J/cm2), the two nanoparticle populations were generated at equal number frequency.
Ablated area (circles) and calculated irradiated area (black line) for F > F a and calculated irradiated area for F th < F < F a (horizontal line). The dashed line represents the best fit for the experimental data (F a = 0.21 J/cm2w 0 = 14.2µm).

The fluence threshold is related to the material density ρ, mass specific heat of vaporization Ω, and the laser-matter interaction depth inside the target l as follows:

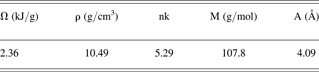
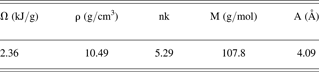
With the material constants of bulk silver in Table 1 (Aschroft & Mermin, Reference Ashcroft and Mermin1987; Palik, Reference Palik1985) and the measured ablation thresholds from Figure 6, the laser matter, interaction depths for each range are 13 nm and 77 nm. The first corresponds to the skin depth of silver and the second to the thermal penetration depth of electrons. These values can be theoretically determined under certain approximations (Lehecka et al., Reference Lehecka, Mostovych and Thomas2008):
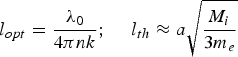
where nk, M, and a are the extinction coefficient, ion mass and interatomic distance of silver. The resulting interaction depths are 13 nm and 104 nm for the optical attenuation and the thermal diffusion, respectively, both confirming the experimental results.
Physical constants of bulk silver
The experiments and calculations confirm that the femtosecond laser generation of particles smaller than 75 nm is driven by soft ablation (low fluences) while the formation of particles bigger than 75 nm is based on hard ablation (high fluences). The normally distributed intensity in the laser beam implies the presence of those two ablation zones for one single pulse. Broad and even bimodal distributions are emitted from the target, where at the same peak fluence; homogeneously distributed laser intensities cause monomodal distributions.
From scanning electron microscope micrograph of the impacted aerosol presented in Figure 1, the Feret diameter of primary particles can be determined. On stage 2 (aerodynamic cut-off diameter 40 nm) we found mainly 80 nm particles but also big agglomerates (200 nm–1 µm). On stage 5 (aerodynamic cut-off diameter 201 nm) we found primary particles ranging from 90–230 nm and finally on stage 4, corresponding to an aerodynamic cut-off diameter of 128 nm, particles of Feret size of 80–120 nm are analyzed. It seems that particles collected by the cascade impactor consist of primary nanoparticles and agglomerates. The different agglomeration states are caused by different formation mechanism of airborne nanoparticles by femtosecond-laser ablation. Small primary nanoparticles agglomerate to bigger airborne nanoparticles. The agglomeration rate is related to the ablated matter density in the plume. Naturally, as at higher fluences more mass is ablated, the agglomeration rate increases. The formation of these agglomerates should take place in the strong ablation region (inner area in Fig. 6). The resulting aerodynamic diameters confirm this behavior. As shown in Figure 7, this region increases with laser fluence for a Gaussian beam. In analogy, the aerodynamic dynamic distribution varies with fluence. Primary particles <75 nm d Aero (respectively < 150 nm d Feret) tend to agglomerate and their population decreases, in favor of the >75 nm d Aero (respectively < 150 d Feret) population (Fig. 4).
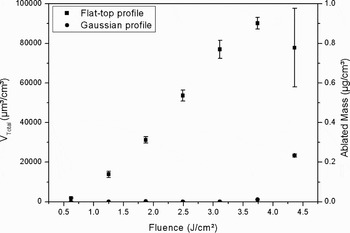
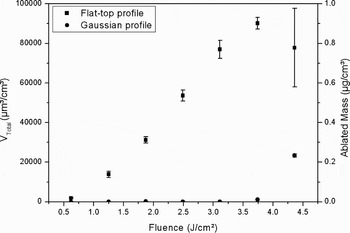
Assuming a complete capture of the ablated material and a complete conversion of ablated mass into airborne particles (no redeposit was observed); the total volume of the particles detected in the impactor is proportional to the total ablated mass. The total ablated volume plotted against the laser fluence shows different tendencies for each beam profile (Fig. 8). In the case of Gaussian beam, low mass ablation rates are measured below a fluence of 3 J/cm2. This fluence is one order of magnitude bigger than the measured ablation threshold of silver (0.19 J/cm2). At higher laser fluence, the ablated mass increases. In contrary, an almost linear increase in the ablated mass occurs for flat-top profile. This feature can be explained by the multiple reflections at the walls of the tapered ablated craters. As tapering is minimized for the holes machined by a flat-top profile, the incident radiation is normal to the target for each pulse. Therefore, less energy losses occur because of reflections. At sufficient high fluences the craters ablated by a Gaussian beam are so deep that the scattered laser is trapped inside the hole. Thus, the ablation is enhanced and results in deeper holes than the focal depth of the beam (Dahotre & Harimkar, Reference Dahotre, Harimkar, Dahotre and Harimkar2007).
Dependence of the total volume and mass ablated with flat-top and Gaussian intensity profile on the fluence.
Laser processing of silver in a liquid environment results in different morphology of the surface. Indeed, laser ablation of silver targets in liquids may be considered as an alternative way for generation of silver nanoparticles that are free of any counter-ions and surface-active substances. The high purity of the resulting colloids and the possibility of one-step generation of nanoparticle-bioconjugates thrusts forward the laser-based synthesis technique (Petersen & Barcikowski, Reference Petersen and Barcikowski2009; Petersen et al., Reference Petersen, Jakobi and Barcikowski2009). Presence of a liquid layer over an silver target alters the mechanism of melt removal. Namely, the molten layer that is formed on the target after the transfer of excitation from electrons to phonons is dispersed by recoil pressure of the liquid vapor adjacent to the target (Shafeev, Reference Shafeev and Lackner2008b). The molten layer is dispersed in the surrounding liquid as nanoparticles that have a bimodal size distribution in case of a Gaussian profile of a femtosecond laser beam (Shafeev et al., Reference Shafeev, Freysz and Bozon-Verduraz2004). At the threshold laser, fluence the molten layer on silver surface is modified due to the development of instability at the melt-vapor interface. Both the ablation rate and the rate of nanoparticles production drop, while the target becomes nano-textured as shown in Figure 9.
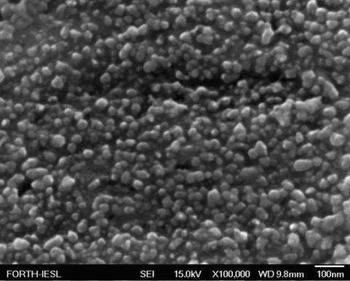
Field emission scanning electron microscope view of the surface of an silver target subjected to ablation in water to radiation of a femtosecond laser at fluence of 4.5 J/cm2.
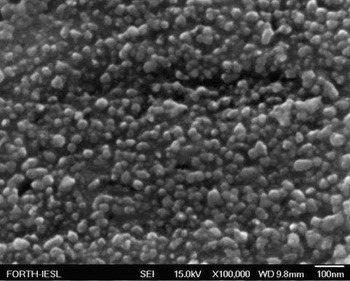
One can see that the size distribution of nanostructures is characterized by bimodal function centered on 20 and 50–60 nm, respectively. These nanostructures exhibit plasmon resonance typical of nano-sized silver around 400 nm. The ablated surface takes on the characteristic yellow coloration well visible at the angle of mirror reflection (Shafeev, Reference Shafeev and Lombardi2008a). Note that the size of nanostructures in case of a femtosecond laser pulses is much smaller than in case of a 350 ps laser exposure at the wavelength of 1.06 µm (Truong et al., Reference Truong, Levi, Bozon-Verduraz, Petrovskaya, Simakin and Shafeev2007). This difference, however, cannot be assigned to the difference in laser wavelength, since in case of silver target no wavelength-scaled periodic ripples are observed. Smaller size of nanostructures in case of a femtosecond laser exposure should be attributed to a thinner molten layer.
4. CONCLUSIONS
The influence of laser intensity profile on particle size distribution has been proven for femtosecond laser ablation of silver targets in air. Using homogeneous (flat-top) laser intensity profile, monomodal particle size distributions are generated, while Gaussian beam profile leads to bimodal particle size distributions. Bimodality of the lateral size of nanostructures on silver surface ablated under the layer of water apparently has similar origin. The customization of light field distribution allows a better control of the ablation process and aerodynamic nanoparticle size distribution. Particle transport in aerosol technology is characterized by the particle settling velocity, which is related to the aerodynamic diameter d Aero measured by the cascade impactor. This property, (instead of the size d Feret measured by scanning electron microscope) of airborne particles, has implications in inhalation toxicology and, at the same time, pharmacokinetic models and experimental design of inhalative particle drug delivery.
ACKNOWLEDGEMENT
The authors would like to thank the Deutsche Forschungsgemeinschaft for funding the nanoparticles research within the projects BA 3580/2-1 and CH-197/8-1.