I. INTRODUCTION
Highly nanotwinned (nt) Cu has been the subject of many recent studies, as it has shown ultrahigh strength, decent ductility, and stable microstructure during deformation as compared to ultrafine grained (UFG, grain size 100 nm to 1 μm) and nanocrystalline (grain size <100 nm) Cu.Reference Lu, Shen, Chen, Qian and Lu1–Reference Shute, Myers, Xie, Li, Barbee, Hodge and Weertman5 However, the processing conditions for nt Cu vary, which leads to different microstructures (grain size and twin thickness) with distinct behaviors. Specifically, a study by Lu et al.Reference Lu, Chen, Huang and Lu2 compared the mechanical response of nt Cu samples with various twin thicknesses ranging from 4 to 96 nm and demonstrated a drastic mechanical behavior change as twin thickness decreased below 15 nm.
To date, there are two major processing techniques to synthesize highly nt Cu: electrodeposition and magnetron sputtering. Samples synthesized using electrodeposition generally have equiaxed grains (grain size 400–600 nm) with varying nt thicknesses ranging from 4 to 96 nm.Reference Lu, Shen, Chen, Qian and Lu1–Reference Lu, Lu and Suresh3 For the samples synthesized by magnetron sputtering, the grains are typically columnar with grain sizes ranging from UFG (600–800 nm) to nanocrystalline (∼40 nm) and twin thicknesses ranging from 4 to 40 nm.Reference Hodge, Wang and Barbee4–Reference Zhang and Misra7 While the mechanical behavior of all these samples has been well characterized, the effect of twin thickness on the thermal stability must still be explored. A recent study by Anderoglu et al.Reference Anderoglu, Misra, Wang and Zhang6 on nt Cu (twin thickness 4 nm, grain size 40 nm) at 800 °C reported modest nt growth and an order of magnitude grain growth, although their sample hardness decreased from 3.5 to 2.2 GPa. However, as pointed out by Zhang and Misra,Reference Zhang and Misra7 the superior thermal stability of nt materials requires further study and must include additional factors such as sample texture.
The uniqueness of this study is that we evaluate the thermal stability of highly nt Cu in the perspective of grain boundary (GB) character and texture. Specifically, since the GB character affects GB migration, this aspect becomes more critical with the presence of nanotwins. Some studiesReference Anderoglu, Misra, Wang and Zhang6–Reference Saldana, King, Stach, Compton and Chandrasekar10 have shown that the presence of low energy coherent twin boundaries (CTBs) enhanced the thermal stability, so it is expected that large amounts of coherent nt boundaries would lead to better overall thermal stability. In the case of texture, it has been shown that a microstructure with strong texture has a higher thermal stability than that with a weak texture.Reference Anderoglu, Misra, Wang and Zhang6, Reference Kobiyama, Inami and Okuda11 In addition, different grain orientations have distinct surface energies, and their elastic properties are also different, which could lead to distinct strain energies when grains are anisotropically strained.Reference Zhang, Xu and Ji12–Reference Zhang, Xu and Ji15 Thus, texture may change at elevated temperature to minimize the total energy.
In this study, the thermal stability of sputtered highly nt UFG Cu foil (twin thickness ∼ 40 nm) is compared with sputtered UFG Cu foil (without nanotwins). The samples were heat-treated at regular intervals until the nt structure was no longer stable. To analyze GB migration and texture changes at elevated temperature, electron backscatter diffraction (EBSD) and focused ion beam (FIB) were used to characterize microstructural features before and after heat treatments at the different temperatures.
II. EXPERIMENTAL DETAILS
Both types of UFG Cu copper foils were synthesized by magnetron sputtering using high purity Cu (99.999%) deposited onto (100) silicon wafers. The samples were sputtered at 2 mTorr Ar pressure using interrupted sputtering (in the case of UFG Cu with nanotwins, as described elsewhereReference Hodge, Wang and Barbee4) and continuous sputtering (for the UFG Cu without nanotwins). It is important to note that all films were “freely” removed from the substrate and were handled as flat and undistorted freestanding foils. Throughout this manuscript, the UFG Cu without nanotwins will be referred to as UFG Cu, while the highly nt UFG Cu will be referred to as nt Cu. The thicknesses of the UFG Cu and nt Cu foils were ∼25 and 65 μm, respectively.
The freestanding UFG Cu and nt Cu samples were sequentially heat-treated at 200, 300, and 400 °C for 3 h at each temperature under identical conditions in a MTI-GSL1100X furnace (MTI Corporation, Richmond, CA) under vacuum between 1 × 10⁻⁴ and 1 × 10⁻⁵Torr. Additionally, the nt Cu was further heat-treated at 600 °C for 3 h. The heating rate was ∼10 °C/min, and the average furnace cooling rates above 100 °C were 1.5, 1.9, and 2.3 °C/min for 200, 300, and 400 °C heat treatments, respectively. X-ray diffraction (XRD) was carried out after each heat treatment, and no oxide peaks were observed. FIB imaging (JEOL JIB-4500, Peabody, MA) was used to obtain grain morphology, grain size, and twin thickness on the top surfaces and cross sections of samples in the as-prepared condition and after 400 °C heat treatment; additional FIB imaging was also performed on the top surface of nt Cu after 600 °C heat treatment. EBSD was used before and after each heat treatment to study grain morphology, grain size, GB character, and grain orientation on the top surfaces of UFG Cu and nt Cu. EBSD cross-sectional analysis was not performed due to resolution limitations given that the twin thickness of nt Cu is ∼40 nm.
To perform EBSD analysis, the nt Cu was mounted and sequentially polished by 6, 3, and 1 μm polycrystalline diamond suspensions and colloidal silica. A vibratory polisher (Buehler, Lake Bluff, IL) was then used to further polish the sample with colloidal silica. The as-sputtered UFG Cu did not require polishing. Fiducial marks were made by nanoindentation on both of the as-prepared samples, so that the same area could be scanned by EBSD before and after each heat treatment. EBSD tests were carried out on the top surfaces by JSM-7001F-LV SEM (JEOL, Peabody, MA) with an EDAX Hikari detector (EDAX, Mahwah, NJ). The samples were tilted 70° from the horizontal plane; the acceleration voltage and working distance were 15 kV and 15 mm, respectively. Before heat treatment, the scanning area was 10 × 10 μm with a step size of 50 nm. However, with increasing grain size after heat treatments, the scanning area was also increased. For UFG Cu, the scanning area was 60 × 60 μm with a step size of 300 nm after heat treatment above 200 °C; for nt Cu, the scanning area was 180 × 180 μm with a step size of 200 nm after heat treatment at 400 °C. All EBSD analyses were based on these scanning areas.
After the EBSD scans, TSL OIM Analysis 6.1 software was used to analyze the data. Before analysis, less than 1% of the data were changed during “cleanup” procedure, and the data with confidence index lower than 0.1 were removed and shown as black pixels in the grain morphology and grain orientation maps. For grain size calculation, grains were defined by GBs with misorientations larger than 5° for both UFG Cu and nt Cu,16, Reference Humphreys17 and Σ3 and Σ9 twin boundaries were excluded from grain size measurement. The reason for applying 5° instead of 15° to define grains is that applying 15° would result in abnormally large columnar grains in nt Cu, given that some columnar GBs of nt Cu have misorientations lower than 15°. Each grain size was calculated by measuring the grain area (A) and then assuming the grain as a circle so that the grain size (d) is:  $d = 2 \times \sqrt {{A \over \pi }}$. The average grain size was then taken as the sum of all grain sizes divided by the total number of the grains. In addition, Σ3 GBs, low angle grain boundaries (LAGBs, 5–15°), and high angle grain boundaries (HAGBs, 15–63°) were analyzed. To differentiate coherent Σ3 GB from incoherent Σ3 GB, the software reconstructed GBs and applied boundary trace analysisReference Randle18, Reference Wright and Larsen19 to determine whether the GB plane could coincide with the twinning plane. The length fraction of coherent Σ3 GBs was calculated with respect to the overall length of reconstructed GBs. XRD was used to analyze sample texture and to confirm the EBSD results.
III. RESULTS AND DISCUSSION
A. Initial microstructure
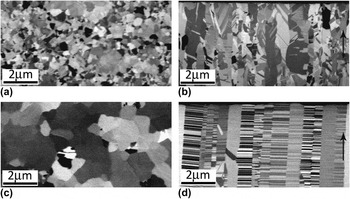
Figures 1(a) and 1(b) show the top surface and cross-sectional FIB micrographs of UFG Cu, respectively. The average grain size at the top surface is ∼320 nm, and the cross-sectional micrograph presents columnar grains with an average grain size of ∼400 nm. Figures 1(c) and 1(d) show the top surface and cross-sectional FIB micrographs of the nt Cu: The average grain size at the top surface is ∼700 nm, and a high density of growth nanotwins (twin thickness, ∼40 nm) aligned parallel to the top surface is observed in the cross section. The microstructural values for nt Cu are confirmed in previous publications by the authors using transmission electron microscope (TEM).Reference Hodge, Wang and Barbee4, Reference Shute, Myers, Xie, Li, Barbee, Hodge and Weertman5
FIB micrographs of as-prepared UFG Cu (a) top surface, (b) cross section, and nt Cu (c) top surface, (d) cross section. The arrows in (b) and (d) indicate the growth direction of the foils.

B. Grain growth at elevated temperatures
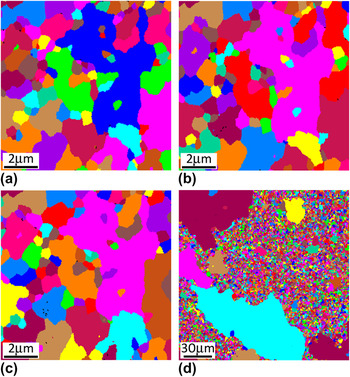
The grain growth of UFG Cu and nt Cu samples was evaluated by EBSD after each heat treatment. Figure 2 shows the grain morphologies on the top surface of UFG Cu in the as-prepared condition and after each heat treatment; note that each color only represents individual grains and not specific orientations. The grains of the as-prepared UFG Cu are presented in Fig. 2(a), which is consistent with the FIB result shown in Fig. 1(a). Figure 2(b) indicates that there was rapid grain growth at 200 °C, where the average grain size increased from ∼330 nm (as-prepared) to ∼960 nm after heat treatment. Several newly formed large grains (5–30 μm in diameter) are present and consumed most of the ultrafine grains. At 300 and 400 °C, the large grains, which formed at 200 °C, remained at approximately the same size, and the remaining ultrafine grains were gradually consumed by the large grains as shown in Figs. 2(c) and 2(d).
EBSD grain morphologies on the top surface of UFG Cu (a) as-prepared, and after (b) 200 °C, (c) 300 °C, and (d) 400 °C heat treatments. Each color represents individual grains and not orientation.

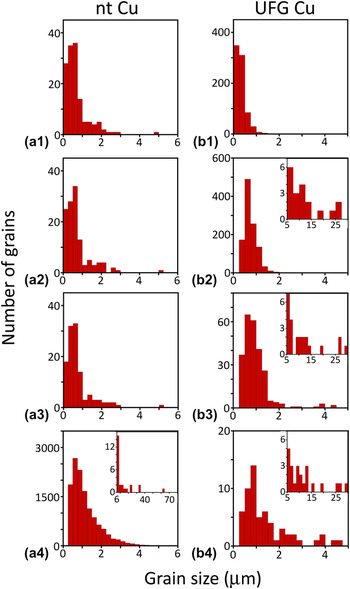
Figure 3(a) shows the top surface of the as-prepared nt Cu using EBSD, which is consistent with the FIB result shown in Fig. 1(c). The grains did not appear to grow at 200 °C [Fig. 3(b)] and remained stable even at 300 °C as shown in Fig. 3(c). Although several small grains were consumed at 200 and 300 °C, the majority of the grains were unchanged in size and morphology. At 400 °C, several very large grains can be observed in some areas, as shown in Fig. 3(d). Further details of the grain size evolution examined by EBSD are illustrated in Fig. 4. For nt Cu, Figs. 4(a1)–4(a3) confirmed that the average grain size increased only slightly from ∼700 nm in the as-prepared condition to ∼750 nm after 300 °C heat treatment. At 400 °C [Fig. 4(a4)], most grains were smaller than 6 μm in diameter and the average grain size of the small grains was ∼1170 nm. In addition to the modest growth of small grains, very large grains (6–70 μm in diameter) formed, and the overall average grain size of nt Cu sample reached ∼1200 nm after 400 °C heat treatment. This is in contrast to the UFG Cu where the largest change in grain size occurred during heating from room temperature to 200 °C, as observed in Figs. 4(b1) and 4(b2). Additionally, Figs. 4(b3) and 4(b4) suggest that there were sharp drops in the number of small grains (≤5 μm in diameter) at 300 and 400 °C, consistent with the continual increases in average grain size.
EBSD grain morphologies on the top surface of nt Cu (a) as-prepared, and after (b) 200 °C, (c) 300 °C, and (d) 400 °C heat treatments. Each color represents individual grains and not orientation.

EBSD grain size distributions on the top surface of nt Cu (a1) as-prepared (average grain size d avg = 697 nm), and after (a2) 200 °C (d avg = 734 nm), (a3) 300 °C (d avg = 754 nm), and (a4) 400 °C (d avg = 1195 nm) heat treatments; and those of UFG Cu (b1) as-prepared (d avg = 328 nm), and after (b2) 200 °C (d avg = 963 nm), (b3) 300 °C (d avg = 1871 nm), and (b4) 400 °C (d avg= 4364 nm) heat treatments. The insets present the size distributions of larger grains.

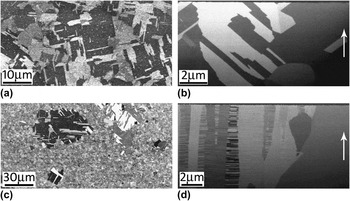
To further analyze the extent of grain growth, the top surface and cross-sectional FIB micrographs of UFG Cu and nt Cu were obtained after 400 °C heat treatment and are shown in Fig. 5. For the UFG Cu, Figs. 5(a) and 5(b), many newly formed annealing twins can be observed on both the top and cross-sectional surfaces. For the nt Cu, Fig. 5(c), the top surface matches the characteristics of the EBSD results in which several very large grains containing a few annealing twins can be observed among many smaller grains. In Fig. 5(d), the cross-sectional microstructure still retains some highly nt columnar grains, while very large grains (without nanotwins) formed. At this point, the mechanism of how nanotwins or annealing twin boundaries contribute to thermal stability is not quite clear and will be further discussed in Sec. C and D.
FIB micrographs after 400 °C heat treatment of UFG Cu (a) top surface, (b) cross section, and nt Cu (c) top surface, (d) cross section. The arrows in (b) and (d) indicate the growth direction of the foils.

C. GB migration
Before discussing GB migration, one must take into account the sample purity and the definitions of different types of GBs. Since both Cu samples were of high purity (99.999%), there are few impurities to pin GBs, so GBs can easily migrate.Reference Doherty, Hughes, Humphreys, Jonas, Juul Jensen, Kassner, King, McNelley, McQueen and Rollett20 For GB analysis, Σ3 and Σ9 are both twin boundaries, which can be either CTBs or incoherent twin boundaries depending on the GB plane orientation, and for a CTB, the GB plane must coincide with the twinning plane.Reference Randle18, Reference Wright and Larsen19 In highly nt Cu, such as that used in this study, it is known that most of the nt boundaries are Σ3 CTBs.Reference Anderoglu, Misra, Wang and Zhang6 Σ9 twin boundaries, which are few in both UFG Cu and nt Cu, will not be discussed.
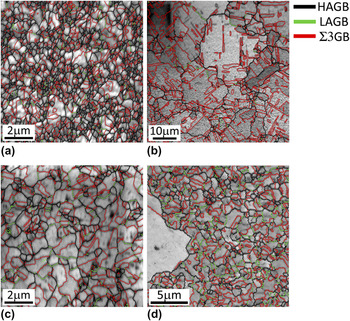
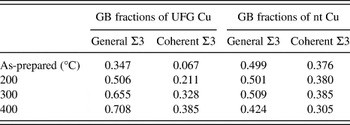
Figure 6 shows the EBSD top surface representative GBs for the as-prepared case and after 400 °C heat treatment for the UFG Cu [Figs. 6(a) and 6(b), respectively] and nt Cu [Figs. 6(c) and 6(d), respectively]. In this figure, Σ3 GBs, LAGBs, and HAGBs (high angle but not Σ3) are identified. While this figure provides the top surface view of GBs, the cross-sectional view of GBs can be observed in the FIB micrographs (Figs. 1 and 5). A detailed comparison of the changes in length fraction of the Σ3 and coherent Σ3 GBs is illustrated in Table I. For UFG Cu, there was a continual increase of both Σ3 and coherent Σ3 fractions with increasing temperature, which indicates that while annealing twins were formed, the fraction of ordinary GBs (high angle and high energy) gradually decreased during heat treatments. For nt Cu, both the Σ3 and coherent Σ3 GBs were stable up to 300 °C, but at 400 °C, several very large grains consumed some of the highly nt columnar grains as indicated in Figs. 5(c) and 5(d).
GB distributions (EBSD) on the top surfaces of UFG Cu (a) as-prepared, (b) after 400 °C heat treatment, and nt Cu (a) as-prepared, (b) after 400 °C heat treatment. Red lines represent Σ3 GBs, green lines represent low angle GBs (LAGBs, 5–15° misorientation), and black lines represent high angle GBs (HAGBs but not Σ3, 15–63° misorientation).

Length fractions (EBSD) of general Σ3 and coherent Σ3 GBs on the top surfaces of UFG Cu and nt Cu before and after each heat treatment.

The high temperature GB migration rate in Cu films is mainly dependent on the minimization of GB energy, surface energy, and strain energy.Reference Sonnweber-Ribic, Gruber, Dehm and Arzt21, Reference Thompson and Carel22 GB energy minimization should be the dominant driving force for UFG Cu, as it has a large amount of ordinary GBs with few low energy CTBs. Table I shows that the length fraction of coherent Σ3 GBs in UFG Cu increased from 0.067 (as-prepared) to 0.211 at 200 °C and had a continual increase to 0.385 after 400 °C heat treatment, which indicates the formation of annealing twins as observed in Fig. 6(b). The low-mobility coherent annealing twin boundaries formed at 200 °C could stabilize the large grains from further growth at 300 and 400 °C [Figs. 2(b)–2(d)] (as reported in Ref. Reference Holm and Foiles23) so that low-mobility GBs can stop grain growth by having a pinning effect.Reference Janssens, Olmsted, Holm, Foiles, Plimpton and Derlet24–Reference Lingk, Gross and Brown28
In contrast, the highly nt Cu started with a high fraction of Σ3 GBs (0.499) on the top surface, and more importantly, the coherent Σ3 GBs fraction (0.376) was significantly higher than that of UFG Cu (0.067). Given that both the UFG Cu and nt Cu were synthesized by the same method under similar conditions, the higher fraction of CTB in the as-prepared nt Cu can be attributed to the presence of highly nt columnar grains in the cross section. At elevated temperatures, these nt boundaries contribute to the thermal stability of nt Cu due to two main reasons: first, due to the close-packed atomic arrangement and low energy of coherent nt boundaries, they are less mobile than ordinary GBs at elevated temperatureReference Janssens, Olmsted, Holm, Foiles, Plimpton and Derlet24, Reference Berger, Wilbrandt, Ernst, Klement and Haasen29, Reference Gottstein, Shvindlerman and Ralph30 and contribute to the grain stability at 200 and 300 °C. Second, nt boundaries intersect with columnar GBs, which formed many triple junctions, as shown in Fig. 1(d). Saldana et al.Reference Saldana, Murthy, Shankar, Stach and Chandrasekar9 reported that the triple junctions formed by CTBs intersecting with GBs could constrain GB migration and thus help to stabilize the microstructure at elevated temperatures.
After heat treatment at 400 °C, very large grains consumed some of the nt columnar grains in the nt Cu. It seems that high energy GBs became mobileReference Gottstein, Shvindlerman and Ralph30 at 400 °C and consumed both the nanotwins and columnar GBs, thus further reducing the total GB energy. At 600 °C, the initial nt columnar grain structure was fully consumed by the very large grains, as verified by FIB surface imaging (not shown). This indicates a continual rapid GB migration at 600 °C. The possible reasons for this rapid GB migration with regard to grain orientation are discussed in Sec. III. D.
D. Grain orientation
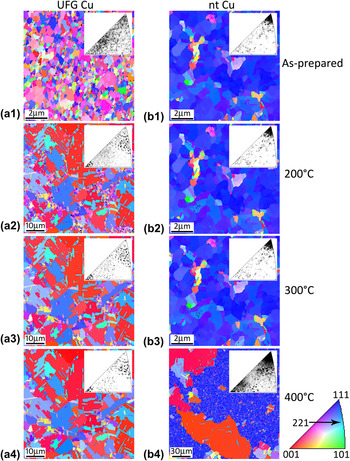
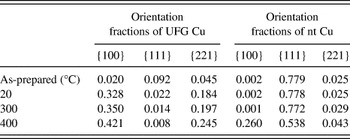
The top surface inverse pole figure maps at various temperatures for both types of samples are presented in Fig. 7; each color represents a specific grain orientation as indicated in the triangle on the bottom right of the figure, and the orientation {hkl} of a grain means that the crystal direction <hkl> of this grain is normal to the foil surface. Figure 7(a1) indicates that the as-prepared UFG Cu had nearly random grain orientations. After heat treatment at 200 °C, however, the random orientations changed and concentrated around {100} and its twin orientation {221} as observed in Fig. 7(a2). This drastic change could be due to the fact that randomly oriented grains are reportedReference Anderoglu, Misra, Wang and Zhang6, Reference Kobiyama, Inami and Okuda11 to have more disordered and high energy GBs than textured grains and, therefore, could be less thermally stable. Consequently, the high energy GBs in UFG Cu were eliminated by GB migration at 200 °C, and the {100} and {221} orientations were prevalent due to the formation of annealing twins. After heat treatments at 300 and 400 °C [Figs. 7(a3) and 7(a4)], these twinned orientations were still present with a more concentrated orientation distribution, meaning that a larger percentage of the grains had {100} or {221} orientations. To quantify the changes in grain orientation, Table II shows the area fractions of {100}, {111}, and {221} grain orientations in UFG Cu and nt Cu before and after each heat treatment. We can see from Table II that for UFG Cu, the fractions of {100} and its twin orientation {221} increased with increasing temperature.
Top surface EBSD inverse pole figure maps of UFG Cu (a1) as-prepared, and after (a2) 200 °C, (a3) 300 °C, and (a4) 400 °C heat treatments; nt Cu (b1) as-prepared, and after (b2) 200 °C, (b3) 300 °C, and (b4) 400 °C heat treatments. The inset of each map is the inverse pole figure, and the triangle on the bottom right indicates the crystallographic orientation of the maps and insets.

Area fractions (EBSD) of typical orientations on the top surfaces of UFG Cu and nt Cu before and after each heat treatment.

For nt Cu, one must study two distinct stages: below and above 400 °C. Below 400 °C, the nt columnar grain structure was stable and retained a strong {111} texture with a few other orientations, as shown in Figs. 7(b1)–7(b3) and Table II. This {111} texture contributes to the thermal stability in two ways: first, it is reportedReference Anderoglu, Misra, Wang and Zhang6, Reference Kobiyama, Inami and Okuda11 that textured microstructures may have lower overall GB energy and thus higher thermal stability. In our study, the as-prepared textured nt Cu had a higher fraction of low angle columnar GBs, as compared with as-prepared UFG Cu, which could lead to lower overall GB energy and thus lower driving force for grain growth. Second, {111} grain orientation has the minimum surface energy density in Cu and therefore is more thermally stable considering surface energy minimizationReference Zhang, Xu and Ji12, Reference Ma, Zhang and Xu13; however, this should be a minor factor since surface energy minimization is only dominant in thin (t < 5 μm) metallic films, while our sample is much thicker (t ∼ 65 μm).Reference Sonnweber-Ribic, Gruber, Dehm and Arzt21, Reference Thompson and Carel22 Above 400 °C, Table II indicates that while {111} grain fraction decreases from 0.772 to 0.538, there is a large increase in the {100} grain fraction from 0.001 to 0.260. This rapid {100} grain growth [also see Fig. 7(b4)] seems to be facilitated by the enhanced GB mobilityReference Gottstein, Shvindlerman and Ralph30 at 400 °C, to the extent that at 600 °C, the nt columnar grain structure was totally consumed. Part of the reason for the rapid grain growth after 400 °C heat treatment could be due to the highly mobile GBs of {100} grains. The GBs separating the {100} and {111} grains were mostly high angle (>50°) highly mobile ordinary GBs, which facilitated the rapid {100} grain growth during heat treatments above 400 °C.
An interesting point to notice is that {100} grains were prevalent in both UFG Cu and nt Cu foils even after 400 °C heat treatment, while the growth of its annealing twin {221} is more active in UFG Cu than in nt Cu (see Table II). Previous research on FCC films attached to a rigid substrate provided calculations,Reference Zhang, Xu and Ji15 which showed that {100} grains have a minimum strain energy under biaxial strain during heating and would grow to consume grains of other orientations to minimize the elastic strain energy; however, since our foils are freestanding, it is not clear if this energy minimization argument still holds during our heat treatments. The instability of nt Cu above 400 °C is in contrast to the findings of Anderoglu et al.Reference Anderoglu, Misra, Wang and Zhang6 who showed higher thermal stability in their nt Cu up to 800 °C. However, their nt Cu had low angle (∼9°) columnar GBs, while our nt Cu had many high angle (typically 35–55°) ordinary columnar GBs, which provided a higher driving force for GB migration. It is also suggested that by decreasing twin thickness, the number of triple junctions increases, so that the nt columnar grains could be more thermally stable; nevertheless, the total GB energy also increases with decreasing twin thickness, which can reduce thermal stability. Therefore, there could be a specific twin thickness that will allow for optimum thermal stability.
IV. CONCLUSIONS
In this study, the effect of nanotwins on thermal stability was evaluated. Two distinct UFG copper samples processed by magnetron sputtering were compared, and it was observed that the presence of nanotwins appears to change the initial GB structure and grain orientation. The sample with a highly nt structure had a higher number of CTBs and a strong {111} texture, while the other sample had few CTBs and a more randomly distributed orientation. The higher thermal stability of nt Cu was attributed to the presence of low energy CTBs, large number of triple junctions, and strongly textured {111} grain structure. However, heat treatment at 400 °C provided sufficient GB mobility for rapid {100} grain growth. Therefore, it is concluded that although the highly nt structure is only stable up to 300 °C, the presence of nanotwins does improve the thermal stability by modifying the initial GB structure and grain orientation.
ACKNOWLEDGMENTS
This work was performed under the auspices of NSF Grant No. NSF-DMR-0955338. Sample characterization and preparation were partly carried out with the support of the Karlsruhe Nano Micro Facility, a Helmholtz Research Infrastructure at Karlsruhe Institute of Technology. The authors would like to thank Dr. Troy Barbee at LLNL for preliminary samples and helpful discussions regarding sample synthesis.