Implications
Phosphorus (P) of agricultural origin (primarily from fertiliser and feeds) contributes to eutrophication of waterways. A 4-year experiment was conducted to examine the long-term impact of reducing the P content of dairy cow concentrates on cow performance. Neither food intake, milk production or cow fertility were affected when dietary P levels were reduced by approximately 25% over this 4-year period. Reducing the P content of dairy cow diets has the potential to reduce P loss to the environment.
Introduction
An inevitable consequence of the increasing intensification of the UK livestock sector during the last 50 years has been the production of increasing quantities of slurry and manure. While normally disposed of by land spreading, spreading of manures in excess of plant requirements, or at times of the year when plant requirements are low, or weather and soil conditions are unsuitable, can result in the loss of nitrates and phosphates to waterways. In addition to a loss of valuable nutrients from agricultural systems, nitrates and phosphates can also lead to nutrient enrichment (eutrophication) of both fresh and coastal waters.
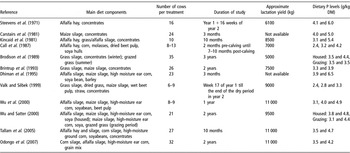
While the adoption of improved manure spreading practices can reduce nutrient loss to the environment, it is also possible to reduce the quantity of nutrients excreted by livestock through dietary modification. Within the dairy sector, reducing the phosphorus (P) content of dairy cow diets has the potential to reduce P excretion. A number of studies have examined low P diets for dairy cows, with key details of most of the studies published during the last 35 years summarised in Table 1. While a dietary P level of 2.4 g/kg dry matter (DM) was clearly inadequate (Call et al., Reference Call, Butcher, Shupe, Lamb, Boman and Olson1987; Valk and Sěbek, Reference Valk and Sěbek1999), P deficiency symptoms were observed in a number of studies involving dietary P levels between 3.1 and 3.3 g P/kg DM (Kincaid et al., Reference Kincaid, Hillers and Cronrath1981; Call et al., Reference Call, Butcher, Shupe, Lamb, Boman and Olson1987; Wu et al., Reference Wu, Satter and Sojo2000), but not in others (Valk and Sěbek, Reference Valk and Sěbek1999; Brintrup et al., Reference Brintrup, Mooren, Meyer, Spiekers and Pfeffer1993). Dietary P levels between 3.5 and 4.2 g P/kg DM proved to be adequate in most studies. However, many of these studies have been criticised by Hemmingway (Reference Hemmingway2002) for a number of reasons, including their relatively short-term nature (less than 2 years). This is of concern as cows have the ability to deplete skeletal phosphorus reserves for milk production over a number of lactations, and as such, deficiency symptoms may not arise in the short term. In addition, most of these studies were undertaken using diets which did not contain grass or grass silage, while in addition, a number of the studies involved total confinement systems. This is of particular concern as the availability of P from different feedstuffs (concentrates, maize silage, alfalfa silage, grazed grass) may vary, while the availability of P from many feeds still does not appear to have been defined with certainty (NRC, 2001). Low P diets have been examined previously in grassland-based systems (Brodison et al., Reference Brodison, Goodall, Armstrong, Gordon, McCaughey and Todd1989), although this study involved relatively low-yielding dairy cows (5000 l per cow per lactation) that are not representative of those in most dairy herds today.
Summary of key dairy cow production studies involving different levels of dietary phosphorus

DM = dry matter.
Phosphorus feeding recommendations within the UK have undergone a number of changes during the last 40 years (Agricultural Research Council (ARC), 1965 and 1980; Agricultural and Food Research Council (AFRC), 1991). Indeed the current recommendations (AFRC, 1991) recognise that many aspects of P nutrition and metabolism are not well understood, and include a recommendation that dairy cow P requirements should be validated in long-term feeding trials using roughage-based diets. However, to date, this recommendation does not appear to have been addressed within grassland-based production systems. Thus, in an attempt to validate the current UK recommendations (AFRC, 1991), and to address some of the limitations of the studies presented in Table 1 (duration of study, cow yield potential and basal forage type), a 4-year experiment was conducted within a predominantly grassland-based system with the aim of examining the effect of offering diets containing ‘low’ P levels on dairy cow performance.
Material and methods
Animals
One hundred primiparous, winter-calving, Holstein-Friesian dairy cows (mean predicted transmitting ability for fat + protein yield (PTA2005 for fat + protein) of 25.3 (s.d. 7.09) kg) were used to examine the impact of dietary P content on cow performance. The experiment was conducted over a 4-year period (years 1 to 4). Eighty cows commenced the experiment in year 1 (Group 1), while 20 cows commenced the experiment in year 2 (Group 2). Group 1 and Group 2 cows completed a maximum of 4 or 3 lactations on the experiment respectively (until the end of year 4), although many cows were culled prior to the end of year 4. Cows had mean calving dates of 7 November, 15 November, 29 November and 9 December in years 1 to 4 respectively.
Treatments
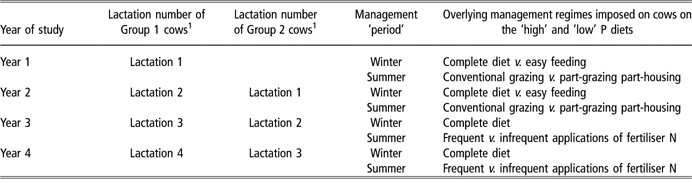
Within 36 h of calving, primiparous cows were allocated to either a ‘high’ P or ‘low’ P dietary treatment (50 cows per treatment), with cows remaining on the same P treatment until the end of the experiment (year 4), or until culled. Cows on each of the two dietary treatments were managed on equal concentrate feed levels throughout, with the two dietary P levels obtained by changing the P content of the concentrate feedstuff offered. Each year of the study comprised a ‘winter period’, a ‘summer period’, a ‘late lactation period’ and a ‘dry period’. As part of a separate series of studies, an equal number of cows from each P treatment were offered their ‘winter period’ ration via two different feeding systems in years 1 and 2 (common feeding system in years 3 and 4), and were managed on two different ‘summer period’ management regimes in each of years 1 to 4, as described in detail later. An overview of the experimental timetable and overlying management regimes is presented in Table 2.
Overview of the experimental timetable, including management regimes imposed on cows on the ‘high’ and ‘low’ dietary P treatments
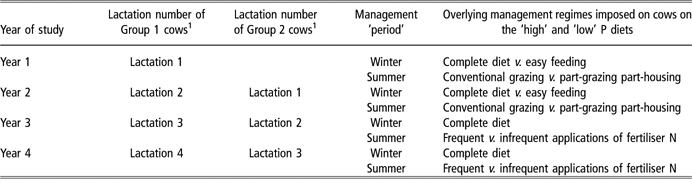
1Eighty cows (Group 1) and 20 cows (Group 2) commenced the experiment in each of years 1 and 2, respectively.
Complete diet: silage and concentrates offered as a mixture; Easy feeding: silage and concentrates offered separately.
Winter period
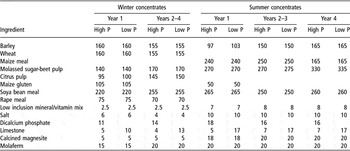
Cows were housed in cubicle accommodation throughout the winter periods, and offered rations comprising grass silage (both primary growth and primary regrowth), maize silage and concentrates. The grass silages were mainly produced from primary growth and primary re-growth herbages, with these harvested from perennial ryegrass-based swards using a precision chop forage harvester. The maize silages were introduced into the ration of freshly calved cows (approximately 0.30 of forage DM) from 10 November, 13 November, 13 October and 28 September onwards, in years 1 to 4 respectively. Concentrate levels were increased incrementally during the first 10 to 20 days post-calving. From calving to day 5, day 6 to 10, day 11 to 20 and from day 20 onwards, concentrate feed levels were 4.0, 6.0, 8.0 and 10.0 kg/day respectively in year 1, and 4.0, 6.0, 8.0 and 10.4 kg/day (primiparous cows), and 6.0, 8.0, 10.0 and 13.0 kg/day (multiparous cows) respectively, in year 2, while levels in years 3 and 4 were 6.0 (days 1 to 5), 8.0 (days 6 to 10) and 11.0 kg/day (day 11 onwards). The ingredient composition of the high and low P concentrates offered during the winter period are presented in Table 3. The high P winter concentrates were designed to have a P content of approximately 7.2 g/kg DM, the mean P content of a sample of commercial concentrate feedstuffs (n = 40) collected from dairy farms around Northern Ireland between 1999 and 2000 (C. P. Ferris, unpublished data). The P content of the low P winter concentrate (approximately 4.2 g P/kg DM) was designed so that the overall ration P content would be approximately 3.6 g P/kg DM, proportionally 0.25 lower than for the ‘high’ P diet. This was a level which published studies (Table 1) suggested should be adequate, but which would still represent a considerable reduction in P input, compared to the ‘current practice’ high P treatment. Both the high and low P concentrates were formulated to contain low P levels, with dicalcium phosphate added to the high P concentrate so as to increase its P content. Of the daily concentrate allowance, 0.5 kg/day (year 1) and 1.0 kg/day (years 2 to 4) was offered in the milking parlour during milking, split between two equal feeds, while the remainder of the daily concentrate allowance was offered as described below.
Ingredient composition of concentrate feedstuffs offered throughout the experiment (kg/t, fresh basis)

High P: High phosphorus; Low P: low phosphorus.
In years 1 and 2, feedstuffs were offered via either an ‘easy feed’ or ‘complete diet’ type system. With the former, the forage components of the ration were offered as whole blocks of silage along moveable feed barriers, while the concentrate component of the ration was offered via electronic out-of-parlour feed stations. With the complete diet system, the forage and concentrate components were offered daily in the form of a complete diet, which was prepared using a mixer wagon. Daily concentrate inputs into the wagon were calculated according to the number of days that each animal in the group had calved, as described earlier. The complete diet was transferred from the mixer wagon into a series of feed boxes, with access to each box controlled via a Calan gate feeding system linked to automatic cow identification, thus permitting automated recording of individual animal food intakes (Forbes et al., Reference Forbes, Jackson, Johnson, Stockhill and Hoyle1986). The complete diets and the forage components of the rations with the easy feed systems were offered ad libitum. Full details of each of these two feeding systems (easy feed and complete diet) have been described by Ferris et al. (Reference Ferris, Frost, Binnie and Patterson2006). In year 1, 32 and 48 cows were offered food via the easy feed system and complete diet system respectively (16 of the cows offered the complete diet were used in serial nutrient utilisation studies as described elsewhere), while in year 2, 40 cows were offered food via each of the two feeding systems. An equal number of cows from the ‘high’ and ‘low’ P treatments were allocated to each of the two winter-feeding regimes. During the winter periods of years 3 and 4, all cows were offered feed via the complete diet system, with cows accessing feed via Calan gates. The mean length of the winter periods (calving to start of turnout) was 157, 132, 120 and 97 days in years 1 to 4, respectively.
Summer period
Cows commenced grazing on 5 April, 9 April, 30 March and 29 March in years 1 to 4, respectively, and were given access to grazing for periods of increasing duration, so that they were grazing from morning milking through to evening milking within 7 days of turnout. Thereafter, concentrate feed levels were gradually reduced from the winter levels described earlier, so that at full-time turnout (2 May, 5 May, 20 April and 30 April in years 1 to 4, respectively), concentrate feed levels were 6.0 kg/day in each of years 1, 3 and 4, and 4.0 (primiparous) and 5.0 (multiparous) kg/day in year 2. At this point, the winter concentrates were completely replaced by grazing concentrates (ingredient composition, Table 3) which differed in P content. During the 3-week period after full-time turnout, concentrate feed levels were gradually reduced to 4.0 kg/day in years 1 and 3, and 3.0 kg/day in years 2 and 4. It was planned that these concentrate levels would be maintained throughout the grazing periods until cows were either dried off or re-housed. However in year 4, concentrate feed levels were increased to 4.0 kg/day from 20 June onwards as a consequence of grass shortages. During the summer period, all concentrates were offered in the milking parlour during milking, split between two equal feeds each day.
In each of years 1 and 2, cows from each of the two P treatments were divided equally between either a conventional grazing regime (access to grazing both ‘day’ and ‘night’) or a part-grazing (PG) part-housing regime (cows grazed during the ‘day’ and were housed at ‘night’ and given ad libitum access to grass silage via a feed barrier). Cows on both treatments were rotationally grazed. Total inorganic nitrogen (N) application rates across the season were approximately 300 and 340 kg N/ha in years 1 and 2 respectively. Full details of each of these two grazing regimes have been described by Ferris et al. (Reference Ferris, Binnie, Frost and Patterson2008a).
In each of years 3 and 4, cows on each P treatment were again divided equally between two different grazing treatments which differed only in the frequency of application of fertiliser N. In one treatment, fertiliser N was applied to all grazing paddocks on a single occasion at the start of each grazing cycle, while with the other treatment, fertiliser was applied thrice weekly, within 2 or 3 days of each paddock having been grazed. Across each grazing season, total N applications for each of the two grazing treatments were identical, with total applications of 357 (year 3) and 244 kg N/ha (year 4). Full details of these two fertiliser application treatments have been presented by Ferris et al. (Reference Ferris, McCoy and Patterson2008b). No inorganic P fertiliser was added to any of the grazing areas during years 1 to 4, a consequence of the high soil P status of the grazing areas.
Late lactation period
From 10 October, 29 September, 15 October and 1 October in years 1 to 4, respectively, cows were housed at night and offered grass silage, while continuing to graze during the day. Cows were fully housed on 19 October, 20 October, 22 October and 19 October in years 1 to 4 respectively. During this late lactation period, from re-housing until drying off, concentrate feed levels were maintained at 4.0 (years 1 to 3) and 3.0 (year 2) kg/day, while the concentrates and silages offered were those offered to freshly calved cows in the subsequent lactation.
Dry period
Throughout the study, cows were dried off either 8 weeks pre-calving, or if weekly average milk yields fell below 5.0 kg/day. Cows dried off during the grazing period were removed from their experimental group, and grazed in a single ‘dry cow group’ without supplementation. Cows within 2 weeks of calving were brought indoors and offered grass silage plus 2.0 kg/day of a dry cow concentrate until calving. The ingredient composition of this dry cow concentrate, on a kg/t air dry basis, was as follows: barley 610, soya bean meal 310, dry cow mineral/vitamin mix 35, molaferm 65. All other dry cows were housed from early to mid October. Once re-housed, all dry cows were offered 2.0 kg/day of the dry cow concentrate until calving. Treatment of cows on the ‘high’ and ‘low’ P diets was identical during the dry period. Dry cows were offered the same grass silages as offered to the cows in late lactation during each year of the experiment, although individual cow intakes were not recorded.
Breeding and culling
Throughout the experiment the breeding season commenced during the first week of December, and finished on 10 May, 10 June, 20 June and 20 June in years 1 to 4 respectively. Cows were bred by artificial insemination throughout the breeding season. Cows were removed from the study as ‘infertile’ if they were not in-calf when artificial insemination was stopped, with these cows remaining on their P treatments for the mean number of days, on average, as the pregnant cows on that treatment. Cows were culled during and on completion of each year of the experiment. Culled cows were not replaced.
Measurements
Cows were milked twice daily, between 0630 and 0830 h, and between 1600 and 1800 h, with milk yields recorded automatically at each milking. On alternative weeks during each of years 1 and 2, milk samples, in proportion to yield, were taken at each milking for three consecutive days. During years 3 and 4, milk samples from two consecutive milkings were taken during a single 24 h period each week. The fortnightly 3-day composite sample for each cow (years 1 and 2), and the two individual weekly samples for each cow (years 3 and 4), were analysed for fat, protein and lactose using a Milkoscan (Model 605; Foss Electric, Hillerød, Denmark). In years 3 and 4, a weighted milk composition for the 24 h sampling period was subsequently calculated. Throughout the experiment, milk samples, in proportion to yield, were taken from each cow during two successive milkings once every 4 weeks, bulked and analysed for P concentration. Within each lactation, total milk production during the winter period, the grazing/late lactation period and the full lactation period, were calculated for each cow, and a weighted mean for compositional data calculated for each of these periods.
The Calan gate feeding system allowed individual feed intakes to be measured during the winter period for those cows offered food in the form of a complete diet in years 1 and 2, and for all cows in each of years 3 and 4. Mean intakes of each dietary component were subsequently calculated for each cow during the course of each winter period. Mean daily herbage DM intakes during the main grazing season were calculated fortnightly for each cow from animal performance data, and the mean daily intake over the grazing season subsequently calculated. Within this calculation, milk energy content was determined from fortnightly milk samples using the equations of Tyrrell and Reid (Reference Tyrrell and Reid1965), while mean daily live-weight change over the grazing period was determined by linear regression of weekly live-weight data. Total energy required for maintenance, production, tissue change, pregnancy (where appropriate) and walking (assumed as 2.0 km/day for cows grazing full time, and 1.0 km/day for cows housed at night) was determined using the equations contained within ‘Feed into Milk (FIM)’, the UK dairy cow feed rationing system (Agnew et al., Reference Agnew, Yan, France, Kebreab and Thomas2004). The metabolisable energy (ME) content of herbage was calculated from its acid detergent fibre (ADF) content using the equation described by Givens et al. (Reference Givens, Everington and Adamson1990), while the ME content of the concentrates offered was assumed as 12.4 MJ/kg DM (based on published values for individual ingredients: AFRC, 1993). With treatment PG, silage ME content was determined as 0.84 digestible energy (the latter determined using sheep fed at maintenance), with silage ME content corrected for feeding level, as described by Agnew et al. (Reference Agnew, Yan, France, Kebreab and Thomas2004). In the absence of silage DM intakes for individual cows with treatment PG, the mean silage DM intake for each 2-week period was applied individually to all cows.
Cow live weights and body condition scores were recorded weekly throughout each lactation, with condition scores assessed on a 1 to 5 scale (Edmonson et al., Reference Edmonson, Lean, Weaver, Farver and Webster1989). A mean live weight and condition score for each cow was subsequently calculated for weeks 1 to 10, 11 to 20, 21 to 30 and 31 to 40 of each lactation. Backfat thickness was measured between the 12th and 13th rib, lateral to the vertebral column and parallel to the ribs, at 4-week intervals throughout each lactation. Backfat thickness was determined as the mean of three measurements taken over the longissimus dorsi, namely at the quarter, mid point and three-quarters positions of the breadth of the muscle. The methodology and ultrasonic scanning equipment used were as described by Ferris et al. (Reference Ferris, Gordon, Patterson, Mayne and Kilpatrick1999). A mean backfat thickness measurement for months 1 to 3, 4 to 6 and 7 to 9 of each lactation, was subsequently calculated for each cow.
Blood samples were taken from the tail of each cow, between 0900 and 1030 h, at weeks 2, 4, 6, 8, 10 (±3 days), 20, 30 and 40 (±7 days) post-calving in each year of the experiment. Blood plasma was subsequently analysed for non-esterified fatty acids (NEFA) (using a Wako kit; Wako Chemicals GMBH, Germany), calcium, P and glucose (using Olympus kits; Olympus Life and Material Science Europa, Germany) using a Chemistry Immuno Analyser (Olympus AU640).
Silages (grass and maize) were sampled daily and analysed for oven dry matter (ODM) concentrations, while twice weekly, fresh samples were analysed for gross energy (GE), N, ammonia nitrogen, pH and volatile components. Dried samples (twice weekly) were bulked for each 2-week period and analysed for calcium (Ca) and P concentrations, while dried samples bulked for each 4-week period were analysed for neutral detergent fibre (NDF), ADF, ash and water-soluble carbohydrate (WSC) concentrations. In addition, maize silage samples, dried at 60°C twice weekly, were bulked for each 4-week period, and analysed for starch. Each 1 t batch of concentrate produced was sampled, with the samples bulked for each 2-week period (for milking cow rations), dried and analysed for Ca and P, while samples bulked for each 4-week period were analysed for N, ADF, NDF, GE and ash concentrations. A single bulked sample of the dry cow concentrate offered during each year of the experiment was analysed for P concentration. The feeds offered were analysed as described by Ferris et al. (Reference Ferris, Gordon, Patterson, Mayne and Kilpatrick1999), with two exceptions: the GE concentration of silages was determined on a fresh sample, as described by Porter (Reference Porter1992), while Ca and P analysis was as follows. Feedstuffs offered during year 1 were analysed for Ca and P, after acid digestion, using a Varian (Liberty Series II) Inductively Coupled Plasma Atomic Emissions Spectrometer (ICP-AES) (Varian, CA, USA). All other samples during the course of the study were analysed for phosphate using a Perkin Elmer Flow Injection Analyser (Model FIAS 300), with the measurement of the resultant molybdenum blue complex conducted at 700 nm via a Perkin Elmer Lambda 2 Spectrophotometer (Perkin, MA, USA). Calcium was determined via a Perkin Elmer Atomic Absorption Spectrophotometer (Model 2380).
Statistical analysis
Data from this two-treatment continuous design experiment were analysed using GenStat, Version 11.1 (Payne et al., Reference Payne, Murray, Harding, Baird and Soutar2008). The effect of dietary P level on cow performance was analysed separately within each of lactations 1, 2, 3 and 4, with the analysis taking account of the fact that data for each of lactations 1 to 3 were recorded over two different years (years 1 and 2). Data describing mean food intake, milk output and milk composition, mean live weight and condition score (for each 10-week period) and mean backfat thickness (for each 3-month period), were analysed by ANOVA, as a two-treatment completely randomised design, with unequal number of replicates. Milk output data for each winter period, grazing/late lactation period and full lactation period, were analysed using period length in days (for each individual cow), as covariates. Blood parameters measured during weeks 2, 4, 6, 8, 10, 20, 30 and 40 post-calving were subject to repeated measures analysis using the restricted maximum likelihood (REML) procedure, with the effect of P level, and interactions between P level and sample week examined within each lactation. Interactions between dietary P level and winter period (complete diet v. easy feed: years 1 and 2) and summer period (conventional grazing v. PG part-housing, and different fertiliser sowing frequencies: years 1 and 2, and year 3 and 4, respectively) management regimes were initially tested for, and found to be non-significant. Subsequently, these management regimes were not taken into account in the statistical analysis, as cows on each dietary P level were divided equally between the different management regimes.
Results
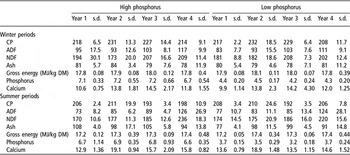
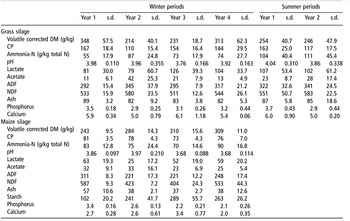
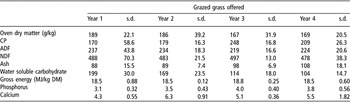
Over the 4 years of the experiment, high and low P winter concentrates had mean P concentrations of 7.1 and 4.4 g/kg DM respectively, while high and low P summer concentrates had mean P concentrations of 6.8 and 3.5 g/kg DM respectively (Table 4). The dry cow concentrate had a mean P concentration of 6.7 g/kg DM. Grass silages offered within the experiment were variable in composition (Table 5), with DM ranging from 214 to 348 g/kg, and CP concentrations ranging from 110 to 167 g/kg DM. Across the four winter periods of the study, the mean P concentration of the grass silages offered was 3.17 g/kg DM. The mean starch content of the maize silages offered over the course of the experiment ranged from 102 to 289 g/kg DM, while the mean P concentration of the maize silages offered was 2.6 g/kg DM. Herbage grazed during the study had a mean P concentration of 3.6 g/kg DM (Table 6).
Chemical composition of the ‘high’ and ‘low’ phosphorus concentrate feedstuffs offered throughout the experiment (g/kg DM, unless stated otherwise)

DM = dry matter; CP = crude protein; ADF = acid detergent fibre; NDF = neutral detergent fibre.
Chemical composition of grass silages and maize silages offered throughout the experiment (g/kg DM, unless stated otherwise)

DM = dry matter; CP = crude protein; ADF = acid detergent fibre; NDF = neutral detergent fibre.
Chemical composition of grazed grass offered during the experiment (g/kg DM, unless stated otherwise)

DM = dry matter; CP = crude protein; ADF = acid detergent fibre; NDF = neutral detergent fibre.
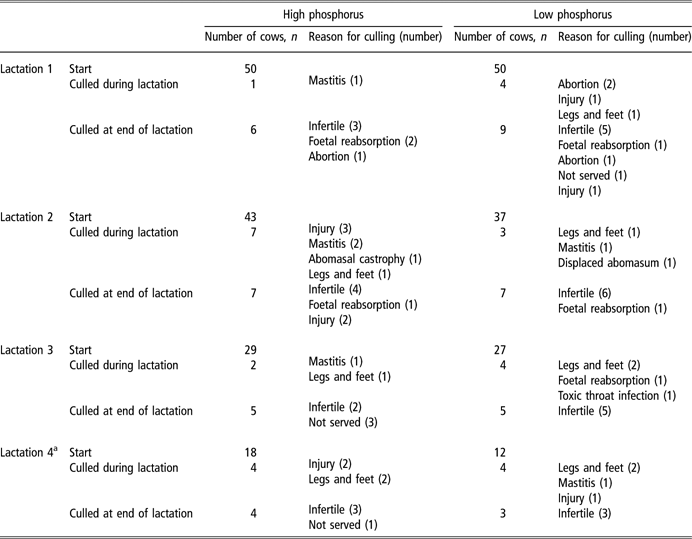
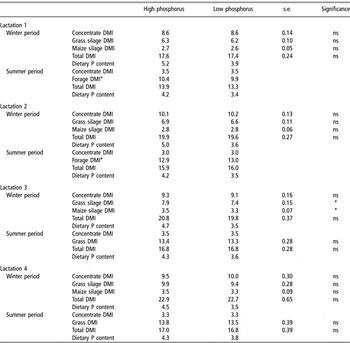
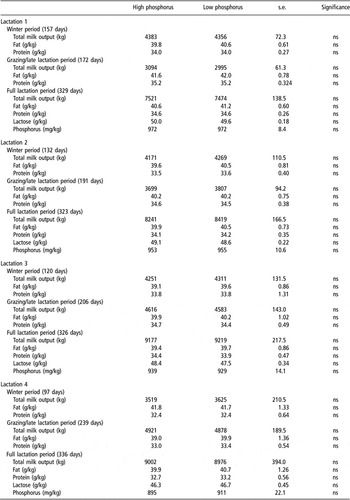
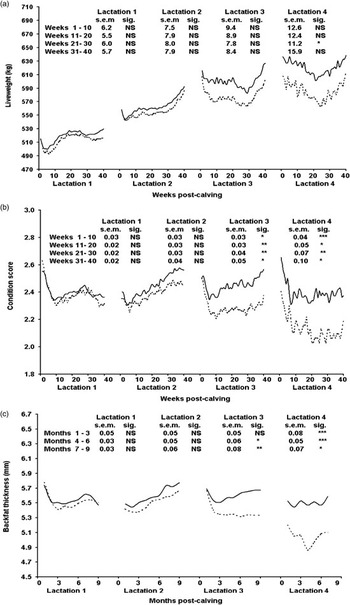
Details of cows removed during, and on completion of each year of the study, are presented in Table 7. A total of 95 (49 ‘high’ P, 46 ‘low’ P), 70 (36 ‘high’ P, 34 ‘low’ P), 50 (27 ‘high’ P, 23 ‘low’ P) and 22 (14 ‘high’ P, 8 ‘low’ P) cows completed each of lactations 1 to 4 respectively. Phosphorus treatment had no significant effect (P > 0.05) on total DM intake measured during any of the winter periods (Table 8), although intakes of grass silage and maize silage (lactation 3) were significantly lower with cows on the ‘low’ P diets (P < 0.05). Intakes during the summer period were not significantly affected by treatment in either lactations 3 or 4. Across the four lactations examined, the mean P content of the ‘high’ and ‘low’ P winter diets was 4.8 and 3.6 g P/kg DM respectively, while the mean P content of the ‘high’ and ‘low’ P summer diets was 4.2 and 3.5 g P/kg DM respectively. Dietary P level had no significant effect (P > 0.05) on either milk output or milk composition during the winter periods, grazing/late lactation periods or total lactation periods, in any of lactations 1 to 4 (Table 9). With the exception of weeks 21 to 30 post-calving in lactation 4 (P < 0.05), mean live weight (Figure 1a) was unaffected by treatment (P > 0.05). Mean condition score (Figure 1b) was unaffected by treatment in either of lactations 1 or 2, while being significantly lower (P < 0.05) with cows offered the ‘low’ P diet in lactations 3 and 4. A similar trend was observed with backfat thickness (Figure 1c), with cows offered the ‘low’ P diet having a significantly lower backfat thickness during months 4 to 6 and 7 to 9 of lactation 3, and throughout all of lactation 4 (P < 0.05).
Reasons for culling cows managed on the ‘high’ and ‘low’ phosphorus diets during each of lactations 1 to 4
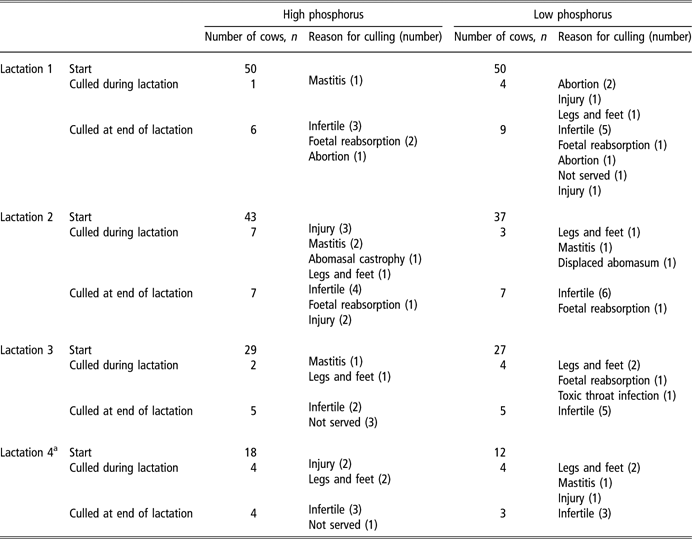
aYear 4 cows only.
Effect of dietary P level on food intake (kg DM/cow per day) and on dietary P content (g/kg DM), during each of the winter and summer periods during lactations 1 to 4

DM = dry matter; DMI = DM intake.
aIncludes grass silage component for cows housed at night in years 1 and 2.
ns: not significant; *P < 0.05.
Effect of dietary phosphorus level on milk production and milk composition during the winter period, grazing/late lactation period and full lactation period, in each of lactations 1 to 4

ns: not significant.
Effect of dietary phosphorus level (high phosphorus _____ ; low phosphorus - - - - -) on the (a) live weight, (b) condition score and (c) back-fat thickness of dairy cows over four successive lactations (NS: not significant; *P < 0.05; **P < 0.01; ***P < 0.001).

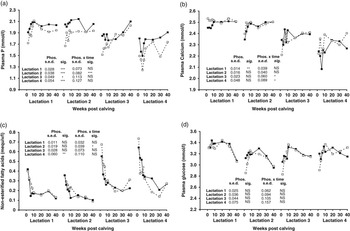
In each of lactations 1 to 4, cows offered the ‘low’ P diets had significantly lower (P < 0.05) plasma P concentrations compared to those offered the ‘high’ P diets (Figure 2a), while there was a significant interaction between dietary P level and weeks post-calving, in lactation 2 (P < 0.001). With the exception of lactation 1 (P < 0.01), dietary P level had no significant effect on plasma Ca content (P > 0.05), although there was a significant interaction between diet and weeks post-calving in lactations 3 and 4 (P < 0.05) (Figure 2b). Within each lactation, plasma NEFA concentrations declined rapidly during the first 10 weeks post-calving (Figure 2c), although with the exception of lactation 4 (P < 0.01), dietary P concentration had no effect on NEFA concentrations (P > 0.01). While plasma glucose concentrations tended to increase rapidly during the first 10 weeks post-calving (Figure 2d), declining slowly thereafter, concentrations were unaffected by dietary P (P > 0.05).
Effect of dietary phosphorus level (high phosphorus —▪—; low phosphorus, - - □ - -) on (a) plasma phosphorus, (b) plasma calcium, (c) plasma non-esterified fatty acids and (d) plasma glucose concentrations, over four successive lactations (NS: not significant; *P < 0.05; **P < 0.01; ***P < 0.001). Phos. = phosphorus.

Discussion
This experiment was designed to examine the effect of dietary P level on dairy cow performance within medium-input grassland-based milk production systems. In addition, the experiment was conducted over four successive lactations, and appears to be unique in this respect. While only 22 cows (14 and 8 from the ‘high’ P and ‘low’ P treatments, respectively) completed four full lactations on the study (Table 7), this is comparable to the total number of cows used in a number of short-term studies (Table 1). Infertility represented the most common reason for cows being removed from the study, with the impact of P level on cow fertility within this experiment examined in the companion paper (Ferris et al., Reference Ferris, Patterson, McCoy and Kilpatrick2009).
Cow performance
Across lactations 1 to 4, the mean P content of the ‘high’ and ‘low’ P diets were 4.8 and 3.6 g P/kg DM respectively (winter period), and 4.2 and 3.5 g P/kg DM respectively (summer period). Total DM intake (kg/day) during the winter period was unaffected by level of P in the diet during any of the lactations 1 to 4. However, reduced intakes have been observed after approximately 6 (Call et al., Reference Call, Butcher, Shupe, Lamb, Boman and Olson1987) and 20 weeks (Valk and Sěbek, Reference Valk and Sěbek1999) of diets containing 2.4 g P/kg DM, being offered. Kincaid et al. (Reference Kincaid, Hillers and Cronrath1981) and Odongo et al. (Reference Odongo, McKnight, KoekKoek, Fisher, Sharpe, Kebreab, France and McBride2007) also observed reductions in food intake when dairy cows were offered diets containing 3.1 and 3.5 g P/kg DM, respectively. However, intakes were unaffected in studies involving dietary P levels between 2.8 and 3.3 g P/kg DM (Call et al., Reference Call, Butcher, Shupe, Lamb, Boman and Olson1987; Brintrup et al., Reference Brintrup, Mooren, Meyer, Spiekers and Pfeffer1993; Valk and Sěbek, Reference Valk and Sěbek1999; Wu et al., Reference Wu, Satter and Sojo2000). The reduction in food intake observed with ‘low’ P diets in the studies highlighted above may be mediated, in part, through an effect on rumen microflora. For example, failing to meet the P requirements of rumen microflora may have a negative effect on ration digestibility and microbial protein synthesis, as reviewed by Breves and Schroder (Reference Breves and Schroder1991), and this in turn may have a negative effect on food intake. However, reduced food intakes have been observed with cows offered ‘low’ P diets, despite ration digestibility being unaffected (Milton and Ternouth, Reference Milton and Ternouth1985; Bortolussi et al., Reference Bortolussi, Ternouth and McMeniman1996). The latter authors have suggested that this may be mediated via an effect at a cell metabolism level. The fact that intakes were unaffected by diet in the current study suggests that neither rumen function nor cell metabolism were adversely affected by dietary P level, with this largely in agreement with the nutrient utilisation data presented by Ferris et al. (Reference Ferris, Patterson, McCoy and Kilpatrick2009).
The reductions in feed intake observed by Kincaid et al. (Reference Kincaid, Hillers and Cronrath1981), Call et al. (Reference Call, Butcher, Shupe, Lamb, Boman and Olson1987) and Valk and Sěbek (Reference Valk and Sěbek1999), with diets containing 3.1, 2.4 and 2.4 g P/kg DM, were accompanied by reductions in milk output. In addition, Call et al. (Reference Call, Butcher, Shupe, Lamb, Boman and Olson1987) observed a lower persistency of milk yield with diets containing 3.2 g P/kg DM, while Wu et al. (Reference Wu, Satter and Sojo2000) observed a reduction in milk yield after cows had been offered a diet containing 3.1 g P/kg DM for 25 weeks, although intake was not affected in either study. While Valk and Sěbek (Reference Valk and Sěbek1999) observed no reduction in milk output in a study involving a dietary P level of 2.8 g P/kg DM, this study was conducted over 1.5 lactations, and excluded the early lactation period in year 1. In agreement with the findings of the current study, there is no evidence of a reduction in milk output in studies involving dietary P levels in excess of 3.3 g/kg DM (Table 1), although all but one of these studies (Brodison et al., Reference Brodison, Goodall, Armstrong, Gordon, McCaughey and Todd1989) were of less than 2 years in duration. Although it is likely that dietary P impacts on milk yield through a reduction in food intake, Valk and Sěbek (Reference Valk and Sěbek1999) observed that the fall in milk yield preceded the decline in intake, perhaps suggesting an effect of dietary P on milk synthesis.
Diet had no significant effect on any of the milk composition parameters examined in the current study, although the effect of dietary P on milk composition in previous studies has been variable. For example, Valk and Sěbek (Reference Valk and Sěbek1999) observed no effect on milk composition in cows that were deficient in P. However, Call et al. (Reference Call, Butcher, Shupe, Lamb, Boman and Olson1987) observed a significant reduction in milk protein content, while Wu and Satter (Reference Wu and Satter2000) observed a trend for lower milk protein contents (during the first year of a 2-year study) when cows were offered a P deficient diet. While there was a trend for milk P concentrations to decline with increasing lactation number in the current experiment, perhaps a reflection of the close relationship between milk P and the milk protein micelle (Wu et al., Reference Wu, Satter and Sojo2000), there was no evidence that diet per se had an effect on milk P concentrations.
The lower body condition score and backfat thickness, which became apparent during lactation 3 with cows offered the ‘low’ P diets, was mirrored by a similar trend in cow live weight. When cows were offered diets containing 2.4 g P/kg DM, Call et al. (Reference Call, Butcher, Shupe, Lamb, Boman and Olson1987) observed a significant reduction in live weight after a 14-week period, while a trend towards a lower live weight was observed by Valk and Sěbek (Reference Valk and Sěbek1999). However, in each of these studies, the reduction in live weight was associated with other symptoms of P deficiency (reduced intakes and milk outputs). In contrast, Wu et al. (Reference Wu, Satter and Sojo2000) observed no significant effect of dietary P level on either condition score or live-weight change during a single lactation study, despite a significant reduction in milk yield in late lactation with cows offered a low P diet. More recently Odongo et al. (Reference Odongo, McKnight, KoekKoek, Fisher, Sharpe, Kebreab, France and McBride2007), with a diet containing 3.5 g P/kg DM, observed a significant reduction in both condition score and live weight of a similar magnitude to those observed in the current study, despite milk production being unaffected. Factors that may have contributed to the condition score and backfat thickness effects in the current study include the numerically higher milk yield with the cows offered the ‘low’ P diet in lactation 2 (178 kg/lactation), a shorter winter-feeding period with cows offered the ‘low’ P diets (14 and 13 days shorter in lactations 2 and 3, respectively), with a consequent reduction in total concentrate inputs, and the numerically higher feed intake (1.0 kg/day, P = 0.061) with cows offered the ‘high’ P diets in lactation 3. However, it is suggested that this effect on body reserves did not arise as a direct consequence of the different dietary P levels imposed.
Blood metabolites
Dietary P level had no significant effect (except in lactation 4) on either glucose or NEFA concentrations, although there was a trend for cows offered the ‘low’ P diet to have lower concentrations of glucose (lactations 1 to 3) and higher concentrations of NEFA (lactations 3 and 4) during the first few weeks post-calving. This suggests a greater degree of negative energy balance with the ‘low’ P diets, in agreement with the trend towards increased levels of tissue mobilisation observed in lactations 3 and 4. Mean concentrations of plasma Ca remained within the normal range for samples collected and analysed within Northern Ireland (2.0 to 2.8 mmol/l; M. McCoy, personal communication) throughout the entire study, and, with the exception of the early part of lactation 1, were not significantly affected by treatment. Dietary P content had no effect on plasma Ca concentration in accord with the findings of Kincaid et al. (Reference Kincaid, Hillers and Cronrath1981) and Wu et al. (Reference Wu, Satter and Sojo2000).
Plasma P concentrations were significantly lower for cows on the ‘low’ P diets in each of lactations 1 to 4, but it was only during weeks 2 to 6 of lactation 4 that P concentrations fell below the normal range for samples collected and analysed within Northern Ireland (1.44 to 2.4 mmol/l; M. McCoy, personal communication). In agreement with the findings of other studies, blood P concentrations tended to be lowest during the post-calving period, increasing thereafter (Wu et al., Reference Wu, Satter and Sojo2000). In addition, there was a trend for plasma P concentrations to decline with increasing lactation number, as observed by Forar et al. (Reference Forar, Kincaid, Preston and Hillers1982). Reduced plasma P concentrations have frequently been observed with cows offered ‘low’ P diets (Brodison et al., Reference Brodison, Goodall, Armstrong, Gordon, McCaughey and Todd1989; Dhiman et al., Reference Dhiman, Satter and Shaver1995; Wu et al., Reference Wu, Satter and Sojo2000; Lopez et al., Reference Lopez, Wu, Satter and Wiltbank2004), although blood P concentrations do not necessarily provide a good indicator of P deficiency in ruminants (Forar et al., Reference Forar, Kincaid, Preston and Hillers1982). For example, plasma P concentrations are influenced by a range of factors (exercise, excitement, time of sampling, time of feeding, time of year, age and site of sampling) as reviewed by Beighle et al. (Reference Beighle, Boyazoglu and Hemken1993). This was highlighted by Wu et al. (Reference Wu, Satter and Sojo2000) who observed similar plasma P concentrations over a range of diets, despite a significant reduction in milk yield with cows offered low P diets. Nevertheless, Call et al. (Reference Call, Butcher, Shupe, Lamb, Boman and Olson1987), with a P-deficient diet containing 2.4 g P/kg DM, observed a significant reduction in plasma P concentrations (mean concentration over the lactation of 1.16 mmol/l), thus highlighting that with very low P diets, plasma P concentrations may be a useful diagnostic tool.
Conclusions
The results of the current experiment demonstrate that within grassland-based systems, dairy cows producing approximately 8000 to 9000 l of milk per lactation can be managed over multiple lactations on winter diets containing between 3.5 and 3.9 g P/kg DM, and summer diets containing 3.4 to 3.8 g P/kg DM without any apparent adverse effects on feed intake, milk output or milk composition. Whilst plasma P concentrations were significantly reduced with cows offered the ‘low’ P diet, levels only fell below the normal range for a brief period during lactation 4. Although cows offered the ‘low’ P diet had lower tissue reserves than those offered the ‘high’ P diet during lactations 3 and 4, this was not associated with a reduction in cow performance, and may have been due to reduced periods of concentrate feeding. The results of this experiment suggest that there is considerable scope to reduce concentrate P concentrations, without having a detrimental effect on cow performance.
Acknowledgements
This experiment was co-funded by the Department of Agriculture and Rural Development for Northern Ireland (DARD), AgriSearch, John Thompsons and Sons Ltd and Devenish Nutrition Ltd. Special thanks to B. Hunter, M. Davies and the staff of the Calf Unit and Dairy Unit for technical assistance, and M. Porter and the laboratory staff for undertaking chemical analysis. The analysis of the P content of feedstuffs by Dr John Bailey (Agri-Environment Branch, AFBI-Newforge) in year 1 is gratefully acknowledged.