INTRODUCTION
Paleohydrologic records from Great Basin pluvial lakes provide a rich source of information enhancing understanding of the character, magnitudes, and rates of past climatic changes (e.g., Smith and Street-Perrott, Reference Smith, Street-Perrott and Porter1983; Benson and Thompson, Reference Benson, Thompson, Ruddiman and Wright1987b; Morrison, Reference Morrison and Morrison1991; Benson, Reference Benson, Gillespie, Porter and Atwater2004; Reheis et al., Reference Reheis, Adams, Oviatt and Bacon2014). Although most of these lakes had evaporated by the end of the Pleistocene, a few small lakes remained that were fed by perennial rivers sourced in high mountains. These extant lakes have continued to record climatic perturbations through the Holocene by altering their depths, surface areas, and volumes according to the water balance of their watersheds.
This article focuses on the late Holocene histories of Walker Lake and the Carson Sink in western Nevada. These lakes were integrated when Lake Lahontan was at high levels during the late Pleistocene but separated during early Holocene desiccation. Throughout the Holocene, however, their histories remained linked by the unusual behavior of the Walker River, which periodically switched course from one terminal basin to the other (Russell, Reference Russell1885; Benson and Thompson, Reference Benson and Thompson1987a, Reference Benson, Thompson, Ruddiman and Wright1987b; Benson et al., Reference Benson, Meyers and Spencer1991; King, Reference King1993, Reference King1996; Adams, Reference Adams2003, Reference Adams2007). Lake-level changes in these basins therefore reflect not only climate changes but also the wandering behavior of the Walker River. Here, new data and interpretations on Holocene lake-level fluctuations at Carson Sink and Walker Lake augment records developed by Benson et al. (Reference Benson, Meyers and Spencer1991), Adams (Reference Adams2003, Reference Adams2007), Bell et al. (Reference Bell, Caskey and House2010), and Bell and House (Reference Bell and House2010). Together with new stratigraphy indicating timing of river diversions, these data refine the climatic and physiographic controls on lake-level history.
The lake-level and river-flow records are then analyzed, with respect to the historical hydrology of these systems, in terms of the timing, rates, magnitudes, and areas of hydrologic change during the late Holocene. In particular, the moisture-sensitive gridded tree-ring database contained within the Living Blended Drought Atlas (LBDA; Cook et al., Reference Cook, Seager, Heim, Vose, Herweijer and Woodhouse2010) assists in the characterization of the duration, magnitude, and geographic extent of wet and dry periods over the last 2000 years. This information enables refinement of shoreline ages and, by simple paleohydrologic modeling, estimates of the rates and magnitudes of past lake-level changes.
REGIONAL SETTING AND HYDROLOGY
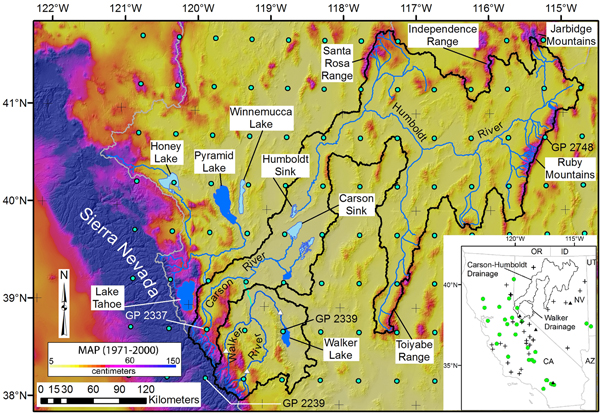
The Carson Sink and Walker Lake represent adjacent subbasins of the pluvial Lake Lahontan system in western Nevada. These lakes were part of a single water body only when levels were above about 1310 m (King, Reference King1993), which is close to the late Pleistocene high-stand elevation (~1332 m) in the area (Adams et al., Reference Adams, Wesnousky and Bills1999). Currently, Walker Lake is fed by a drainage basin extending over about 10,200 km2, with the West Walker and East Walker rivers being the major tributaries that join together to form the Walker River at the south end of Mason Valley before flowing north and then turning south toward Walker Lake (Figs. 1 and 2).
Overview map of the Carson Sink and Walker Lake drainage basins (black lines) showing the locations of features and sites mentioned in the text. Background is PRISM (parameter-elevation regressions on independent slopes model) mean annual precipitation (Daly et al., Reference Daly, Halbleib, Smith, Gibson, Doggett and Taylor2008) draped over a hill-shaded digital elevation model. The green dots represent Living Blended Drought Atlas (LBDA) grid points from Cook et al. (Reference Cook, Seager, Heim, Vose, Herweijer and Woodhouse2010), with labels indicating the ones used in this study. The inset map shows the distribution of tree-ring chronologies utilized in the LBDA with chronologies extending over the last 500 yr shown by black crosses, chronologies covering the years AD 500–1500 shown by filled green circles, and chronologies that are older than AD 500 shown by filled black triangles. (For interpretation of the references to color in this figure legend, the reader is referred to the web version of this article.)

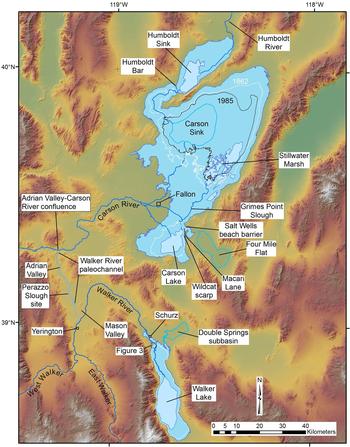
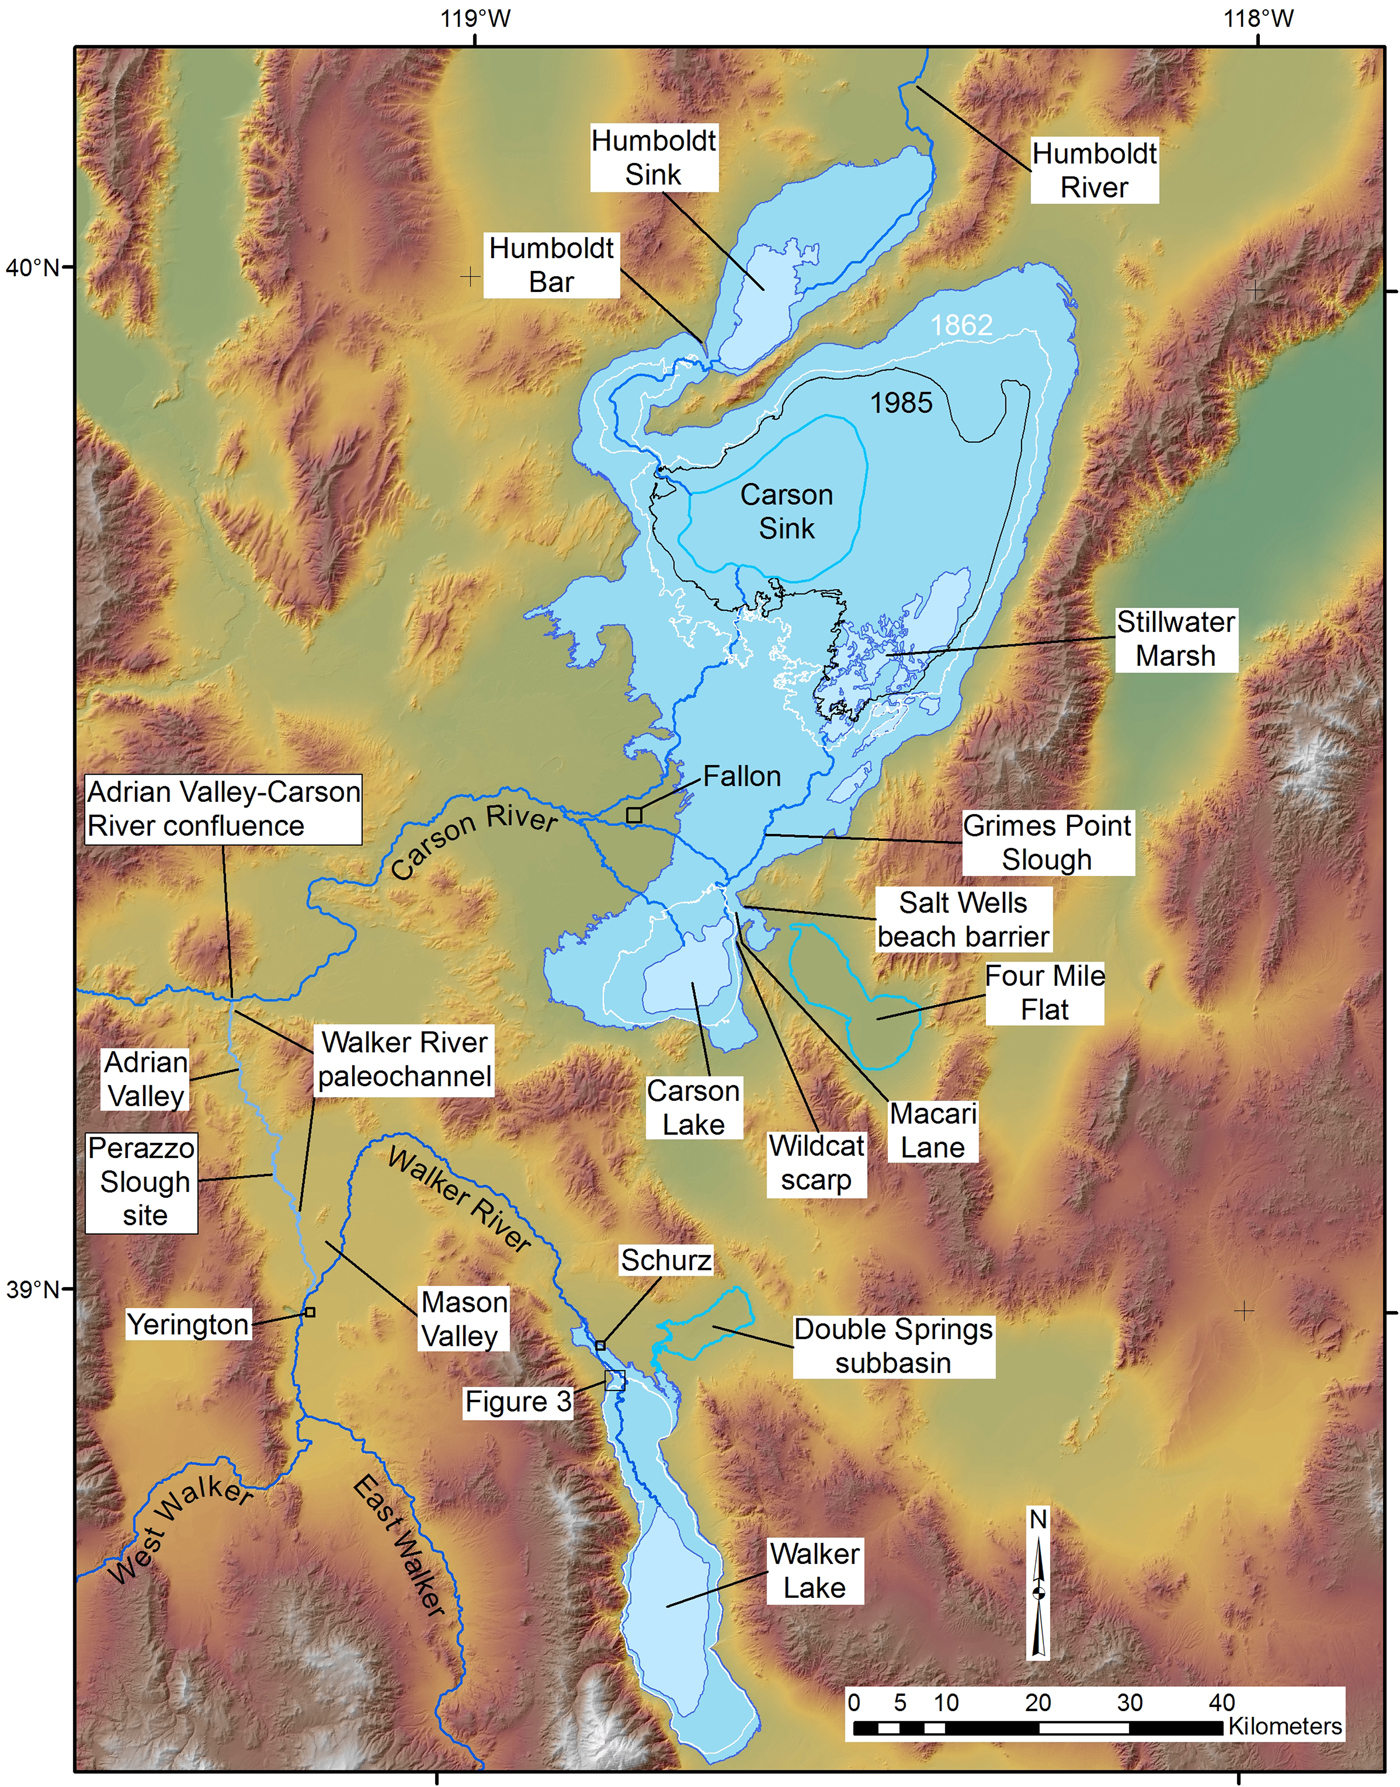
Map of the Carson Sink and Walker Lake basins showing the relevant hydrographic features influencing late Holocene paleohydrology and locations mentioned in text. Medium blue shading in the basins shows the largest extent of late Holocene lakes, whereas the lighter blue shading indicates the modern extent of water bodies. White outlines show the extent of historical high stands that occurred in 1862 in the Carson Sink and 1868 in Walker Lake. The 1985 lake extent (~1183 m) is also shown in the Carson Sink by a black line. (For interpretation of the references to color in this figure legend, the reader is referred to the web version of this article.)
Cumulative mean annual discharge for both branches of the Walker River during the historical period (1926–2017) is about 0.38 km3/yr, with flows during the wettest years ranging up to about 1 km3/yr (Table 1). According to the parameter-elevation regressions on independent slopes model (PRISM) (Daly et al., Reference Daly, Halbleib, Smith, Gibson, Doggett and Taylor2008), the highest parts of the drainage basin along the Sierran crest receives from 100 to 170 cm/yr of mean annual precipitation, most of which accumulates in the winter as snow (Fig. 1). In contrast, precipitation at Walker Lake ranges from about 12 to 20 cm/yr (Fig. 1) (Daly et al., Reference Daly, Halbleib, Smith, Gibson, Doggett and Taylor2008).
Stream flow statistics for the Walker, Carson, and Humboldt rivers.

Harding (Reference Harding1965) and Milne (Reference Milne1987) estimated that the mean annual lake evaporation rate for Walker Lake is about 125 cm/yr. Allander et al. (Reference Allander, Smith and Johnson2009) measured evaporation from a floating platform in Walker Lake for a 2-yr period and determined that the actual annual lake evaporation rate was about 152 cm/yr. Allander et al. (Reference Allander, Smith and Johnson2009) attributed the difference between these two values to previously unaccounted groundwater inflow, based on a water budget approach.
At its historical high stand in 1868, Walker Lake reached an elevation of about 1252 m, had a surface area of about 300 km2, and had a volume of about 13 km3 (Adams, Reference Adams2007; Lopes and Smith, Reference Lopes and Smith2007). Because of drought and upstream water diversions and consumption, the lake-surface elevation had dropped to about 1191 m at the start of the 2017 water year, corresponding to a surface area of about 109 km2 and volume of about 1.2 km3. Because of the unusually deep snowpack of the 2016–2017 winter in its headwaters, runoff down the Walker River had raised the level of the lake by just over 3 m by the start of the 2018 water year.
The Carson and Humboldt sinks (herein shortened to the Carson Sink) occupy the lowest part of a drainage basin that encompasses about 54,000 km2 and is primarily fed by the Carson River from the west and the much larger Humboldt River drainage basin from the east (Figs. 1 and 2). The Carson River also derives most of its flow from near the Sierran crest where precipitation is about 100 to 140 cm/yr (Daly et al., Reference Daly, Halbleib, Smith, Gibson, Doggett and Taylor2008). As the Carson River enters the basin near Fallon, Nevada, it splits into a series of distributaries that alternately direct flow either to the Carson Sink (also known as North Carson Lake), or east to Stillwater Marsh, or southeast to Carson Lake (Fig. 2). Since the mid-nineteenth century, most of the flow has been directed toward Carson Lake (Morrison, Reference Morrison1964), which has a surface area of ~150 km2 and volume of ~0.4 km3 when it is overflowing north through the Stillwater Slough to Stillwater Marsh and then into the Carson Sink (Adams, Reference Adams2003). The historic high stand in the Carson Sink occurred in 1862 when lake level reached 1185.7 m, corresponding to an area of 1300 km2 and a volume of 5.7 km3 (Fig. 2).
Much of the flow in the Humboldt River is derived from the Ruby Mountains where precipitation ranges from about 80 to 110 cm/yr, also mostly snow, although significant volumes of water are probably occasionally derived from the Santa Rosa, Independence, Jarbidge, and Toiyabe ranges (Fig. 1). The Humboldt River typically terminates in the Humboldt Sink (Fig. 2), which is separated from the rest of the Carson Sink by a valley-spanning beach ridge complex known as the Humboldt Bar (Russell, Reference Russell1885). A narrow channel cut through the lowest part of the Humboldt Bar indicates occasional flow from the Humboldt Sink south to the Carson Sink. During the mid-1980s high stand in the Carson Sink (lake level, 1183 m; surface area, 890 km2; and volume, 2.5 km3) (Fig. 2), almost twice the volume of water came down the Humboldt River as did from the Carson River even though their average annual flows are very similar (Table 1).
PREVIOUS WORK
Morrison (Reference Morrison1964) documented the existence of low-elevation shorelines (<1204 m) rimming the Carson Sink that he grouped as part of the late Holocene Fallon Formation (later renamed the Fallon Alloformation; Morrison, Reference Morrison and Morrison1991). Davis (Reference Davis1978) identified the Turupah Flat tephra (<2 ka) within the Salt Wells beach barrier (~1202 m), and Adams (Reference Adams2003) dated detrital charcoal from 5 cm beneath the tephra to 660–910 cal yr BP. A slightly lower beach (~1198 m) was dated to 1310–1520 cal yr BP (Adams, Reference Adams2003).
Bell et al. (Reference Bell, Caskey and House2010) and Bell and House (Reference Bell and House2010) mapped the Lahontan Mountains and Grimes Point quadrangles, respectively, and reported 25 new radiocarbon ages bearing on the late Pleistocene and Holocene history of the Carson Sink. In particular, they documented ages and elevations of key outcrops and landforms consistent with results of previous studies but added detail to the record of late Holocene lake-level fluctuations.
In the Walker Lake subbasin, Benson (Reference Benson1978) used the ages and elevations of tufa samples to construct a Holocene lake-level curve, which was updated by Benson and Thompson (Reference Benson and Thompson1987a, Reference Benson, Thompson, Ruddiman and Wright1987b), Benson (Reference Benson1988), and Benson et al. (Reference Benson, Meyers and Spencer1991) with the addition of lake-level proxies from deep-water cores. Large-scale lake-level drops at about 2 ka and 1 ka were attributed to temporary diversion of the Walker River out of the basin (Benson et al., Reference Benson, Meyers and Spencer1991). Bradbury et al. (Reference Bradbury, Forester and Thompson1989) added to this history using biological proxies from the cores. The late Holocene tufa ages of Newton and Grossman (Reference Newton and Grossman1988) are largely in agreement with the results of Bradbury et al. (Reference Bradbury, Forester and Thompson1989) and Benson et al. (Reference Benson, Meyers and Spencer1991). Yuan et al. (Reference Yuan, Linsley, Lund and McGeehin2004, Reference Yuan, Linsley, Howe, Lund and McGeehin2006) collected additional cores and used fluctuations in several proxies to infer hydrologic fluctuations over the last 2700 yr.
Adams (Reference Adams2007) used radiocarbon ages from terrestrial plant material and charcoal collected from diverse sedimentary environments including fluvial, deltaic, beach, and offshore settings to refine the late Holocene curve for Walker Lake. The revised curve confirmed several large-scale fluctuations over the last few thousand years (Adams, Reference Adams2007). Because the study focused on stratigraphic sections and not shorelines, however, the maximum elevations of Holocene high stands could only be estimated. Subsequent geologic mapping along the lower Walker River and at Walker Lake by House and Adams (Reference House and Adams2009, Reference House and Adams2010) identified the upper limit of late Holocene beach deposits at about 1262 m.
Hatchett et al. (Reference Hatchett, Boyle, Putnam and Bassett2015) used a coupled water balance and lake evaporation model along with the Walker Lake–level curve of Adams (Reference Adams2007) to simulate the climatic conditions that led to two low stands separated by a minor high stand during the Medieval Climate Anomaly (MCA). This sequence of drought-deluge-drought generally fits the pattern of western U.S. hydroclimate during the MCA originally defined by Stine (Reference Stine1994), which was in part based on the death ages of trees found within the West Walker River channel near its headwaters. The timing of this sequence was refined by Cook et al. (Reference Cook, Seager, Heim, Vose, Herweijer and Woodhouse2010). Hatchett et al. (Reference Hatchett, Boyle, Putnam and Bassett2015), however, did not consider the effect of the wandering behavior of the Walker River on Walker Lake levels, which means that the lake-level fluctuations that they were modeling may have had additional nonclimate controls.
Multiple studies (e.g., Davis, Reference Davis, Madsen and O'Connell1982; Benson and Thompson, Reference Benson and Thompson1987a, Reference Benson, Thompson, Ruddiman and Wright1987b; Benson et al., Reference Benson, Meyers and Spencer1991; King, Reference King1993, Reference King1996; Adams, Reference Adams2007) concluded that during the Holocene the Walker River was occasionally diverted from the Walker Lake subbasin to become a tributary of the Carson River and Carson Sink (Fig. 2), but the timing of these diversions (and returns) was unclear. During such diversions, the Carson Sink received substantial additional water, and Walker Lake was deprived of its only major water source.
King (Reference King1993, Reference King1996) concluded that diversions of the Walker River through Adrian Valley were as recent as within the last few hundred years, based on the ages of Anodonta shells (300 ± 60 14C yr BP) found along the paleochannel. S.J. Caskey (personal communication, 2004) determined a similar age (330 ± 60 14C yr BP) from other Anodonta shells along the same reach.
The sum of evidence from multiple studies indicates that Walker Lake has undergone multiple large-scale lake-level fluctuations during the late Holocene. Whether this was strictly attributable to climate change or to the occasional diversion of the Walker River out of and back into the basin is one of the topics addressed in this article.
METHODS
This synthesis compiles existing radiocarbon data from a number of published sources that bear on the Holocene histories of Walker Lake and the Carson Sink and also presents new radiocarbon and infrared stimulated luminescence (IRSL) ages for key outcrops and landforms. All radiocarbon ages have been calibrated with the Calib 7.1 program using the IntCal13 calibration curve (Reimer et al., Reference Reimer, Bard, Bayliss, Beck, Blackwell, Bronk Ramsey and Buck2013) and are reported in radiocarbon years before present (14C yr BP) and calibrated years before present (cal yr BP). The reservoir effect associated with lakes in the Carson Sink and the Walker River is unknown, so radiocarbon ages of mollusk shells from these locales are not corrected but are assumed to represent maximum ages. Luminescence ages have been corrected to reflect calibrated years before present (AD 1950).
Luminescence samples were collected from six hand-excavated pits on a suite of beach ridges near the north end of Walker Lake. Duplicate samples were collected by pounding a steel pipe horizontally into the vertical wall of each sample pit and then excavating the pipe and capping the ends with light-tight material. An attempt was made to sample parts of the exposures with visible bedding, in order to minimize the mixing effects of bioturbation. In situ gamma spectrometer measurements were collected from the same holes where the sediment was collected to determine dose rate, in addition to a bulk sample surrounding each sample site for laboratory radiation measurements. All samples were prepared and processed at the University of California, Los Angeles, luminescence laboratory using the single grain K-feldspar post–IR IRSL protocol outlined in Rhodes (Reference Rhodes2015). More details on this methodology are found in the Supplementary Materials.
Calibrated radiocarbon ages from the late Holocene typically have a 2-sigma error range of several hundred years, which makes it difficult to assess rates of hydrologic change that typically occur over shorter periods (e.g., Adams et al., Reference Adams, Negrini, Cook and Rajagopal2015). For selected radiocarbon samples from the Carson Sink, the moisture-sensitive tree-ring chronologies contained within the LBDA of Cook et al. (Reference Cook, Seager, Heim, Vose, Herweijer and Woodhouse2010) were used to refine the timing and duration of lake high stands associated with particularly wet periods. The LBDA provides a year-by-year view of the spatial-temporal distribution of drought areas and relatively wet regions across North America that extends back to the year AD 0 (Cook et al., Reference Cook, Seager, Heim, Vose, Herweijer and Woodhouse2010). This information can be viewed in the form of maps or by examining the annual time series of Palmer Drought Severity Index (PDSI) values for the summer months (June, July, August) at a particular grid node within the LBDA (Fig. 1). Although there are higher numbers of chronologies for younger time periods, more than 15 chronologies contribute to PDSI values for the grid nodes in the Humboldt, Carson, and Walker basins that begin in the time period AD 500–1500 and 3 that extend to the year AD 0 (Fig. 1, inset).
Assuming that large lakes in the Carson Sink reflect extended periods of above-average precipitation within its headwaters, the LBDA time series can guide estimates of timing, duration, and magnitude of specific wet periods encompassed by the imprecise radiocarbon ages associated with high lake levels. Here we assume the beginning of the lake-level rise coincides with the beginning of the wet period as indicated by positive PDSI values, and that the maximum lake level is attained the year before PDSI values become negative. We estimated the number of years it took for the lakes to desiccate by applying the modern evaporation rate (~130 cm/yr) to the depths of the lakes but recognize that this is a minimum duration estimate.
The elevations of dating samples and landforms measured for this study were surveyed with either a total station referenced to local benchmarks or high-precision GPS instruments or were determined from high precision LIDAR (light detection and ranging) or photogrammetric-derived topographic data. These elevation measurements therefore have a precision of ≤1 m, which is well within the natural variability in the height of shorelines formed above a still water plane (Atwood, Reference Atwood1994; Adams and Wesnousky, Reference Adams and Wesnousky1998).
To augment the geologic records of lake-level fluctuations, we applied paleohydrologic models to gain additional insight into timing, rates, and magnitudes of hydrologic changes. For Walker Lake, annual stream flow was simulated using the tree-ring chronologies contained within the LBDA, which, in turn, was routed to a Walker Lake water balance model that also runs in annual time steps, similar to the approach used by Adams et al. (Reference Adams, Negrini, Cook and Rajagopal2015) for Tulare Lake in California. In this case, the combined annual flow volume recorded at two stream gauges along the East Walker River (10293000) and West Walker River (10296500) was regressed against LBDA-derived PDSI values from a grid point (GP 2239; Fig. 1) located near the headwaters of the Walker River to develop statistical relationships between annual tree growth and stream flow. These relationships enabled estimates of annual flow volumes of the Walker River over the last 2000 years. This approach is justified because most of the water utilized by the trees during the growth season comes from snowmelt, which also controls annual river discharge. The simulated annual river flows were in turn routed to a Walker Lake water balance model, constrained by the hypsometry of the basin (Lopes and Smith, Reference Lopes and Smith2007), to simulate lake-level fluctuations over this same period.
The water balance model was calibrated by using annual gauged flow recorded at the lowest gauge (10302002) along the Walker River, which is below all points of diversion or storage, along with PRISM estimates of precipitation (Daly et al., Reference Daly, Halbleib, Smith, Gibson, Doggett and Taylor2008) on the lake as input, and a randomly varied lake-evaporation rate between 125 and 135 cm/yr (Milne, Reference Milne1987) controlling the output. To assess the reasonableness of the water balance model, simulated lake-level changes were compared with actual lake-level changes over the 1995–2017 period of record for the gauge. Historical lake-level changes could not be simulated prior to 1995 because the total volume of water actually reaching the lake was not accurately recorded.
This same coupled modeling approach was attempted for the Carson Sink, but the volumes of modeled flow were insufficient to account for the large lakes present at various times in the late Holocene. Instead, the relatively simple lake water balance models of Adams (Reference Adams2003) were updated to address the questions of what volumes of stream discharge were necessary over what periods of time to produce the late Holocene lakes.
RESULTS
Walker Lake
The geologic mapping of House and Adams (Reference House and Adams2009, Reference House and Adams2010) demonstrated that the undated but late Holocene high stand at Walker Lake was at about 1262 m, based on beach ridges developed on post-Lahontan high-stand alluvial fans (Fig. 3). Further, these beach ridges are at about the same elevation as a sill with a channel leading to the Double Springs subbasin to the northeast of Walker Lake (Fig. 2). Although this subbasin is relatively small (36 km2 and 0.48 km3 when full), it apparently accommodated all overflow when Walker Lake was at the 1261 m sill, thereby restricting late Holocene levels to this elevation and below.
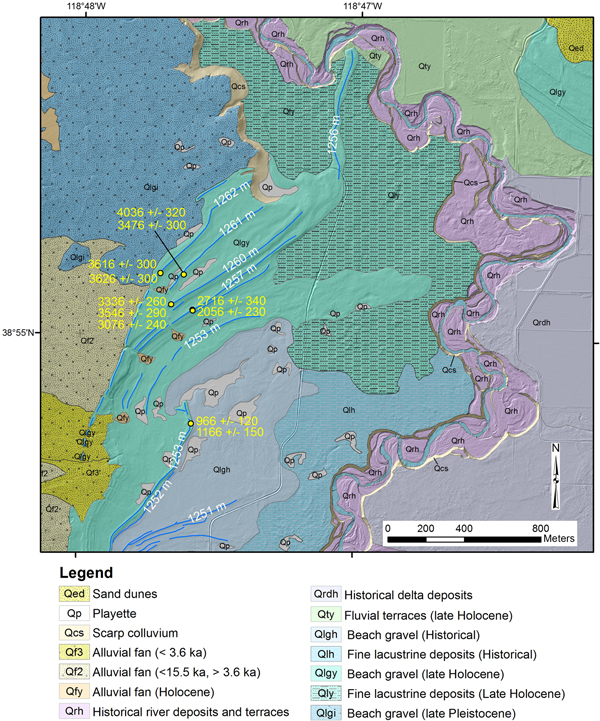
Geomorphic map of a series of late Holocene beach ridges (blue lines) in the northwest Walker Lake basin showing the results of luminescence dating. The historical high stand reached an elevation of 1252 m, and shorelines from 1253 to 1262 m date from the late Holocene. Luminescence ages have been converted to years before present (Table 3). (For interpretation of the references to color in this figure legend, the reader is referred to the web version of this article.)

To augment the Walker Lake–level record of Adams (Reference Adams2007), luminescence samples were collected from a suite of beach ridges located in the northwestern part of the basin that range in elevation from about 1253 to 1262 m (Figs. 2 and 3). The beach ridges are primarily composed of granitic sand and grit with small angular to subangular gravel clasts (≤5 cm) likely reworked from existing alluvial fan deposits and older beach deposits. The surfaces of the upper beach ridges (1262 m, 1261 m, and 1260 m; Fig. 3) in this sequence are partially covered by a loose, poorly developed pavement or patches of discontinuous cryptogamic crust preferentially developed around the bases of widely spaced (1–5 m) desert shrubs. Soil development is minimal, consisting of small amounts of eolian silt and fine sand infiltrating into the upper parts (≤ 20 cm) of the beach ridges, but not enough has accumulated to develop Av horizons. Sample pits dug either on the barrier crests or slightly lakeward revealed an internal structure consisting of laminae to thin beds (≤ 5 cm) of sand and fine gravel gently dipping to the south toward the former lake, with local heavy mineral concentrations along the laminae. The lower beach ridges (1257 m, 1253 m, and 1252 m; Fig. 3) lack the loose pavements, patchy cryptogamic crusts, and infiltrated dust that characterize the upper beach ridges, but their internal structure is similar. The surface and soil characteristics of all of these beach ridges are consistent with a late Holocene age, when compared with the typical characteristics displayed by Lahontan high-stand beach features (~15,500 cal yr BP) in the area that possess better developed pavements and stronger soil development (Adams and Wesnousky, Reference Adams and Wesnousky1999)
Results from the luminescence samples are also consistent with a late Holocene age, with the upper most and oldest beach ridge (1262 m) dating from about 3620 ± 300 cal yr BP (Table 2, Fig. 3), based on two samples. Although the duplicate sample ages from each of the lower beach ridges show wider scatter, each group overlaps within 1-sigma uncertainty, except for those from the 1257 m ridge for which 90 yr separates the 1-sigma age ranges (Table 2).
Walker Lake luminescence sample locations, ages, and barrier elevations.

a UTM coordinates are all in Zone 11 NAD83.
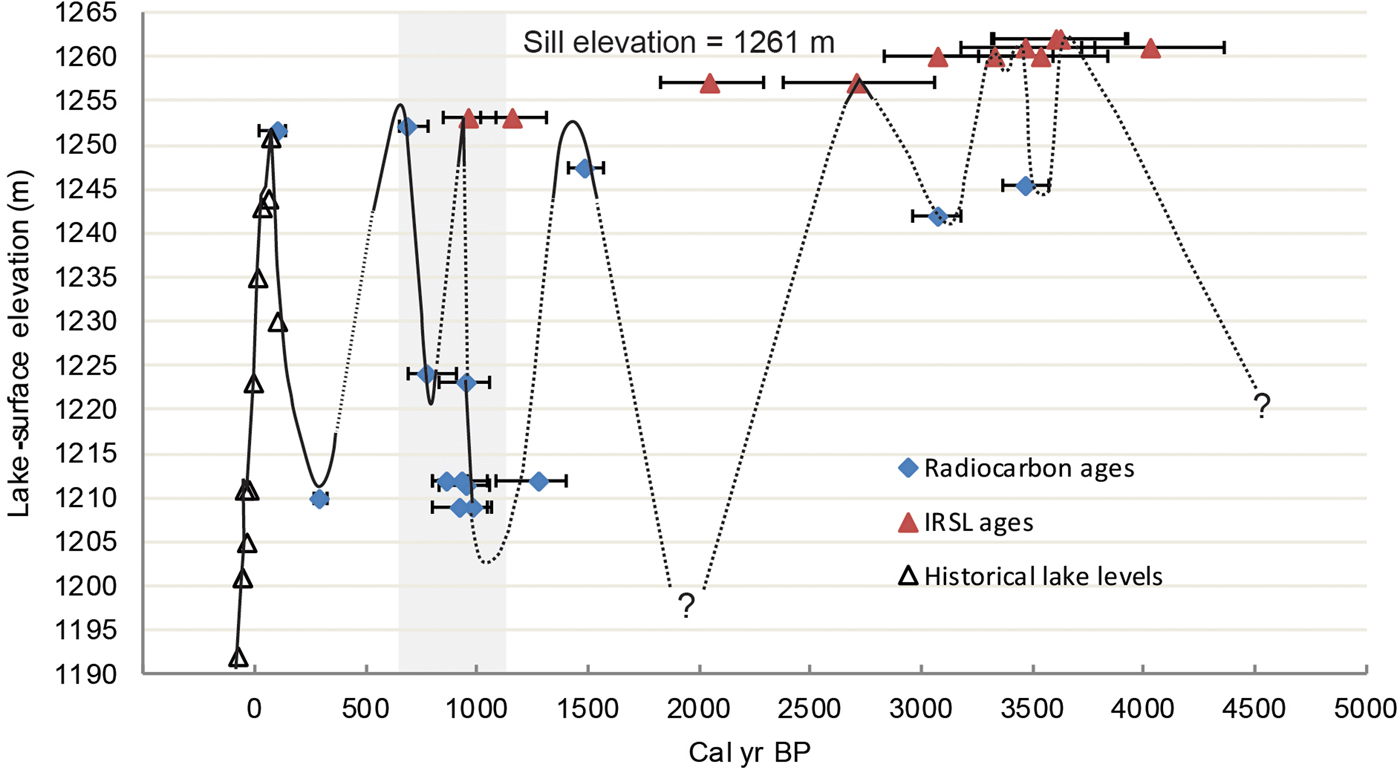
Based on the luminescence ages and their uncertainties, the 1262, 1261, and 1260 m beach ridges were most likely formed between about 3300 and 4000 yr, and the 1257 m ridge formed between 2000 and 3000 yr. The 1253 m ridge formed about 1000 yr (Table 2, Fig. 3). All of these beach ridges are above the historical high stand of 1252 m (Adams, Reference Adams2007). The new ages and elevations of the beach ridges were combined with lake-level data from Adams (Reference Adams2007) to revise the Walker Lake–level curve for the last 4500 yr (Fig. 4). Most of the changes were made in the older part of the curve, accounting for the ages and elevations of the beach ridges dated in this study. Particularly uncertain parts of the curve are labeled with question marks.
(color online) Late Holocene lake-level curve for Walker Lake modified from Adams (Reference Adams2007). Chronological data constraining this curve are found in Tables 2 and 3. The vertical gray band represents the timing of the Medieval Climate Anomaly. IRSL, infrared-stimulated luminescence.

Carson Sink
As part of their efforts to map the surficial geology of the Lahontan Mountains and to apply modern dating methods to the Quaternary stratigraphy originally defined by Morrison (Reference Morrison1964, Reference Morrison and Morrison1991), Bell and House (Reference Bell and House2010) and Bell et al. (Reference Bell, Caskey and House2010) documented several stratigraphic sections and deposits that reflect late Holocene lake-level changes in the Carson Sink. The two main sites include one above the northeast shore of Carson Lake at Macari Lane and the other along Grimes Point Slough, which connects Carson Lake with the rest of the Carson Sink via the Stillwater Marsh (Fig. 2). Four additional radiocarbon samples bearing on late Holocene lake levels were collected by Bell et al. (Reference Bell, Caskey and House2010) from other sites in the area (Table 3).
Radiocarbon ages from the Carson Sink, Walker Lake, and the Walker River paleochannel used in this study.

a All radiocarbon ages calibrated with Calib 7.1 using the IntCal13 calibration curve (Reimer et al., Reference Reimer, Bard, Bayliss, Beck, Blackwell, Bronk Ramsey and Buck2013).
The Macari Lane and Grimes Point Slough sections are similar and consist of thin to medium beds of brown silty sands with aquatic mollusks interbedded with thin beds of dark-gray organic-rich silts that Bell et al. (Reference Bell, Caskey and House2010) interpreted as interbedded lacustrine, marsh, and fluvial sediments. We used the elevations and ages of these units combined with the ages of the 1202 m and 1198 m beaches in the area (Adams, Reference Adams2003) to reconstruct lake-level fluctuations in the Carson Sink over the last 5000 yr.
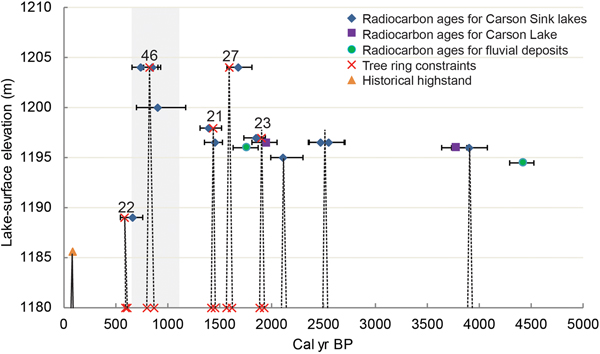
Figure 5 presents the late Holocene Carson Sink lake-level curve that is based on a synthesis of all relevant radiocarbon ages (Table 3). In this curve, radiocarbon samples from lacustrine sediments within the Carson Lake subbasin but above the outlet elevation (~1195 m) indicate lakes that probably encompassed much of the Carson Sink. These lakes attained high stands during the intervals 660–910, 1310–1520, 1570–1820, 1730–1940, and 2350–2700 cal yr BP (Table 3, Fig. 5). The lacustrine samples dating from about 550 to 760, 2000 to 2300, and 3730 to 4080 cal yr BP were collected from sites within the main body of the Carson Sink.
Late Holocene lake-level curve for the Carson Sink constructed from data in Table 3. The outlet elevation of Carson Lake is at about 1195 m. The blue diamonds represent lakes that flooded the entire Carson Sink, whereas the purple squares represent lakes that may have only filled Carson Lake (see Fig. 2). Green circles represent fluvial deposits along Grimes Point Slough, and the orange triangle represents the historical high stand in 1862. The groups of three red crosses represent the beginning, peak, and end of pluvial periods derived from the Living Blended Drought Atlas (grid point 2748). Each of these pluvial periods is labeled with the duration in years. The vertical gray band represents the timing of the Medieval Climate Anomaly. (For interpretation of the references to color in this figure legend, the reader is referred to the web version of this article.)

We refined the timing of five of the high stands by using tree-ring records as an indicator of wet periods (Cook et al., Reference Cook, Seager, Heim, Vose, Herweijer and Woodhouse2010). The end years of each of the five youngest wet periods are 663, 829, 1439, 1593, and 1909 cal yr BP, respectively. Judging from the tree-ring records, these periods of elevated lake levels lasted from about 20 to 50 yr (Fig. 5).
Walker River paleochannel
There are multiple channel traces in Mason Valley marking past courses of the Walker River. The Walker River paleochannel is defined as the one that can be almost continuously traced from where it splits from the modern Walker River in southern Mason Valley and then flows northwest through Adrian Valley to connect with the Carson River (Fig. 2). This channel has probably accommodated the most recent flows during diversions. Although the area of the channel bifurcation is now a smooth agricultural field, the natural elevation difference between the paleochannel and the modern Walker River is only 1 to 2 m. Two sites along the paleochannel give evidence for water flowing toward the Carson Sink but do not necessarily exclude the possibility that water was also flowing into Walker Lake at the same time.
Perazzo Slough site
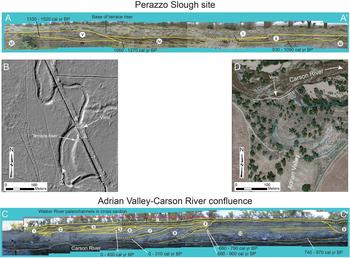
The Perazzo Slough site is located in northwest Mason Valley along the paleochannel where a drainage ditch cuts across a series of meanders (Fig. 6A and B), exposing a cross section through the fluvial landforms and stratigraphy. The sediments primarily consist of thin to medium cross-bedded fine to coarse sands with thin discontinuous lenses of silt or fine gravel. These sequences form discrete packages separated by angular buttress unconformities (Fig. 6A). Some packages have thin mud layers at their bases that contain abundant organic material including charcoal. The arrangement of the sedimentary units (numbered i–vi, in order of increasing relative age) conforms to the surface morphology where the youngest channel unit (i) spans the width of the surface channel and is inset into older units (ii and iv) whose edges conform to the bases of terrace risers on the surface (Fig. 6A and B). The different stratigraphic units are interpreted as a series of inset channel and point bar deposits that reflect different periods when the Walker River was flowing through the paleochannel. According to the radiocarbon ages of these units, this channel was active several times between about 1520 and 930 cal yr BP (Fig. 6A, Table 3).
(color online) Cross sections and maps of the two sites along the Walker River paleochannel (see Fig. 2). (A) Interpreted cross section of the Perazzo Slough site showing discrete packages of fluvial sediments related to flow along the paleochannel. Relative age increases from i to vi. Width of the exposure is about 80 m. (B) LIDAR (light detection and ranging) hill-shade map showing the Perazzo Slough site, associated fluvial features, and location of the cross section. (C) Cross section exposed along the right bank of the Carson River at the mouth of Adrian Valley (D) showing a series of stacked channel features incised into horizontally bedded floodplain sediments of the Carson River that are interpreted to represent paleochannel deposits of the Walker River. Relative age of stratigraphic units increases from 1 to 10. Exposure is about 5 m high and 90 m long.

Adrian Valley–Carson River confluence
At the north end of Adrian Valley, the Walker River paleochannel becomes a tributary to the Carson River at the Adrian Valley–Carson River confluence (Figs. 2 and 6C and D). A 5-m-high cutbank into this terrace on the south side of the Carson River exposes a cross section through the stratigraphy of the paleochannel (Fig. 6C).
The predominately fine to coarse sandy sediments exposed here are arranged into discrete packages separated by angular buttress unconformities. The units are numbered from 1 to 10 in order of increasing age (Fig. 6C). Unit 10 is the oldest in the exposure and consists of horizontal thin- to medium-bedded sands, silty sands, and organic and charcoal-rich silty muds. This unit is interpreted to represent vertical accretion of Carson River floodplain deposits from about 970 to 680 cal yr BP (Fig. 6C). On the east side of the exposure, a series of inset channel units are exposed in cross section and generally young to the east. The two radiocarbon ages from these units indicate that they were deposited within the last 430 cal yr BP, which is consistent with the age of unit 10. The sandy sediments are arranged into thin to medium beds that generally parallel the base of each unit (Fig. 6C) and show common cross bedding and current ripple cross laminations. Whereas the oldest of these inset channel deposits are graded to a level at about the modern Carson River channel, the younger channels appear to be graded to progressively higher base levels. The age of channel unit 9 is younger than unit 10 but cannot be directly related to the ages of channel units 1–8.
Based on their approximately perpendicular orientation to the modern Carson River, and their location at the mouth of Adrian Valley, the inset channels exposed on the east side of the exposure are interpreted to represent paleochannels of the Walker River (Fig. 6C). Further, the ages of these sediments indicate that these channels have been active multiple times during the last 1000 years.
The presence of Carson River meander scars on the surface of the terrace at the mouth of Adrian Valley (Fig. 6D) suggests the possibility that the inset channels exposed in the cutbank (Fig. 6C) were formed by the Carson River instead of the Walker River. Similar meander scars are characteristic of this terrace surface both upstream and downstream from the confluence, but the only place that inset channels were found in the stratigraphy was at the mouth of Adrian Valley. All of the other terrace exposures examined along the Carson River displayed vertically accreted sediments without evidence of cutting and filling. Although not definitive, the inset channels at the mouth of Adrian Valley are most likely associated with the Walker River paleochannel.
Paleohydrologic modeling
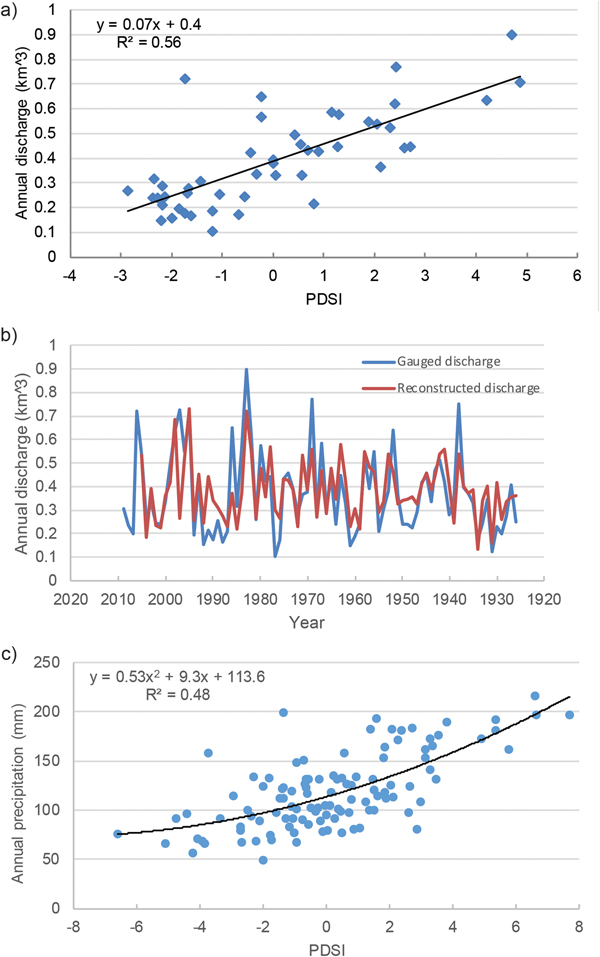
Paleohydrologic modeling gives estimates of the total annual discharge of the Walker River and the response of Walker Lake to a variety of flow scenarios. The statistical relationship between the PDSI time series from grid point 2239 to the total annual gauged flow in the East Walker and West Walker rivers has an r 2 = 0.56 and a standard error of 0.13 (Fig. 7A). This relationship was used to reconstruct Walker River discharge for the period 1926 to 2005 that could be directly compared with the gauged flow (Fig. 7B). Although the reconstructed flows match the gauged flows at moderate volumes reasonably well, the reconstructed flows slightly underestimate the largest annual flow volumes and slightly overestimate the lowest gauged flows. Underestimating flow volumes in particularly wet years is a common phenomenon in many stream flow reconstructions (e.g., Meko et al., Reference Meko, Therrell, Baisan and Hughes2001; Graumlich et al., Reference Graumlich, Pisaric, Waggoner, Littell and King2003; Watson et al., Reference Watson, Barnett, Gray and Tootle2009; Wise, Reference Wise2010) because high volume and rapid discharge may not have a lasting effect on soil moisture (Meko and Woodhouse, Reference Meko, Woodhouse, Hughes, Swetnam and Diaz2011). Annual precipitation at Walker Lake was simulated for the historical period based on the statistical relationship between PRISM precipitation estimates and the PDSI time series from grid point 2339, which has an r 2 = 0.48 and a standard error of 28 (Fig. 7C). This relationship was then used to reconstruct annual precipitation at Walker Lake for the period AD 0 to 2005.
(color online) (A) Relationship between Living Blended Drought Atlas Palmer Drought Severity Index (PDSI) values (grid point 2239) and annual discharge of the East and West Walker rivers from 1958 to 2005. (B) Reconstructed annual discharge of the Walker River compared with gauged discharge for the period 1926–2005. (C) Plot showing the relationship between PRISM (parameter-elevation regressions on independent slopes model) water year annual precipitation and annual PDSI values from grid point 2339 at Walker Lake.

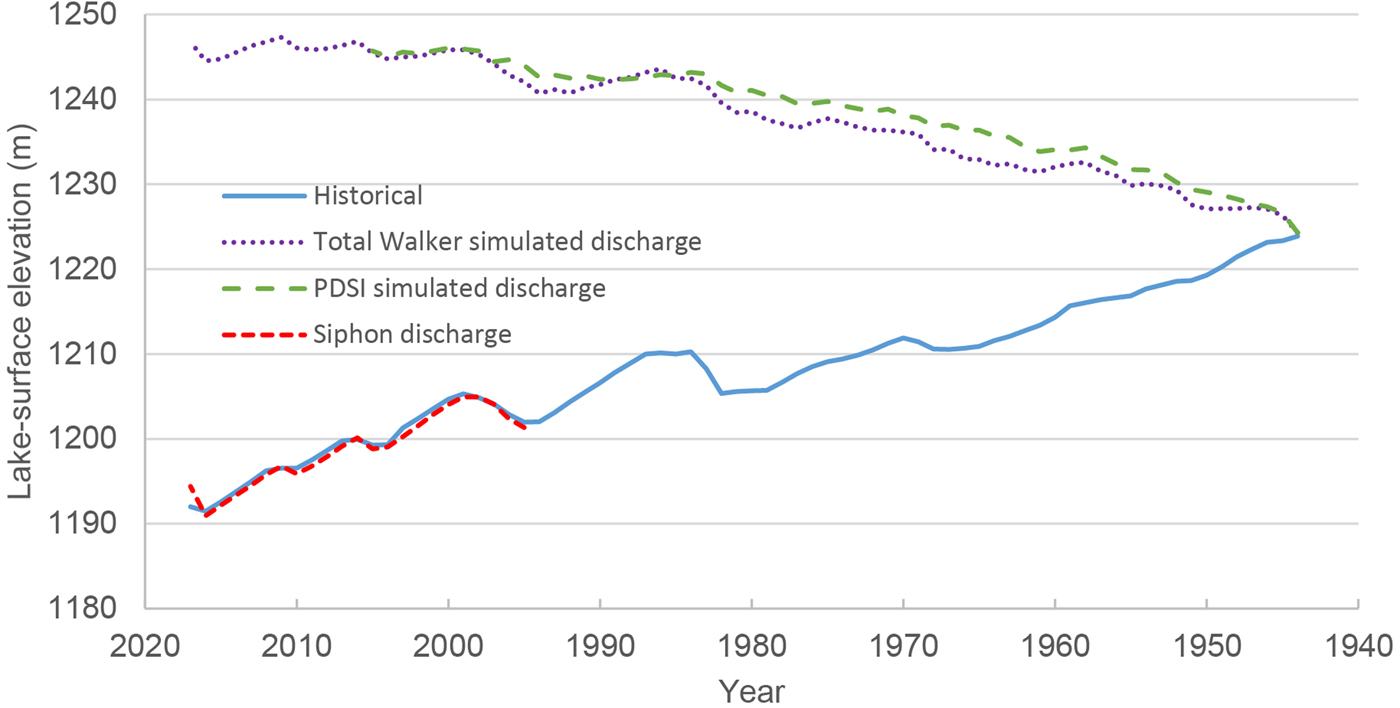
To test the Walker Lake water balance model, lake-level fluctuations were modeled for the historical period using gauged flow as well as tree-ring-reconstructed flow as input, along with PRISM precipitation estimates at Walker Lake and an annual evaporation rate ranging between 125 and 135 cm/yr. Although the Siphon gauge (10302002) record is relatively short (1995–2017), use of these data in the model result in lake-level fluctuations that closely match actual fluctuations (Fig. 8), supporting the credibility of the lake water balance model. Lake-level fluctuations that would have occurred during the historical period if water had not been diverted were also modeled by using the combined flows from stream gauges located upstream from major points of diversion (Fig. 8). These hypothetical lake levels, using actual gauge records, are closely matched by modeled lake-level changes derived from tree-ring-reconstructed flow from those same stream gauges. The magnitude of difference between these latter two curves ranges up to 1 to 3 m (Fig. 8), likely indicating the uncertainty in the paleohydrologic modeling procedure (Adams et al., Reference Adams, Negrini, Cook and Rajagopal2015).
Modeled Walker Lake–level fluctuations compared with actual lake-level fluctuations for the period 1943–2017 using various simulated and observational data. The solid blue line represents observed lake-level changes, whereas the red dashed line represents modeled changes using discharge from the lowest gauge on the system, which effectively represents the actual volumes of water delivered to the lake. The upper purple dotted line represents lake levels that would have occurred had there been no anthropogenic water withdrawals or consumption on the system by using discharge data from gauges located upstream from points of diversion. The dashed green line represents hypothetical lake-level changes using Living Blended Drought Atlas–derived discharge from the relationship shown in Figure 7A. All model simulations had a starting lake-surface elevation of 1224 m. (For interpretation of the references to color in this figure legend, the reader is referred to the web version of this article.)

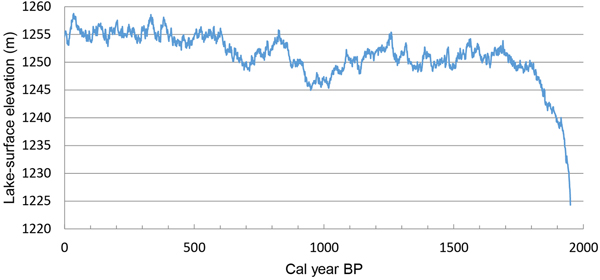
Tree-ring-simulated mean annual Walker River flow volumes and precipitation values at Walker Lake, along with an annual evaporation rate of 125–135 cm/yr, were then used to simulate lake-level changes at Walker Lake for the last 2000 years (Fig. 9). Our estimates indicate that lake level quickly rose from a starting elevation of 1225 m at 2000 cal yr BP to fluctuate between 1250 and 1255 m until about 1080 cal yr BP (AD 870) when lake level fell to about 1246–1247 m. Lake level remained relatively low until about 950 cal yr BP (AD 1000) when lake level rose in a steplike manner to reach 1255 m by 830 cal yr BP (AD 1120). Lake level dropped to 1248.5 m by about 710 cal yr BP (AD 1240) before rising to fluctuate around 1255 m into the historical period (Fig. 9).
(color online) Plot showing simulated Walker Lake–level changes using Palmer Drought Severity Index–derived discharge for the period 1950–0 cal yr BP. On-lake precipitation was simulated using the relationship in Figure 7C.

DISCUSSION
The paleohydrologic histories of the Carson Sink and Walker Lake reflect interactions among climate and river dynamics. In particular, these two lake systems are linked by the occasional diversions of the Walker River from Walker Lake to the Carson Sink. Fundamental differences between the Carson Sink and Walker Lake in terms of drainage basin size and location and lake-basin hypsometry have also affected how these basins have responded to climate fluctuations during the Holocene.
The Walker River was diverted back into Walker Lake by about 5500 cal yr BP, after spending most of the early and middle Holocene emptying into the Carson Sink (Benson and Thompson, Reference Benson, Thompson, Ruddiman and Wright1987b; Bradbury et al., Reference Bradbury, Forester and Thompson1989; Benson et al., Reference Benson, Meyers and Spencer1991). By about 4000 cal yr BP, Walker Lake had reached its highest levels of the Holocene at about 1262 m (Fig. 4), coincident with the Neopluvial period that was originally defined by Allison (Reference Allison1982) to indicate a period of relatively high lake levels that coincided with the Neoglacial period (e.g., Denton and Stuiver, Reference Denton and Stuiver1966; Porter and Denton, Reference Porter and Denton1967). Except for two minor lake level drops to about 1240–1245 m, Walker Lake remained at relatively high levels (≥1255 m) until about 2800 cal yr BP (Fig. 4). Benson et al. (Reference Benson, Meyers and Spencer1991) indicated that Walker Lake nearly desiccated by around 2000 cal yr BP based on the abundance of Ruppia pollen found in a core interval dating from this period, which was interpreted to represent a shallow playa lake. Berelson et al. (Reference Berelson, Corsetti, Johnson, Vo and Der2009) suggested that lake level did not fall below about 1200 m at this time, based on the ages and carbonate-associated sulfate content of a low-elevation tufa. The timing of this low lake level agrees with evidence for the late Holocene dry period in the Great Basin that extended from about 2900 to 1850 cal yr BP (Mensing et al., Reference Mensing, Sharpe, Tunno, Sada, Thomas, Starratt and Smith2013), although such low Walker levels may have resulted from diversion of the Walker River into the Carson Sink.
From about 1500 cal yr BP to the historical period, Walker Lake has undergone several high-amplitude fluctuations, constrained by the age of shorelines or nearshore deposits at relatively high elevations and fluvial deposits or other evidence of desiccation at relatively low elevations (Fig. 4) (Adams, Reference Adams2007). The elevation of the high stand at about 1000 cal yr BP (Fig. 4) was adjusted upward from the 2007 curve based on the age of the 1253 m shoreline (Fig. 3, Table 2).
These late Holocene Walker Lake fluctuations correspond to surface area changes ranging from about 300 to 150 km2 and volumetric changes ranging from about 13 to 3 km3. The magnitude of these changes can be placed in perspective by noting the historical decline of Walker Lake from 1252 m in 1868 to 1190 m in 2016, owing to annual reductions in Walker River flow ranging from about 50% to more than 90% because of upstream diversions and consumption. The question remains: Are late Holocene lake-level fluctuations representative of climate fluctuations, or were they caused by changes in the path of the Walker River?
Evidence against strictly climatic factors and for multiple river diversions explaining the dramatic lake-level changes includes discrete packages of different-aged fluvial sediments preserved at two different sites along the Walker River paleochannel (Fig. 6). Each of these packages indicates periods when Walker River water was flowing through the paleochannel into Carson Sink, presumably instead of flowing into Walker Lake, although it is possible that flow was occasionally split between the two channels. The lengths of time or volumes of water that flowed through the paleochannel cannot be determined based on the geologic evidence.
Paleohydrologic modeling bolsters the case for Walker River diversions over the last 2000 years. According to results of the tree-ring-based water balance modeling, Walker Lake levels would have remained relatively high (1245–1258 m) during the last 2000 years, with only relatively minor fluctuations, particularly through the MCA (Figs. 9 and 10). The physical evidence for much greater Walker Lake–level fluctuations therefore suggests that river diversions in and out of the Walker basin are likely responsible for the large lake-stage fluctuations. Consequently, the severe climatic conditions that Hatchett et al. (Reference Hatchett, Boyle, Putnam and Bassett2015) inferred from the large-scale lake-level fluctuations during the MCA may be overstated.
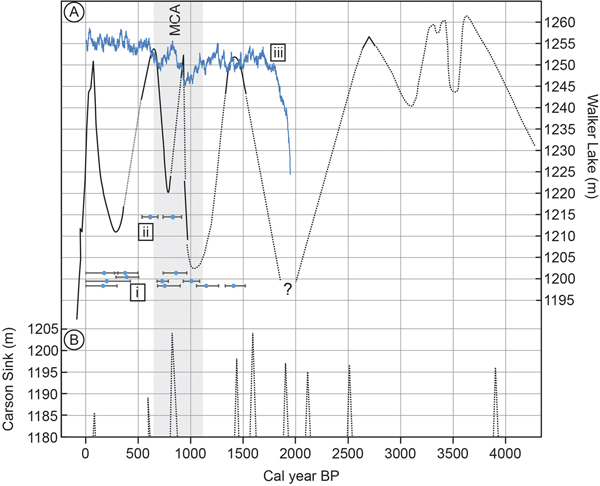
(color online) Late Holocene lake-level curves for Walker Lake (A) and the Carson Sink (B) along with Walker River paleochannel dates (i), drought terminations in the Walker River basin (Stine, Reference Stine1994) (ii), and modeled Walker Lake fluctuations (iii). The vertical gray band represents the timing of the Medieval Climate Anomaly (MCA). The timing of flow episodes in the paleochannel is consistent with Walker Lake low stands, indicating the Walker River was diverted to the Carson Sink at those times.

For the Carson Sink, our paleohydrologic models could not simulate geologically documented high late Holocene lake levels using tree-ring-simulated stream flows. Adams (Reference Adams2003) used a simple water balance model (e.g., Benson and Paillet, Reference Benson and Paillet1989) in annual time steps to determine that the combined flow of the Humboldt, Carson, and Walker rivers would have only produced lakes below an elevation of about 1188 m (surface area, ~1660 km2; volume, 8.4 km3) during the historical period. To produce a lake approaching 1200 m (surface area, ~2815 km2; volume, 35.7 km3) in the Carson Sink, mean annual flow would have to have increased by a factor of 4 to 5 (3–4 km3/yr) and remained in that range for decades (Adams, Reference Adams2003). The main constraining factor that limits high lake levels in the Carson Sink is the broad, relatively flat hypsometry of the basin, which causes large increases in lake surface area and evaporative output with relatively minor increases in lake level.
In contrast, the relatively deep and narrow hypsometry of the Walker Lake basin (Lopes and Smith, Reference Lopes and Smith2007) indicates that a 50 m increase in lake level from 1200 m to 1250 m results in an increase in surface area from 132 to 304 km2 and an increase in volume from about 2.3 to 12.8 km3. The evaporative output from Walker Lake when it is at 1250 m is about 0.4 km3/yr, which is similar to the mean annual historical flow into the basin (Table 1). The near balance between Walker River inflow and the evaporative output of Walker Lake when it is near 1250 m may explain why Walker Lake would have fluctuated around 1245–1255 m during the historical period if upstream water withdrawals had not occurred (Fig. 8) and over the last 2000 years if river diversions had not occurred (Figs. 9 and 10).
The tree-ring chronologies contained within the LBDA may indicate the timing and duration of high-flow periods sufficient to produce high lake levels in the Carson Sink. Cook et al. (Reference Cook, Seager, Heim, Vose, Herweijer and Woodhouse2010) examined precipitation conditions during the MCA and determined that two lengthy droughts in the Great Basin bookended a particularly wet period that lasted 46 yr from AD 1075 to 1121 (875–829 cal yr BP). Spatially, the wettest part of the Great Basin during the Medieval pluvial was in the headwaters of the Humboldt River where PDSI values averaged 1 to 2 (Cook et al., Reference Cook, Seager, Heim, Vose, Herweijer and Woodhouse2010), while PDSI values in the headwater reaches of the Carson and Walker river basins ranged from 0 to 1 during this period. This particularly wet episode overlaps with the radiocarbon age of the Salt Wells beach barrier (660–910 cal yr BP) (Adams, Reference Adams2003), suggesting that this lake expanded to a surface elevation of about 1200 m during this period. The 46-yr duration of the Medieval pluvial constrains the sustained magnitude of flow into the Carson Sink to have been greater than the historical average by about a factor of 4 to 5, based on the modeling of Adams (Reference Adams2003), or similar to the peak annual discharges recorded for the Humboldt and Carson rivers (Table 1). The timing and duration of four other lake stands over the last 2000 years were similarly refined and indicate that discrete pluvial periods affecting the Carson Sink have lasted from 21 to 27 years (Fig. 5) and reflect periods of flow that were also much above the historical average. The temporal refinement of the duration of the wet periods in the Carson Sink led to the drawing of sharply peaked lake-level fluctuations on that curve separated by periods of dryness (Fig. 5). Three high lake periods occurred during the late Holocene dry period (2900 to 1850 cal yr BP; Mensing et al., 2013), suggesting that there may have been a few relatively wet periods in this overall dry episode.
Based on the historical gauge records, it is apparent that during wet periods the Humboldt River can deliver a higher proportion of water to the Carson Sink, relative to its annual average, than the Carson River does. During the wettest years on record, the Humboldt River delivered 4.4 times its mean average annual flow, whereas the Carson River delivered 2.8 times its mean annual flow during the wettest year on record, even though the mean annual discharges for these rivers are similar (Table 1). This discrepancy may be attributable to the much larger size of the Humboldt River basin versus the Carson River basin (Fig. 1). Sustained high discharge volumes in both basins may be influenced by increases in the runoff coefficient during extended wet periods (e.g., Risbey and Entekhabi, Reference Risbey and Entekhabi1996; Menking et al., Reference Menking, Anderson, Shafike, Syed and Allen2004).
Figure 10 shows summary plots of lake-level changes in Walker Lake and the Carson Sink, the time periods when water was flowing through the Walker River paleochannel, the timing of drought terminations in the Walker River (Stine, Reference Stine1994), and paleohydrologic modeling results for Walker Lake. These comparisons indicate that flow through the paleochannel is indeed associated with falling or low Walker Lake levels and sometimes high Carson Sink levels, suggesting that river diversion was at least partly responsible for lake-level fluctuations in both basins. A striking example of this association is during the Medieval pluvial (875–829 cal yr BP; Cook et al., Reference Cook, Seager, Heim, Vose, Herweijer and Woodhouse2010), when Walker lake levels were low even though modeling results indicate that Walker should have been rising from about 1245 m to 1250 m at that time. The death age of trees in the Walker River channel near its headwaters indicate the end of the first of the Medieval droughts at around 830 cal yr BP (Stine, Reference Stine1994) and the beginning of the Medieval pluvial. The Walker River paleochannel was active during the Medieval pluvial and one of the largest lakes in the late Holocene appeared in the Carson Sink, all of which suggests that the Walker River was augmenting the flows of the Carson and Humboldt at this time. Relatively high lake levels during the Medieval pluvial were also recorded at Mono Lake (Stine, Reference Stine1990) and Owens Lake (Bacon et al., Reference Bacon, Lancaster, Stine, Rhodes and McCarley Holder2018).
CONCLUSIONS
This study synthesizes existing data on the late Holocene lake-level histories of the Carson Sink and Walker Lake, augmented by additional dating at key shoreline localities and at sites along the Walker River paleochannel that connects these basins. Moisture-sensitive tree-ring chronologies from the LBDA (Cook et al., Reference Cook, Seager, Heim, Vose, Herweijer and Woodhouse2010) were used to refine the timing and duration of high lake levels in the Carson Sink and to model annual lake-level fluctuations in Walker Lake over the last 2000 years.
Although these basins are in the same general region and are connected by the paleochannel, the details of each of their histories differ in significant ways based on a number of factors. Transient factors include the multiple diversions of the Walker River back and forth between Walker Lake and the Carson Sink, as well as climate variability across these drainage basins that span from the Sierra Nevada to northeast Nevada (Fig. 1).
There are also fundamental differences in some of the physical factors that influence the basin histories, particularly the different hypsometries and drainage basin sizes. The normally dry Carson Sink is broad and flat so that relatively small increases in lake-surface elevation lead to relatively large increases in surface area and evaporative output, thus acting as a strong negative feedback to higher lake levels. In contrast, the relatively narrow and deep Walker Lake basin would have maintained an average lake-surface elevation of 1245–1255 m over the last 100 years under natural conditions, which corresponds to a surface area just large enough to evaporate enough water to balance the mean annual inflow.
Multiple large-scale (±50 m) lake-level fluctuations at Walker Lake in the last 2000 years likely resulted from river diversions. Evidence for this includes the ages of fluvial sediments preserved along the paleochannel that coincide with low Walker Lake levels and tree-ring-based paleohydrologic modeling that suggests that lake levels would have been relatively high over the last 2000 years, absent the diversions.
The large lakes that did occasionally appear in the Carson Sink during the late Holocene were created by relatively wet periods that lasted from two to several decades. The largest of these rose during the 46-yr-long Medieval pluvial centered around AD 1100. Paleohydrologic modeling suggests that discharge into the Carson Sink must have increased by a factor of 4 or 5 and maintained for those decades. In addition to the diversion of the Walker River into the Carson Sink at that time, increased runoff may have also been facilitated by an increase in the runoff coefficient as well as larger parts of the drainage basin contributing runoff.
Regardless of the absolute temporal precision of the lake-level curves presented herein, they probably capture the absolute magnitudes of hydrologic variability possible in these basins under current climate boundary conditions (e.g., Wanner et al., Reference Wanner, Beer, Butikofer, Crowley, Cubasch, Fluckiger and Goosse2008). Reconstructing lake-level fluctuations in closed basins is one of the few ways of documenting the absolute flux of water across the landscape in prehistoric times. Therefore, defining the timing, magnitude, and durations of both dry and wet climate episodes from past lake levels helps to place possible future extremes into context. In this way, knowledge of the recent past essentially informs future possibilities.
Supplementary material
The supplementary material for this article can be found at https://doi.org/10.1017/qua.2018.151.
ACKNOWLEDGMENTS
This research was supported by National Science Foundation grants EAR 0087840 and EAR 1252225, as well as by the Desert Research Institute, but all analyses and interpretations were made by the authors. We thank Mike Lawson and Chris McGuire for their help in luminescence sample collection, Wendy Barrera and Tom Capaldi for sample preparation, and Nathan Brown for sample preparation and measurements. We also thank Edward Cook for providing a copy of the Great Basin portion of the LBDA. Many discussions both in the office and in the field with John Bell are greatly appreciated and helped focus the work. Thanks to John Caskey for providing an unpublished radiocarbon age of Anodonta shells from the Walker River paleochannel. Reviews by Noah Abramson, Jim O'Connor, Derek Booth, and two anonymous reviewers helped improve the clarity and content of the manuscript.