In this issue, Mogg and colleagues from the Old Age Section of the London Institute of Psychiatry (IOP) present their randomized controlled trial of repetitive transcranial magnetic stimulation (TMS) (Mogg et al. Reference Mogg, Pluck, Eranti, Landau, Purvis, Brown, Curtis, Howard, Philpot and McLoughlin2007). They conclude that TMS cannot be supported as adjunctive treatment of major depressive disorder in routine clinical practice. This conclusion defines the niche of the study within the broad domain of therapeutic TMS studies: we are not talking proof of concept or mechanism of action here, not even efficacy as such, but efficacy of add-on treatment controlled for other therapies for 1 month before and 2 weeks after start of the trial, with routine clinical management thereafter. This routine management included TMS even in the placebo-treated group after the 6-week follow-up assessment, so that at 4 months seven of the placebo patients had received a course of TMS. Patients were stimulated over the left prefrontal cortex at 110% of motor threshold. The threshold was determined at the beginning of the study by mapping the site of maximum response for the right abductor pollicis brevis and determining the lowest strength of stimulation required for three of six visible motor responses. This allows the experimenter to calibrate the treatment to the effective excitability of each patient's motor cortex, but also teaches the patient what an active stimulation feels like. Sham treatment in this trial was identical to active TMS from a visual and auditory point of view, but generated no magnetic field, i.e. was not associated with the skin sensation typical of TMS. Patients were treated for 10 sessions of 1000 stimuli given at 10 Hz each. This frequency is considered effective, but the total number of treatments would now be considered as too low by some authors (Loo & Mitchell, Reference Loo and Mitchell2005). But before TMS enthusiasts cry foul, the balance of factors potentially biasing the results in either direction is rather even: short course of treatment of patients not responding to antidepressant alone followed by uncontrolled treatment after 2 weeks and intention-to-treat analysis on the minus side – potential unblinding on the plus side favouring the active TMS group. Moreover, the choices made by the authors were not unreasonable. TMS is labour intensive; it is therefore not likely to be a first-choice treatment. The shorter the course, the more cost effective will be the treatment. TMS will not be feasible as a continuous treatment and routine clinical practice will take over. Similarly, intention-to-treat analysis reflects reality: patients do not remain within controlled settings. Finally, blinding in TMS studies is very difficult to achieve, the most plausible arrangement may be the replacement of TMS in the sham condition with superficial electrical stimulation, but this has not been implemented by major studies.
The IOP results are representative of randomized controlled TMS studies in depression
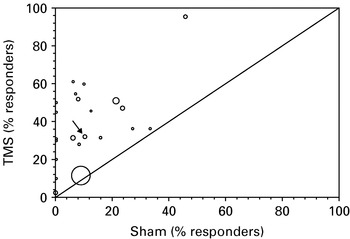
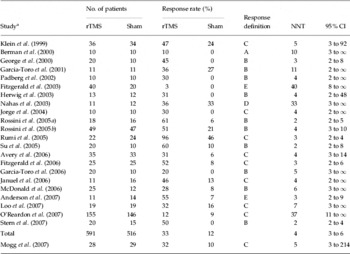
Extending our recent systematic review and meta-analysis of all randomized controlled trials of TMS in depression (Herrmann & Ebmeier, Reference Herrmann and Ebmeier2006) to 2007, and limiting the studies considered to those with 10 and more subjects in both treatment and sham groups, we identified 22 studies (including 16 add-on trials) with 1107 subjects and arrived at a random- effects number-needed-to-treat (NNT) to achieve treatment response of 4 (95% CI 3–6), which means that for every 3–6 patients treated, there is one positive outcome that would not otherwise have occurred. This compares with the IOP NNT of 5 (95% CI 3–214; see Table 1 and Fig. 1). While the IOP study missed significance, the meta-analysis of the 22 previous studies gave a highly significant result (Z test that Peto odds ratio differs from one=9.12, p<0.0001), without statistically significant heterogeneity of the study outcomes (Cochran Q: df=23.9, p=0.30). The TMS response rate was 32%, almost identical with the overall meta-analysis mean of 33%. The sham response rate in the IOP study was 10%, somewhat lower than the pooled response rate of 12%, which together with the reduced power of smaller numbers accounts for the lack of significance.
L'Abbe plot of randomized controlled studies included in the meta-analysis (size of symbols represent sample size). Percentage of TMS responders is plotted against sham responders. Means on the diagonal represent equivalence of effects; any means in the left upper half of the plot represent superiority of TMS over sham treatment. The Mogg et al. (Reference Mogg, Pluck, Eranti, Landau, Purvis, Brown, Curtis, Howard, Philpot and McLoughlin2007) study is indicated by the arrow.

Randomized sham-controlled trials of TMS in depression with more than nine subjects in each group (treatment response data)

NNT, Number needed to treat (rounded up to next natural number); CI, confidence interval; A, Hamilton Depression Rating Scale (HAMD) (25-item); B, HAMD-21; C, HAMD-17; D, HAMD unspecified version; E, Montgomery–Åsberg Depression Rating Scale (>50% reduction).
a A full reference of each of the 22 studies included in Table 1 can be found in the online Appendix at the Journal's website (http://journals.cambridge.org).
TMS research is both enriched and suffers from the flexibility of options that can be chosen for any given treatment protocol. Unlike in pharmacology, where the choice is between doses and possibly routes of administration, TMS protocols can vary in strength of stimulation (magnitude of magnetic field, 80–120% of motor threshold), stimulation frequency (between <1 and 25 Hz), number, length and temporal arrangement of stimulation trains (often determined by safety concerns: long trains may trigger seizures), location of stimulation coil and others. In addition, there is of course variability in the design due to the selection of patients, the permissibility of additional treatment, and the treatment history of patients. That, in spite of this, the study results differ in outcome no more than expected by chance, generates suspicion of a non-specific (i.e. placebo) effect of TMS (Herrmann & Ebmeier, Reference Herrmann and Ebmeier2006). Even in a finer-grained analysis of depression-scale changes in 33 randomized controlled trials, where we did find heterogeneity of results, the only suggestive confounder was whether there had been a change of medication around the time of TMS (Herrmann & Ebmeier, Reference Herrmann and Ebmeier2006). An explanation other than by a placebo effect is, of course, that in spite of over 1000 patients treated in TMS trials, there is not enough power to extract confounder and modifying variables in a meta-regression.
The efficacy of TMS is similar to other psychiatric (adjunctive) treatments
Most psychiatric therapies have NNTs in the range of 3–6 (Pinson & Gray, Reference Pinson and Gray2003). The equivalent NNT for lithium, an established add-on treatment for refractory depression, is 4 (Bauer et al. Reference Bauer, Forsthoff, Baethge, Adli, Berghofer, Dopfmer and Bschor2003), for add-on cognitive-behavioural therapy it is 5 (Pinson & Gray, Reference Pinson and Gray2003). In the elderly, antidepressant treatment trials have resulted in NNTs of 2–3 (imipramine), 1–5 (nortriptyline), 3–4 (citalopram) or 8–32 (fluoxetine) (Katona & Livingston, Reference Katona and Livingston2002). In spite of the authors' negative conclusion, their TMS efficacy falls within the comparable range of NNTs generally accepted for psychiatric treatments and certainly for add-on treatments. If TMS is as effective as other antidepressant treatments, why should it be less acceptable than medication or psychotherapy? There may be a number of explanations: TMS is labour intensive, requires electro-physiological expertise and specialist equipment. Its effects are likely to be short lasting. In this it resembles ECT, which it cannot compete with in terms of efficacy (Ebmeier et al. Reference Ebmeier, Donaghey and Steele2006). Its rationale is somewhat limited, as simply increasing left or reducing right cortical excitability is non-specific and requires further elaboration as an antidepressant mechanism. Finally, no clear dose–response relationship has so far been revealed by the design of previous studies that would convincingly support any particular mechanism. There is therefore still great scope of exploring TMS as a therapeutic tool and it is surely premature to close the quest for the ideal TMS treatment protocol.
Note
Supplementary information accompanies this paper on the Journal's website (http://journals.cambridge.org).
Declaration of Interest
None.