What is the Hierarchical Taxonomy of Psychopathology (HiTOP)?
The HiTOP consortium (http://medicine.stonybrookmedicine.edu/HITOP) is an effort to articulate a fully empirical classification of psychopathology, defined by findings of nosologic research. Its main motivation is to make psychiatric nosology more useful for clinicians and scientists. The consortium currently has 170 members, both psychologists and psychiatrists. The initial HiTOP model was published in 2017 (Kotov et al., Reference Kotov, Krueger, Watson, Achenbach, Althoff, Bagby and Zimmerman2017) and has been elaborated in 23 subsequent publications. The present paper reviews this research, new initiatives, and their implications for psychiatric practice and research.
HiTOP follows the quantitative approach to nosology that seeks to identify natural constellations of signs and symptoms. Over 90 years, this approach produced influential models and widely used measures, including the Child Behavior Checklist (CBCL) and Positive and Negative Syndrome Scale (PANSS) (Achenbach, Reference Achenbach1966; Kay, Fiszbein, & Opler, Reference Kay, Fiszbein and Opler1987; Lorr, Klett, & McNair, Reference Lorr, Klett and McNair1963; Moore, Reference Moore1930). Similar techniques elucidated classifications of affect, personality, and cognitive abilities (Costa & McCrae, Reference Costa, McCrae, Boyle, Matthews and Saklofske2008; McGrew, Reference McGrew2009; Watson, Reference Watson2000). In its publications, the HiTOP consortium integrated evidence from 261 studies of psychopathology structures and 293 studies of their validity and utility (Kotov et al., Reference Kotov, Krueger, Watson, Cicero, Conway, DeYoung and Wright2021). It considered all relevant evidence, including studies that directly measured HiTOP constructs, modeled constructs statistically, or identified common patterns across conditions comprising constructs (e.g. problems that define the internalizing spectrum). Construct names differed across studies and were synchronized to a common nomenclature.
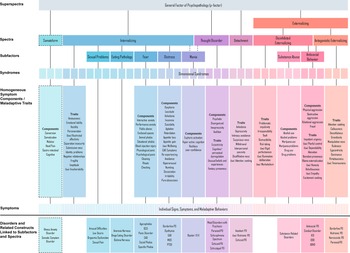
Figure 1 shows the resulting model. Highly correlated specific dimensions are grouped into more general dimensions. Signs, symptoms, and maladaptive behaviors are combined into homogeneous components or traits (e.g. insomnia); those form broader dimensional syndromes (e.g. vegetative depression); closely-related syndromes are combined into subfactors (e.g. distress); larger groups of syndromes form spectra (e.g. internalizing); and those are combined into superspectra (e.g. p factor). Specifically, the p factor represents features common across all of psychopathology, whereas lower-order dimensions capture unique features. Scientists and clinicians can focus on the level of hierarchy needed for a given question (e.g. p factor to identify high utilizers of care, specific components to test potential new medication).
Hierarchical Taxonomy of Psychopathology (HiTOP) model.
Note. Dashed lines indicate dimensions included on a provisional basis, as data on them are limited. Qualifier ‘(low)’ in front of a construct indicates negative relationship with the corresponding spectrum. DSM diagnoses are not included in HiTOP; rather symptoms and signs that constitute them are in the model; also, diagnoses have been used in research to identify HiTOP subfactors and spectra. HiTOP syndromes are empirically derived dimensions rather than DSM disorders. Abbreviations: ADHD, attention-deficit/hyperactivity disorder; DSM, Diagnostic and Statistical Manual of Mental Disorders; GAD, generalized anxiety disorder; IED, intermittent explosive disorder; MDD, major depressive disorder; OCD, obsessive–compulsive disorder; ODD, oppositional defiant disorder; SAD, separation anxiety disorder; PD, personality disorder; PTSD, posttraumatic stress disorder.
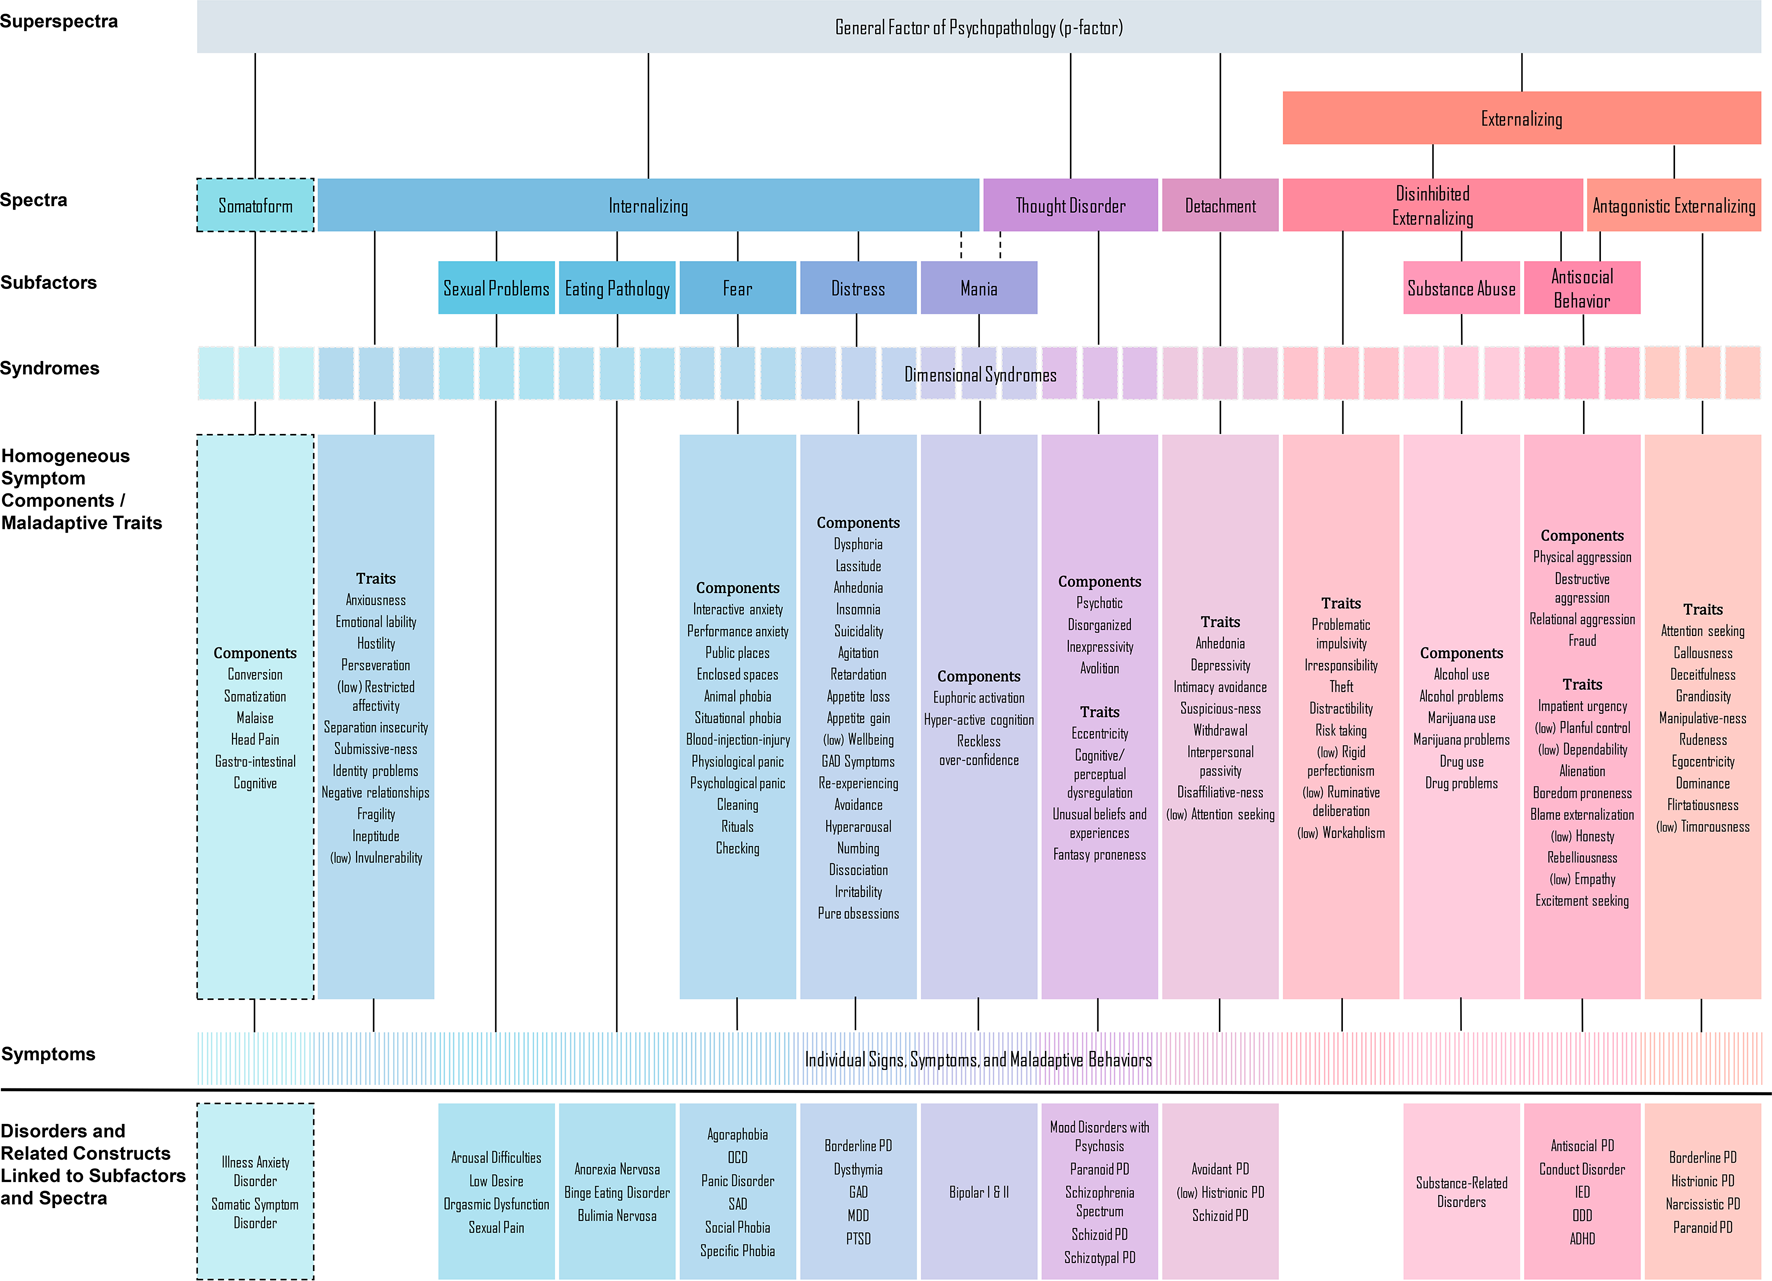
The main outstanding structural questions for HiTOP are determining placement of provisional constructs, explicating empirical syndromes, and adding spectra to expand psychopathology coverage. Studies are ongoing to address these gaps.
How is HiTOP different from DSM-5 and ICD-11?
HiTOP is similar to traditional diagnostic manuals in its atheoretical, descriptive approach and focus on clinical features – signs and symptoms. HiTOP differs from DSM-5 and ICD-11 in conceptualizing psychopathology as extremes of normal psychological functions, such as affective processes, personality traits, and cognitive abilities. Traditional manuals mirror classifications of infectious diseases, which are naturally discrete conditions; whereas HiTOP parallels internal medicine, where many disorders are recognized as continuous with normal functioning (Agarwal et al., Reference Agarwal, Jacobs, Vaidya, Sibley, Jorgensen, Rotter and Herrington2012; American Diabetes Association, 2010; Whelton et al., Reference Whelton, Carey, Aronow, Casey, Collins, Dennison Himmelfarb and Wright2018). Existing research consistently supports the continuity between normality and psychopathology (Haslam, McGrath, Viechtbauer, & Kuppens, Reference Haslam, McGrath, Viechtbauer and Kuppens2020; Krueger et al., Reference Krueger, Kotov, Watson, Forbes, Eaton, Ruggero and Zimmermann2018). Consequently, HiTOP constructs are dimensional.
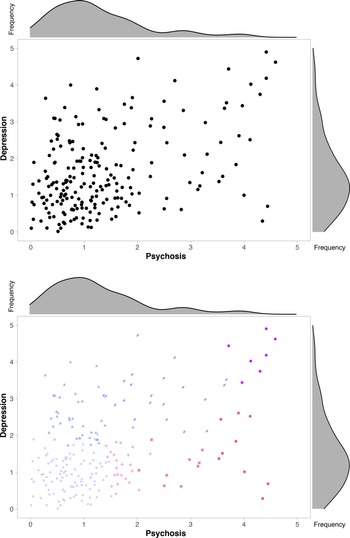
Figure 2 illustrates the mismatch between categorical diagnoses and the nature of psychopathology, which results in four problems. First, extensive evidence indicates that traditional diagnoses have modest interrater reliability and shift over time (Bromet et al., Reference Bromet, Kotov, Fochtmann, Carlson, Tanenberg-Karant, Ruggero and Chang2011; Regier et al., Reference Regier, Narrow, Clarke, Kraemer, Kuramoto, Kuhl and Kupfer2013). This problem is unavoidable because diagnostic boundaries are arbitrary, and the modal case is just above the threshold. Second, even more people fall right below the threshold and are not captured by this system despite substantial symptom burden (Linscott & Van Os, Reference Linscott and Van Os2013; Verheul & Widiger, Reference Verheul and Widiger2004). Third, most patients have multiple disorders (Caspi et al., Reference Caspi, Houts, Ambler, Danese, Elliott, Hariri and Moffitt2020; Kessler, Chiu, Demler, & Walters, Reference Kessler, Chiu, Demler and Walters2005). Correlations among psychopathology dimensions result in high comorbidity among disorders and proliferation of boundary diagnoses (e.g. schizoaffective disorder). Fourth, many diagnoses are heterogeneous and contain multiple psychopathology dimensions (Galatzer-Levy & Bryant, Reference Galatzer-Levy and Bryant2013; Hasler, Drevets, Manji, & Charney, Reference Hasler, Drevets, Manji and Charney2004).
Simulated example of psychopathology distribution in psychiatric outpatients. Panel A shows distribution of psychiatric outpatients along dimensions of psychosis severity and depression severity. Scales range from no symptom (0–1), to subclinical (1–2), to clinical (>2). Density function of each symptom dimension is shown above or to the right of the scatterplot. No zones of rarity are observed. The two types of symptoms are correlated. Panel B shows how traditional diagnostic manuals deal with the lack of natural boundaries and symptom correlation – they designate multiple mutually exclusive categories, represented here by color. Faded squares = no relevant diagnosis; blue triangles = major depressive disorder; violet diamonds = major depressive disorder with psychotic features; purple 9-pointed stars = schizoaffective disorder; pink 4-pointed stars = schizotypal personality disorder; magenta 5-pointed stars = delusional disorder; red 6-pointed stars = schizophrenia.

HiTOP addresses each problem. Dimensional description substantially improves reliability (Markon, Chmielewski, & Miller, Reference Markon, Chmielewski and Miller2011; Narrow et al., Reference Narrow, Clarke, Kuramoto, Kraemer, Kupfer, Greiner and Regier2013). Every patient is characterized by a profile on HiTOP dimensions. Comorbidity is represented by spectra and subfactors. Heterogeneity is reduced by identifying empirically coherent dimensions. Traditional manuals already include some dimensions, and HiTOP fully embraces this movement. Conversely, traditional diagnoses hold an advantage in considering illness course, while HiTOP works toward incorporating course characteristics.
Is HiTOP applicable to diverse populations?
Many quantitative studies focused on people aged 15 to 65 who live in Western societies (Kotov et al., Reference Kotov, Krueger, Watson, Cicero, Conway, DeYoung and Wright2021). HiTOP also reflects a growing literature on other populations. Internalizing and externalizing spectra were first identified in children (Achenbach, Reference Achenbach1966) and have been extensively studied in youth. These spectra are observed in children as young as two years and are consistent across development (McElroy, Belsky, Carragher, Fearon, & Patalay, Reference McElroy, Belsky, Carragher, Fearon and Patalay2018; Murray, Eisner, & Ribeaud, Reference Murray, Eisner and Ribeaud2016; Olino et al., Reference Olino, Bufferd, Dougherty, Dyson, Carlson and Klein2018; Sterba et al., Reference Sterba, Copeland, Egger, Costello, Erkanli and Angold2010). Research on elders is more limited, but suggests that the HiTOP structure remains consistent with age, including people as old as 102 (Eaton, Krueger, & Oltmanns, Reference Eaton, Krueger and Oltmanns2011; Hoertel et al., Reference Hoertel, McMahon, Olfson, Wall, Rodríguez-Fernández, Lemogne and Blanco2015; Sunderland, Slade, Carragher, Batterham, & Buchan, Reference Sunderland, Slade, Carragher, Batterham and Buchan2013). However, existing studies have been limited to higher-order dimensions.
In the United States, HiTOP spectra were found to generalize across gender, race/ethnicity, and sexual orientation (Eaton, Reference Eaton2014, Reference Eaton2020; Eaton et al., Reference Eaton, Keyes, Krueger, Balsis, Skodol, Markon and Hasin2012, Reference Eaton, Keyes, Krueger, Noordhof, Skodol, Markon and Hasin2013; He & Li, Reference He and Li2021; Suzuki et al., Reference Suzuki, South, Samuel, Wright, Yalch, Hopwood and Thomas2019). Cross-cultural studies reported consistent psychopathology structures across 24 Western and 25 non-Western societies (Ivanova et al., Reference Ivanova, Achenbach, Dumenci, Rescorla, Almqvist, Weintraub and Verhulst2007, Reference Ivanova, Achenbach, Rescorla, Turner, Árnadóttir, Au and Zasępa2015, Reference Ivanova, Achenbach, Rescorla, Guo, Althoff, Kan and Verhulst2019; Krueger, Chentsova-Dutton, Markon, Goldberg, & Ormel, Reference Krueger, Chentsova-Dutton, Markon, Goldberg and Ormel2003). Large-scale studies are needed to fully test HiTOP across sociodemographic groups and cultures. The consortium seeks collaborations with local experts to complete them.
Is HiTOP validated?
In traditional manuals, a new disorder is expected to undergo validation showing that it improves understanding of etiology, pathophysiology, prognosis, or treatment response (Andrews et al., Reference Andrews, Goldberg, Krueger, Carpenter, Hyman, Sachdev and Pine2009; Robins & Guze, Reference Robins and Guze1970). However, the process for constructing diagnostic criteria is not specified. Consequently, a diagnosis may have external validity but lack internal coherence. For example, if disorder criteria were selected because each indicates poor prognosis among inpatients, the resulting diagnosis is likely to be quite heterogeneous although useful for prognostication. In contrast, HiTOP starts by analyzing relations among signs and symptoms to identify coherent and distinct constructs, which are then validated to determine their utility. HiTOP systematizes the process of nosologic discovery and retains external validation. Evidence of both internal coherence and external validity guides ongoing revision of HiTOP, which is intended as a living model (Kotov et al., Reference Kotov, Krueger, Watson, Cicero, Conway, DeYoung and Wright2021).
Several reviews related HiTOP dimensions to validators. They generally found that spectra reflect genetics, environmental risk factors, childhood antecedents, neurobiological alterations, biomarkers, and treatment response common across their components (Kotov et al., Reference Kotov, Jonas, Carpenter, Dretsch, Eaton and Forbes2020; Krueger et al., Reference Krueger, Hobbs, Conway, Dick, Dretsch and Eaton2021; Lynch, Sunderland, Newton, & Chapman, Reference Lynch, Sunderland, Newton and Chapman2021; Watson et al., Reference Watson, Levin-Aspenson, Waszczuk, Conway, Dalgleish and Dretsch2022). In other words, conditions placed on the same HiTOP spectrum had similar validator profiles.
Moreover, HiTOP dimensions can improve prognostication over traditional diagnoses. Dimensions were found to predict clinical improvement, treatment needs, and community functioning – in the short-term and long-term – across various outpatient and inpatient populations (Cervin et al., Reference Cervin, Norris, Ginsburg, Gosch, Compton, Piacentini and Kendall2021; Conway et al., Reference Conway, Snorrason, Beard, Forgeard, Cuthbert and Björgvinsson2021; Forbush et al., Reference Forbush, Chen, Hagan, Chapa, Gould, Eaton and Krueger2018; Martin et al., Reference Martin, Jonas, Lian, Foti, Donaldson, Bromet and Kotov2021; Morey et al., Reference Morey, Hopwood, Markowitz, Gunderson, Grilo, McGlashan and Skodol2012). HiTOP also outperformed traditional diagnoses in predicting important life outcomes, such as all-cause mortality (Kim et al., Reference Kim, Turiano, Forbes, Kotov, Krueger and Eaton2021).
HiTOP also informs treatment selection. Several pharmacotherapies and psychotherapies were found to be efficacious across disorders linked to a given spectrum, suggesting that these interventions treat the spectrum. For example, selective serotonin reuptake inhibitors are efficacious for numerous internalizing conditions (Cipriani et al., Reference Cipriani, Furukawa, Salanti, Chaimani, Atkinson, Ogawa and Geddes2018; Gosmann et al., Reference Gosmann, Costa, Jaeger, Motta, Frozi, Spanemberg and Salum2021), and motivational interviewing psychotherapy reduces various disinhibited behaviors (Lundahl, Kunz, Brownell, Tollefson, & Burke, Reference Lundahl, Kunz, Brownell, Tollefson and Burke2010). Likewise, effective treatments have been identified for many narrower dimensions, such as exposure therapy for the fear subfactor (Craske, Treanor, Conway, Zbozinek, & Vervliet, Reference Craske, Treanor, Conway, Zbozinek and Vervliet2014), behavioral activation for anhedonia (Forbes, Reference Forbes2020), and sleep restriction therapy for insomnia (Edinger et al., Reference Edinger, Arnedt, Bertisch, Carney, Harrington, Lichstein and Martin2021).
Ten studies directly compared the power of traditional diagnoses and HiTOP to account for validators concurrently and years later (Fig. 3 and online Supplementary Table S1). HiTOP was superior in 26 of 28 comparisons, with a mean 25.2% variance explained v. 10.7% for diagnoses. These data are encouraging, but validation of HiTOP is only beginning.
Ability of a quantitative nosology and a traditional diagnostic system to explain or predict clinical status, functioning, services, and biomarkers across 10 studies. Bar graphs show joint explanatory power (R 2) of constructs from a given system.

How can HiTOP be used clinically?
In HiTOP, the diagnosis is the patient's profile on psychopathology dimensions (Ruggero et al., Reference Ruggero, Kotov, Hopwood, First, Clark, Skodol and Zimmermann2019). In the profile, spectra and subfactors describe the main difficulties the patient experiences, whereas components and traits detail specific issues. Symptom components capture current problems, whereas traits indicate their chronicity (e.g. high dysphoria component coupled with normal-range trait depressiveness suggest an acute problem with good prognosis). Impaired functioning in society is assessed separately from psychological dysfunction, recognizing that not all patients with significant psychopathology are disabled by it, similar to the distinction that ICD-11 makes between disorder and disability (Clark, Cuthbert, Lewis-Fernández, Narrow, & Reed, Reference Clark, Cuthbert, Lewis-Fernández, Narrow and Reed2017).
The HiTOP approach has four implications for treatment planning. First, clinicians can consider treatment targets both at higher levels, where treatment can affect multiple problems simultaneously (Mullins-Sweatt et al., Reference Mullins-Sweatt, Hopwood, Chmielewski, Meyer, Min, Helle and Walgren2020), and at lower levels, when a specific behavior is particularly significant (e.g. suicidality, opioid misuse) or requires a specialized intervention (e.g. hypnotic drug for insomnia). Second, dimensional case formulation highlights provision of care along the continuum of severity. Clinical actions are usually dichotomous and different actions are appropriate for different levels of severity. HiTOP allows multiple ranges to be specified on a dimension, each indicating a particular action (e.g. low range for prevention, higher for outpatient treatment), whereas traditional diagnosis provides only one threshold. Third, traits provide valuable prognostic information and can substantially outperform traditional lifetime diagnoses in forecasting outcomes (Waszczuk et al., Reference Waszczuk, Hopwood, Luft, Morey, Perlman, Ruggero and Kotov2021a). Fourth, comprehensive assessment identifies patient's strengths (i.e. traits in adaptive range) and weaknesses beyond the current treatment target. For instance, elevated mistrust and irresponsibility traits may guide providers to modify the format of depression treatment to pre-empt potential non-adherence (Bagby, Gralnick, Al-Dajani, & Uliaszek, Reference Bagby, Gralnick, Al-Dajani and Uliaszek2016).
These strategies are not new. Physicians commonly consult other dimensional assessments, such as neuropsychological and intelligence testing (Harvey, Reference Harvey2012). Medical laboratory tests also provide continuous scores with significant elevations identified. HiTOP extends these practices to behavioral profiling. Importantly, a HiTOP profile is only one element of a psychiatric evaluation. Clinicians integrate the profile with other data (e.g. medical comorbidities, stressors, treatment history) to develop case formulation. HiTOP contributes a quantified, detailed, and systematic description of psychopathology to this process.
How to evaluate patients using HiTOP?
The consortium is developing self-report and interview measures to assess constructs included in the model and add missing constructs. This project is a collaboration of 40 psychometrics experts. It follows established procedures for the construction of distinct, reliable, and efficient scales (Clark & Watson, Reference Clark and Watson2019; Loevinger, Reference Loevinger1957). Study protocol and interim results have been published (Simms et al., Reference Simms, Wright, Cicero, Kotov, Mullins-Sweatt, Sellbom and Zimmermann2022), and the HiTOP self-report inventory will be available to researchers in 2022. Next, the consortium will validate the measure – collecting normative, external validity, and clinical utility data – and make it available to clinicians. The consortium is also constructing an interview version, brief screeners that capture broad spectra, and indices for detection of invalid reporting. All measures will be free and open-source, with both digital and paper-and-pencil forms.
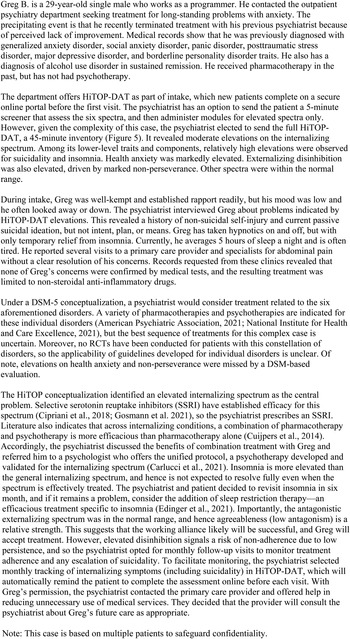
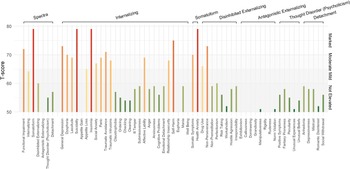
While these measures are in development, the consortium recommends HiTOP-consistent self-report, informant-report, and interviews tools that already are used clinically (see https://hitop.unt.edu/clinical-tools/hitop-friendly-measures). A subset of these scales that captures the majority of HiTOP dimensions was assembled into a digital tool, the HiTOP Digital Assessment and Tracker (HiTOP-DAT). It assesses symptoms and traits within each spectrum as well as functional impairment. The HiTOP-DAT is used for intake in a growing number of clinics. Patients complete it securely online from home or waiting room. Responses are scored automatically, referenced to norms, and the report is immediately emailed to the clinician. The report can be easily uploaded to an electronic health record, similar to laboratory test results. Figures 4 and 5 illustrate clinical use of the HiTOP-DAT on a case example.
Case vignette illustrating the clinical application of HiTOP.

The HiTOP-DAT profile of the illustrative case. Raw scores are converted to t scores, which have mean of 50 and standard deviation of 10 in the general population. Elevations are classified as mild (T score: 61–65), moderate (66–70), or marked (>70). Scores can fall below 50, but this range is not shown for clarity.

The consortium published a manual on clinical application of the HiTOP-DAT (https://osf.io/8hngd/). It includes description of the HiTOP-DAT and guidelines for using it in diagnosis and treatment planning. Reimbursement for services relies on ICD-10-CM codes, so the manual includes a crosswalk to translate HiTOP elevations into these codes (e.g. high eating pathology subfactor into F50.9 Eating disorder, checking component into F42.9 Obsessive-compulsive disorder). Other training materials are freely available, such as a HiTOP-DAT workshop (https://hitop.unt.edu/introduction).
The HiTOP-DAT is compatible with other applications. A screener can be used to identify elevated spectra and focus assessment of lower-level dimensions within these domains, thus reducing patient burden. A monitoring version of HiTOP-DAT can be used to track treatment systematically. It includes scales relevant to the patient and is sent on a desired schedule. The screener or full inventory can be distributed to populations (e.g. students in a school, patients in a primary care clinic), allowing psychopathology detection and prevention on a large scale.
Currently, the HiTOP-DAT uses interpretive ranges specified in reference to norms (e.g. marked elevation is a score >97.5th percentile in the general population), similar to many laboratory or neuropsychological tests (Ruggero et al., Reference Ruggero, Kotov, Hopwood, First, Clark, Skodol and Zimmermann2019). Further research is needed to specify ranges for particular clinical actions, following examples of internal medicine (e.g. hypertension stages; Whelton et al., Reference Whelton, Carey, Aronow, Casey, Collins, Dennison Himmelfarb and Wright2018) and clinical staging (Shah et al. Reference Shah, Scott, McGorry, Cross, Keshavan and Nelson2020).
What is the clinical utility of HiTOP?
Traditional diagnoses show limited clinical utility, evident in practitioners frequently making diagnoses without applying DSM criteria (First & Westen, Reference First and Westen2007) and in extensive off-label prescribing (Taylor, Reference Taylor2016). Clinicians report that diagnosis provides little guidance in treatment selection and prognostication, and is used primarily for billing, training, and communication among professionals (First et al., Reference First, Rebello, Keeley, Bhargava, Dai, Kulygina and Reed2018). Psychiatrists often rely on presenting symptoms rather than diagnoses to plan treatment (Waszczuk et al., Reference Waszczuk, Zimmerman, Ruggero, Li, MacNamara, Weinberg and Kotov2017b). HiTOP can formalize this practice, offering a rigorous framework for dimensional, symptom-oriented, and personality-informed case formulation.
Many studies have surveyed clinicians about the utility of HiTOP dimensions v. traditional diagnoses for personality pathology (Bornstein & Natoli, Reference Bornstein and Natoli2019; Milinkovic & Tiliopoulos, Reference Milinkovic and Tiliopoulos2020; Widiger, Reference Widiger2019). Results clearly favor HiTOP, especially in treatment formulation and communication with patients. This pattern was observed for both psychiatrists and other clinicians, contradicting a common assumption that psychiatrists prefer categories (Morey, Skodol, & Oldham, Reference Morey, Skodol and Oldham2014). Similar findings are emerging for other mental disorders (Moscicki et al., Reference Moscicki, Clarke, Kuramoto, Kraemer, Narrow, Kupfer and Regier2013). In a pilot survey, clinicians trained in HiTOP rated it as equivalent or superior to DSM-5 for building therapeutic alliance, prognostication, treatment selection, education of consumers, documentation, and communication with professionals (online Supplementary Table S2). Further data on clinical utility are being collected in HiTOP-DAT Field Trials, ongoing at nine clinical sites.
HiTOP can enrich teaching of psychiatric assessment and diagnosis. Originally, phenomenology of mental illness was central to psychiatric training, despite the diverging diagnostic perspectives of Kraepelin, Bleuler, Meyer, Jaspers and others. DSM-III brought consistency to psychiatric diagnosis, but in some programs residents' knowledge of psychopathology was limited to DSM criteria and they no longer learned careful psychiatric evaluation (Andreasen, Reference Andreasen2007). Psychometric models of personality generally receive insufficient attention in both biologically- and psychodynamically-oriented programs. Filling these gaps, HiTOP organically organizes trainees' understanding of psychopathology along major spectra. It adds phenomenological knowledge from trait psychology (e.g. maladaptive traits) and descriptive psychopathology. Hence, HiTOP naturally fits the curriculum of the first year of residency.
Can HiTOP guide prevention and public health programs?
The prevalence of mental disorders has not decreased in several decades (James et al., Reference James, Abate, Abate, Abay, Abbafati, Abbasi and Briggs2018). This underscores the difficulty of treating psychopathology once it has developed and the importance of primary prevention (McDaid, Park, & Wahlbeck, Reference McDaid, Park and Wahlbeck2019). The most cost-effective preventive interventions target high-risk groups rather than the entire population (Arango et al., Reference Arango, Díaz-Caneja, McGorry, Rapoport, Sommer, Vorstman and Carpenter2018). However, diagnostic manuals were designed to describe full-fledged disorders and provide little guidance for identifying individuals with nascent psychopathology that has not yet reached the clinical threshold.
HiTOP thoroughly characterizes subthreshold psychopathology, providing a graded and multidimensional picture of vulnerabilities. Moreover, repeated HiTOP assessment (e.g. annual screening) can identify individuals with escalating risk. This assessment can augment traditional risk factors (e.g. family history, trauma exposure). The resulting description may offer a valuable guide for prevention (Forbes, Rapee, & Krueger, Reference Forbes, Rapee and Krueger2019). Clinical staging models also aim to inform prevention (Frank, Nimgaonkar, Phillips, & Kupfer, Reference Frank, Nimgaonkar, Phillips and Kupfer2015; Shah et al., Reference Shah, Scott, McGorry, Cross, Keshavan and Nelson2020). They seek to describe illness course across stages and identify optimal treatments for each stage. HiTOP is compatible with staging models by offering dimensional constructs that can be categorized into stages and companion measures that can trace stage progression over time.
Public health programs also need to detect full-fledged psychopathology in the general population, as only some people with mental health needs seek services (Regier et al., Reference Regier, Narrow, Rae, Manderscheid, Locke and Goodwin1993; Wang et al., Reference Wang, Aguilar-Gaxiola, Alonso, Angermeyer, Borges, Bromet and Wells2007). However, diagnostic manuals were designed for psychiatric settings. Furthermore, traditional diagnostic assessments require a clinical interview, which limits their scalability. HiTOP can be accurately assessed either by interview or self-report (Simms et al., Reference Simms, Wright, Cicero, Kotov, Mullins-Sweatt, Sellbom and Zimmermann2022). Self-reports administered online can screen large populations to facilitate early detection and intervention.
Public health statistics usually focus on numbers of cases, which overlooks both subthreshold symptoms in non-cases and differences in severity among cases. This likely underestimates the impact of psychopathology (Lahey, Reference Lahey2009; Ruscio, Reference Ruscio2019). Likewise, efficacy of interventions is often expressed as the number needed to treat to achieve a categorical outcome (e.g. abstinence from alcohol), which does not capture graded improvement (e.g. reduced consumption). HiTOP allows calculation of the cumulative symptom burden or the cumulative treatment benefit across the full range of the target dimension. It also permits computation of traditional statistics (e.g. prevalence, incidence) using severity ranges as categories. These promising applications of HiTOP in public health management require rigorous testing.
Can HiTOP advance understanding of etiology and pathophysiology?
HiTOP offers good targets for genetic research, as ample evidence – both behavioral and molecular – indicates that the model is aligned with the genetic architecture of psychopathology (Waszczuk et al., Reference Waszczuk, Eaton, Krueger, Shackman, Waldman, Zald and Kotov2020). First, genetic vulnerability to psychopathology is normally distributed and associated with the full range of the target phenotype, from healthy (e.g. minor distractibility) to clinical (e.g. attention-deficit/hyperactivity disorder) (Martin, Taylor, & Lichtenstein, Reference Martin, Taylor and Lichtenstein2018; Plomin, Haworth, & Davis, Reference Plomin, Haworth and Davis2009), consistent with a dimensional nosology. Second, psychiatric phenotypes show high genetic overlap, with many genetic variants influencing multiple phenotypes (Lee et al., Reference Lee, Anttila, Won, Feng, Rosenthal, Zhu and Smoller2019; Martin, Daly, Robinson, Hyman, & Neale, Reference Martin, Daly, Robinson, Hyman and Neale2019). A hierarchical approach helps to understand this pleiotropy as risk variants that contribute to higher-order dimensions (Grotzinger et al., Reference Grotzinger, Rhemtulla, de Vlaming, Ritchie, Mallard, Hill and Tucker-Drob2019; Levey et al., Reference Levey, Stein, Wendt, Pathak, Zhou, Aslan and Gelernter2021). Third, genetic similarities among disorders largely parallel their placement in HiTOP spectra (Kotov et al., Reference Kotov, Jonas, Carpenter, Dretsch, Eaton and Forbes2020; Krueger et al., Reference Krueger, Hobbs, Conway, Dick, Dretsch and Eaton2021; Watson et al., Reference Watson, Levin-Aspenson, Waszczuk, Conway, Dalgleish and Dretsch2022). Accordingly, HiTOP dimensions can be better phenotypes for genetic research than traditional diagnoses.
Specifically, genome-wide association studies (GWAS) of HiTOP dimensions can identify more genetic risk loci than studies of DSM-5 disorders due to improved reliability. This advantage already was observed in GWAS of the externalizing superspectrum (Linner et al., Reference Linner, Mallard, Barr, Sanchez-Roige, Madole, Driver and Dick2021). HiTOP also can help to explicate common and unique loci. The existing approach requires complex multivariate models. HiTOP simplifies this task by providing direct measurement of general and specific phenotypes. Moreover, GWAS with imprecise phenotyping tend to finds loci that predict many forms of psychopathology, whereas precise phenotyping improves specificity (Cai et al., Reference Cai, Revez, Adams, Andlauer, Breen, Byrne and Flint2020). Existing psychiatric polygenic risk scores (PRS) largely capture genetic vulnerability for psychopathology broadly rather than for a specific disorder (Waszczuk et al., Reference Waszczuk, Miao, Docherty, Shabalin, Michelini, Jonas and Kotov2021b). GWAS of HiTOP constructs could produce more precise PRS.
HiTOP also can help to explicate the role of environmental factors in psychopathology. Exposures such as childhood maltreatment, peer victimization, discrimination, and family and romantic strains are implicated in numerous disorders. Studies consistently find that these factors influence spectra, with little additional effect on specific disorders (Conway, Raposa, Hammen, & Brennan, Reference Conway, Raposa, Hammen and Brennan2018, Reference Conway, Forbes, Forbush, Fried, Hallquist, Kotov and Eaton2019; Forbes, Magson, & Rapee, Reference Forbes, Magson and Rapee2020; Keyes et al., Reference Keyes, Eaton, Krueger, McLaughlin, Wall, Grant and Hasin2012; Rodriguez-Seijas, Stohl, Hasin, & Eaton, Reference Rodriguez-Seijas, Stohl, Hasin and Eaton2015; Vachon, Krueger, Rogosch, & Cicchetti, Reference Vachon, Krueger, Rogosch and Cicchetti2015). HiTOP spectra can account for such environmental effects parsimoniously. Other exposures are hypothesized to elicit specific forms of psychopathology, such as peer rejection contributing to the development of social anxiety (Spence & Rapee, Reference Spence and Rapee2016), but have been difficult to test because of comorbidity. A hierarchical nosology can control for comorbidity to pinpoint specific effects of such exposures.
HiTOP can facilitate research on the neurobiology of mental disorders by providing more specific and reliable targets than traditional diagnoses (Latzman & DeYoung, Reference Latzman and DeYoung2020). HiTOP's higher-order dimensions capture neural abnormalities common across multiple disorders, and already have shown replicable links to biobehavioral systems (Michelini, Palumbo, DeYoung, Latzman, & Kotov, Reference Michelini, Palumbo, DeYoung, Latzman and Kotov2021). We illustrate this with three findings. First, the p factor is associated with reduced thickness across much of the neocortex (Romer et al., Reference Romer, Elliott, Knodt, Sison, Ireland, Houts and Hariri2021). Second, the internalizing spectrum is consistently linked to altered amygdala function and connectivity with the anterior cingulate cortex (Hur, Stockbridge, Fox, & Shackman, Reference Hur, Stockbridge, Fox and Shackman2019; Marusak et al., Reference Marusak, Thomason, Peters, Zundel, Elrahal and Rabinak2016). Third, the externalizing superspectrum is correlated with reductions in an electroencephalography signal indexing cognitive control (Venables et al., Reference Venables, Foell, Yancey, Kane, Engle and Patrick2018). However, more work is needed to fully evaluate advantages of HiTOP for etiologic research. Moreover, HiTOP is focused on behavioral patterns and would miss abnormalities that manifest in various unrelated symptoms. This possibility needs to be examined in further research.
How can HiTOP accelerate drug discovery?
Animal models are critical to drug discovery, but poor alignment between these models and traditional diagnoses hinders treatment development (Hyman, Reference Hyman2007). It is more feasible to develop an animal model for a specific psychopathology dimension than a heterogeneous, categorical diagnosis (e.g. for social withdrawal rather than schizophrenia) (Donaldson & Hen, Reference Donaldson and Hen2015). For example, a nonhuman primate model has been established for trait anxiousness (Kenwood & Kalin, Reference Kenwood and Kalin2021). This enabled explication of neurogenetic mechanisms that shape anxiousness (Fox et al., Reference Fox, Oler, Shackman, Shelton, Raveendran, McKay and Kalin2015; Kenwood & Kalin, Reference Kenwood and Kalin2021). The identified mechanisms are expected to translate in humans not only to anxiousness but potentially the fear subfactor that contains this trait in HiTOP. Likewise, the anhedonia dimension has been guiding cross-species translation. Rodent research has shown that κ-opioid receptor antagonists improve deficient reward processing (Pizzagalli et al., Reference Pizzagalli, Smoski, Ang, Whitton, Sanacora, Mathew and Krystal2020). Accordingly, a randomized controlled trial (RCT) selected participants based on elevated anhedonia across diagnoses and found that κ-opioid antagonist improves both neural reward processing and anhedonia symptoms (Krystal et al., Reference Krystal, Pizzagalli, Smoski, Mathew, Nurnberger, Lisanby and Potter2020).
In humans, HiTOP suggests two design changes in RCTs. First, typical studies focus on one disorder and exclude participants with significant comorbidity. This improves rigor when disorders have distinct etiologies, but in psychiatry, etiologic effects largely cut across diagnostic boundaries (see ‘Can HiTOP advance understanding of etiology and pathophysiology?’). Also, most patients in real-world practice have multiple comorbidities, so this design results in unrepresentative samples, diminishing the utility of RCTs (Moberg & Humphreys, Reference Moberg and Humphreys2017; Wisniewski et al., Reference Wisniewski, Rush, Nierenberg, Gaynes, Warden, Luther and Trivedi2009). For treatments that act on spectra, this approach is inefficient because RCTs are required for each individual disorder, instead of fewer studies targeting the overall spectrum. For treatments that act on specific dimensions, efficacy may be obscured in RCTs targeting a heterogeneous disorder. HiTOP recommends selecting the sample according to elevation on the dimension of interest (e.g. broad internalizing, narrow checking). To maximize generalizability, exclusion criteria can be limited to factors with established effects on etiology (e.g. dementia can produce checking behavior) or treatment response (e.g. advanced age can alter drug's pharmacokinetics).
Second, typical RCTs assess few outcomes and may miss unanticipated treatment benefits (Joyce, Kehagia, Tracy, Proctor, & Shergill, Reference Joyce, Kehagia, Tracy, Proctor and Shergill2017). HiTOP-based RCTs would include a comprehensive psychopathology assessment. This does not have to increase power requirements, if trial registration specifies primary endpoints and other dimensions are considered exploratory. Moreover, analyses of treatment effects on trajectories offer more statistical power than analyses of dichotomous outcomes. A growing number of RCTs are using HiTOP to measure treatment outcomes (Aitken et al., Reference Aitken, Haltigan, Szatmari, Dubicka, Fonagy, Kelvin and Goodyer2020; Constantinou et al., Reference Constantinou, Goodyer, Eisler, Butler, Kraam, Scott and Fonagy2019).
HiTOP spectra have shown utility in the development of novel psychotherapies. For instance, the ‘unified protocol’ was developed specifically for treatment of the internalizing spectrum and proved to be efficacious in numerous studies (Barlow et al., Reference Barlow, Farchione, Bullis, Gallagher, Murray-Latin, Sauer-Zavala and Cassiello-Robbins2017; Carlucci, Aristide, & Michela, Reference Carlucci, Aristide and Michela2021). Many other therapies are in development or undergoing evaluation (Dalgleish, Black, Johnston, & Bevan, Reference Dalgleish, Black, Johnston and Bevan2020). HiTOP is starting to inform pharmacologic research. For example, proposed targets for drug development include transdiagnostic social withdrawal, anhedonia, and dimensions of addiction, such as craving and impulsivity (Kas et al., Reference Kas, Penninx, Sommer, Serretti, Arango and Marston2019; Krystal et al., Reference Krystal, Pizzagalli, Smoski, Mathew, Nurnberger, Lisanby and Potter2020; Volkow, Reference Volkow2020).
Currently, psychiatric medications receive regulatory approval for a specific disorder. The U.S. Food and Drug Administration (FDA) has approved treatment indications for some symptom components, but in the context of a specific disorder, such as irritability in autism or suicidal ideation in major depressive disorder (Canady, Reference Canady2020; Robb, Reference Robb2010). A dialog with regulatory agencies is needed to establish transdiagnostic dimensions as acceptable targets for treatment indications.
What are the limitations of HiTOP?
The current model is the first version of HiTOP and has notable limitations. First, it is not yet comprehensive. Research is ongoing to integrate other forms of psychopathology (e.g. cognitive impairments), clarify provisional placements (e.g. mania), and explicate empirical syndromes. Second, HiTOP does not include etiology. This was a deliberate decision, given limited understanding of mental disorders' etiology and difficulties in linking patient's symptoms to specific causes, such as dysphoria to trauma or psychosis to substance use (Larsen & Pacella, Reference Larsen and Pacella2016; Starzer, Nordentoft, & Hjorthøj, Reference Starzer, Nordentoft and Hjorthøj2018). When the etiology of symptoms is clear, a description of contributing factors is an important complement to a HiTOP profile. Third, HiTOP does not include course features (e.g. age of onset, number of episodes, illness duration). Instead, it can incorporate features of trajectories (e.g. mean level, variability over time, symptom cascades, sensitivity to triggers and treatments). Electronic health records and mobile monitoring technologies make explication of trajectories more feasible (Wright & Woods, Reference Wright and Woods2020). Inclusion of trajectory features in HiTOP is an important future direction. Fourth, existing practice guidelines are disorder-based. This knowledge needs to be translated to HiTOP constructs, and development of HiTOP-based guidelines is progressing. Fifth, HiTOP-based assessment may be unnecessarily detailed and potentially infeasible in acute settings, where a singular problem requires rapid intervention. Traditional diagnoses or assessments limited to HiTOP spectra may be optimal for emergency or inpatient care. However, long-term management and preventive interventions can benefit from the full model.
Other research priorities include validation of understudied HiTOP constructs, tailoring the model to different sociodemographic groups and cultures where needed, and systematic application of HiTOP in treatment development. The consortium also is working to maximize the clinical utility of HiTOP diagnosis (e.g. gathering clinician feedback, developing ranges for clinical actions) and construct tools for seamless implementation of HiTOP in clinics. Further explication of links between HiTOP dimensions and etiologic processes (genetic, developmental, environmental, and neurobiological) may enable construction of a new nosology that encompasses both specific etiologies and precise clinical descriptions. The resulting system would include biomarkers along with symptom profiles and trajectories. To accelerate progress toward these goals, the consortium seeks partnerships with organizations that fund and promote psychopathology research.
Conclusions
The consortium has made substantial progress in this short time, but its work is only beginning. HiTOP promises a more reliable and accurate description of psychopathology than traditional manuals, but much of existing knowledge is based on disorders. Hence, while the HiTOP knowledge base matures, it may be prudent to use both nosologies – especially dimensional measures accompanying DSM-5. These systems can complement each other, facilitated by the crosswalk between them (see ‘How to evaluate patients using HiTOP?’). HiTOP is already used clinically, which is possible because the model is based on measures and practices accepted in clinical settings. HiTOP organizes and formalizes these established techniques, providing symptom-oriented and personality-informed case formulation.
A more valid and useful nosology would benefit everyone in psychiatry: scientists, clinicians, trainees, and patients. Hence, in addition to the research consortium, we organized the Clinical Network for practitioners interested in translation to care and the Trainee Network for residents and graduate students. We encourage everyone interested to join the effort (https://renaissance.stonybrookmedicine.edu/HITOP/GetInvolved).
Supplementary material
The supplementary material for this article can be found at https://doi.org/10.1017/S0033291722001301
Financial support
This work was supported by the National Institute of Mental Health (LJS & RK, grant number R01MH122537, and KGJ, grant number R21MH123908).
Conflict of interest
Author SEH is on the Scientific Advisory Boards of Janssen Pharmaceuticals and F-Prime Capital.
Disclaimer
The opinions and assertions expressed herein are those of the authors and do not reflect the official policy or position of the Uniformed Services University of the Health Sciences or the Department of Defense. The contents of this publication are the sole responsibility of the authors and do not necessarily reflect the views, opinions, or policies of The Henry M. Jackson Foundation for the Advancement of Military Medicine, Inc. Mention of trade names, commercial products, or organizations does not imply endorsement by the U.S. Government.