Introduction
When ‘dementia praecox’ was first proposed to describe schizophrenia by Kraeplin in the late 19th century, cognitive deficit was regarded as the core component of the disorder (Dondé, Avissar, Weber, & Javitt, Reference Dondé, Avissar, Weber and Javitt2019), as evidenced by impaired function of higher-order brain regions, such as the prefrontal cortex (Minzenberg, Laird, Thelen, Carter, & Glahn, Reference Minzenberg, Laird, Thelen, Carter and Glahn2009). Since then, perceptual deficits in the development of schizophrenia have been relatively ignored in the research field compared to the focus on the cognitive deficits. Although early sensory deficits have been well described in the schizophrenia literature, they have often been attributed to failures of attention and other top-down mechanisms and not been emphasized within prevailing psychiatric models (Rassovsky, Green, Nuechterlein, Breitmeyer, & Mintz, Reference Rassovsky, Green, Nuechterlein, Breitmeyer and Mintz2005; van der Stelt, Frye, Lieberman, & Belger, Reference van der Stelt, Frye, Lieberman and Belger2004). Traditional top-down models emphasize higher-order cognitive deficit, which lead to deficient integration and organization of lower-level sensory information processes, as evidenced by the impaired casual forward influence of higher-order cognitive regions on sensory input regions during perception in schizophrenia (Dima et al., Reference Dima, Roiser, Dietrich, Bonnemann, Lanfermann, Emrich and Dillo2009; Dima, Dietrich, Dillo, & Emrich, Reference Dima, Dietrich, Dillo and Emrich2010).
However, a growing number of studies demonstrate basic auditory and visual deficits significantly contribute to higher-order cognitive dysfunctions (Butler et al., Reference Butler, Martinez, Foxe, Kim, Zemon, Silipo and Javitt2007, Reference Butler, Abeles, Weiskopf, Tambini, Jalbrzikowski, Legatt and Javitt2009; Calderone et al., Reference Calderone, Hoptman, Martínez, Nair-Collins, Mauro, Bar and Butler2013; Dias, Butler, Hoptman, & Javitt, Reference Dias, Butler, Hoptman and Javitt2011; Dondé et al., Reference Dondé, Avissar, Weber and Javitt2019; Hoptman et al., Reference Hoptman, Parker, Nair-Collins, Dias, Ross, DiCostanzo and Javitt2018; Leitman et al., Reference Leitman, Sehatpour, Higgins, Foxe, Silipo and Javitt2010), and intervention that directly targets the sensory processing impairments can drive substantial gains in higher-order cognition functions, in addition to improving sensory functions (Adcock et al., Reference Adcock, Dale, Fisher, Aldebot, Genevsky, Simpson and Vinogradov2009; Biagianti, Fisher, Neilands, Loewy, & Vinogradov, Reference Biagianti, Fisher, Neilands, Loewy and Vinogradov2016; Dale et al., Reference Dale, Brown, Fisher, Herman, Dowling, Hinkley and Vinogradov2016; Fisher, Holland, Merzenich, & Vinogradov, Reference Fisher, Holland, Merzenich and Vinogradov2009). These findings highlight the importance of sensory processing dysfunction by ‘bottom-up’ dysregulation towards higher cognitive function in schizophrenia (Javitt, Reference Javitt2009b; Javitt & Freedman, Reference Javitt and Freedman2015; Javitt & Sweet, Reference Javitt and Sweet2015), in which the cognitive deficits in schizophrenia could be viewed as hierarchically organized, with deficits in early basic perceptual processes that localize to primary sensory brain regions propagating to higher-order brain cognitive regions contributing to subsequent higher levels functional impairment (Butler et al., Reference Butler, Martinez, Foxe, Kim, Zemon, Silipo and Javitt2007; Calderone et al., Reference Calderone, Hoptman, Martínez, Nair-Collins, Mauro, Bar and Butler2013; Dias et al., Reference Dias, Butler, Hoptman and Javitt2011; Leitman et al., Reference Leitman, Sehatpour, Higgins, Foxe, Silipo and Javitt2010). Accordingly, recent models are gradually shifting the research focus more to the impaired developmental interactions between early sensory and high-order processes in schizophrenia (Javitt, Reference Javitt2009b; Javitt & Freedman, Reference Javitt and Freedman2015; Javitt & Sweet, Reference Javitt and Sweet2015). As such, the identification of neural mechanisms underlying the impaired functional integration between and within early sensory and cognitive brain systems is crucial to understand the pathophysiology mechanisms of schizophrenia, which ultimately helps guide future interventional approaches.
The aforementioned functional interaction can be explored by characterizing functional connectivity within and between different brain systems (Van Den Heuvel & Pol, Reference Van Den Heuvel and Pol2010). Using resting-state functional connectivity (rsFC), researchers are able to observe abnormal FC within the high-order default, frontoparietal network as well as ventral attention network in schizophrenia (Dong, Wang, Chang, Luo, & Yao, Reference Dong, Wang, Chang, Luo and Yao2018; Jiang et al., Reference Jiang, Duan, Chen, Zhang, Gong, Dong and Wang2019; Liao et al., Reference Liao, Fan, Yang, Li, Duan, Cui and Chen2019; Pettersson-Yeo, Allen, Benetti, McGuire, & Mechelli, Reference Pettersson-Yeo, Allen, Benetti, McGuire and Mechelli2011). Aside from these abnormalities, an increasing number of rsFC studies suggest dysfunctional intrinsic connectivity within visual and somatosensory systems in this condition (Bordier, Nicolini, Forcellini, & Bifone, Reference Bordier, Nicolini, Forcellini and Bifone2018; Chen et al., Reference Chen, Duan, Xie, Lai, Dong, Cao and Luo2015, Reference Chen, Duan, He, Yang, Klugah–Brown, Xu and Yao2016; Dong et al., Reference Dong, Duan, Wang, Zhang, Jia, Li and Luo2019; Jiang et al., Reference Jiang, Xu, Zhu, Yang, Li and Zuo2015; Liu et al., Reference Liu, Guo, Zhang, Lv, Hu, Wu and Zhao2018; Zhang, Guo, & Tian, Reference Zhang, Guo and Tian2019). In addition, a recent meta-analysis found altered resting-state regional brain activity both in high-order cognitive regions (e.g. default and ventral attention network) and regions in visual and sensorimotor network (Gong et al., Reference Gong, Wang, Luo, Chen, Huang, Huang and Wang2020). Up to this point, only a few studies have looked at how sensory networks pathologically interact with higher-order association systems in schizophrenia (Berman et al., Reference Berman, Gotts, McAdams, Greenstein, Lalonde, Clasen and Raznahan2016; Hoptman et al., Reference Hoptman, Parker, Nair-Collins, Dias, Ross, DiCostanzo and Javitt2018; Kaufmann et al., Reference Kaufmann, Skåtun, Alnæs, Doan, Duff, Tønnesen and Lagerberg2015). In this more holistic view, brain dysfunction in schizophrenia is proposed to result from the abnormal hierarchical cerebral organization rather than from individual systems alone (Yang et al., Reference Yang, Murray, Wang, Glahn, Pearlson, Repovs and Anticevic2016). However, detecting abnormality in the cerebral hierarchy organization represents a challenge, due to the limited number of approaches explicitly designed to evaluate hierarchical information propagation in the brain system.
Recent advances in neuroscience towards the understanding of brain organizational principles have highlighted a cortical hierarchy as a unifying functional mechanism for information processing in the primate and mouse brains (Burt et al., Reference Burt, Demirtaş, Eckner, Navejar, Ji, Martin and Murray2018; Chaudhuri, Knoblauch, Gariel, Kennedy, & Wang, Reference Chaudhuri, Knoblauch, Gariel, Kennedy and Wang2015; Demirtaş et al., Reference Demirtaş, Burt, Helmer, Ji, Adkinson, Glasser and Murray2019; Fulcher, Murray, Zerbi, & Wang, Reference Fulcher, Murray, Zerbi and Wang2019; Margulies et al., Reference Margulies, Ghosh, Goulas, Falkiewicz, Huntenburg, Langs and Petrides2016; Mesulam, Reference Mesulam2012; Paquola et al., Reference Paquola, De Wael, Wagstyl, Bethlehem, Hong, Seidlitz and Margulies2019, Reference Paquola, Seidlitz, Benkarim, Royer, Klimes, Bethlehem and Frauscher2020; Taylor, Hobbs, Burroni, & Siegelmann, Reference Taylor, Hobbs, Burroni and Siegelmann2015). Specifically, this mechanism refers to the functional system extending from primary sensorimotor to association areas, along which it increasingly represents more abstract and complex information in the brain. This hierarchical architecture facilitates segregated processing of specialized function domains (e.g. sensory and cognitive process), while also enabling a dynamic configuration and cross-communication of networks for more complex and integrated mental activity (Huntenburg, Bazin, & Margulies, Reference Huntenburg, Bazin and Margulies2018; Murphy et al., Reference Murphy, Jefferies, Rueschemeyer, Sormaz, Wang, Margulies and Smallwood2018; Sepulcre, Sabuncu, Yeo, Liu, & Johnson, Reference Sepulcre, Sabuncu, Yeo, Liu and Johnson2012; Taylor et al., Reference Taylor, Hobbs, Burroni and Siegelmann2015). Investigating the cortical hierarchy provides an integrative window into the impairments of functional integration between and within early sensory processing and high-order cognitive functions in schizophrenia.
The present study aimed to examine how the impaired function and integration of both sensory and cognitive processes relates to macroscale cortical hierarchy in schizophrenia. We applied a novel combination of connectome gradient mapping (Margulies et al., Reference Margulies, Ghosh, Goulas, Falkiewicz, Huntenburg, Langs and Petrides2016) and stepwise functional connectivity (SFC) analyses (Martínez et al., Reference Martínez, Martínez-García, Marcos-Vidal, Janssen, Castellanos, Pretus and Carmona2020; Sepulcre et al., Reference Sepulcre, Sabuncu, Yeo, Liu and Johnson2012), which offer complementary characterization of hierarchical abnormalities in schizophrenia. In contrast to the common practice of partitioning brain regions into discrete communities with sharp boundaries, the gradient mapping approach, which is a non-linear decomposition of high-dimensional resting-state functional connectivity (rsFC), can identify brain functional hierarchies by representing brain connectivity in a continuous, low-dimensional space that places sensory and motor networks on one end and transmodal network on the other. This approach thus provides a more integrated vision on the rsFC anomalies in schizophrenia by capturing continuous spatial patterns of connectivity beyond segregated networks and provides simplified representation in terms of main dimensions to characterize the alteration of the macroscale cortical hierarchy in schizophrenia. SFC, developed earlier, has shown that brain hierarchy can also be understood as a sequence of steps in connectivity space. SFC was initiated from a priori-defined sensory seeds-based FC to further examine the hierarchical stream of information from unimodal sensory regions (visual, auditory, and somatosensory) to transmodal regions in schizophrenia patients and healthy controls. More importantly, SFC analytical approach allows for analysis of indirect FC (medium and large connectivity distances from the seed), which is thought to provide information integration about hierarchical flow across specific brain networks (Sepulcre, Reference Sepulcre2014). This approach thus enabled us to investigate the presence of atypical functional transitions from unimodal to multimodal cortical areas in schizophrenia. SFC is well-suitable to confirm the ‘bottom-up’ dysregulation of higher cognitive functions in this condition.
Based on the pathological mechanisms of ‘bottom-up’ dysregulation of higher cognitive functions and deficiency of top-down integration in schizophrenia mentioned above, and the initial observation of impaired connectivity between sensory and cognitive processes system in schizophrenia (Berman et al., Reference Berman, Gotts, McAdams, Greenstein, Lalonde, Clasen and Raznahan2016; Hoptman et al., Reference Hoptman, Parker, Nair-Collins, Dias, Ross, DiCostanzo and Javitt2018; Kaufmann et al., Reference Kaufmann, Skåtun, Alnæs, Doan, Duff, Tønnesen and Lagerberg2015), we hypothesized that the pathological interaction between sensory and cognitive processes in schizophrenia would be reflected by the expected abnormal macroscale cortical hierarchy in schizophrenia. To this end, we first constructed the macroscale cortical hierarchy at voxel level for each subject, and then conducted the statistical comparison between patients with schizophrenia (SZ) and health controls (HC) at voxel level with correction for multiple comparisons using the false discovery rate procedure. Finally, exploratory analyses examined possible correlations between altered gradient values, SFC values and clinical symptoms.
Methods
Participants
Patients were diagnosed with schizophrenia according to the structured clinical interview for DSM-IV Axis I disorders − clinical version (SCID-I-CV). Ninety-six schizophrenia patients and 122 healthy controls were included in the final analysis. See supplementary methods for details about participant recruitment. Demographic and clinical information of all participants is summarized in Table 1. Two groups did not show statistically significant differences in age, sex, education and handedness (p > 0.3). All patients received treatment with antipsychotics. All antipsychotic drugs were converted into chlorpromazine equivalents using Woods conversion (Woods, Reference Woods2003). The mean illness duration is 15.1 years. The authors assert that all procedures contributing to this work comply with the ethical standards of the relevant national and institutional committees on human experimentation and with the Helsinki Declaration of 1975, as revised in 2008. All procedures involving human subjects/patients were approved by the Ethics Committee of the Clinical Hospital of Chengdu Brain Science Institute. Written informed consent was obtained from all subjects.
Demographic characteristics of schizophrenia patients and controls

Notes:
FD, framewise displacements; PANSS, positive and negative syndrome scale.
a x 2 test.
b Data of 76 patients and 111 controls available.
c Data of 72 patients available and calculated using Woods method (Woods, Reference Woods2003).
d Data of 88 patients available.
e Data of 64 patients available.
Data acquisition and image preprocessing
Structural and resting-state functional MRI data were acquired on a 3-T GE Discovery MR 750 scanner at the MRI Center of University of Electronic Science and Technology of China. See supplementary methods for details.
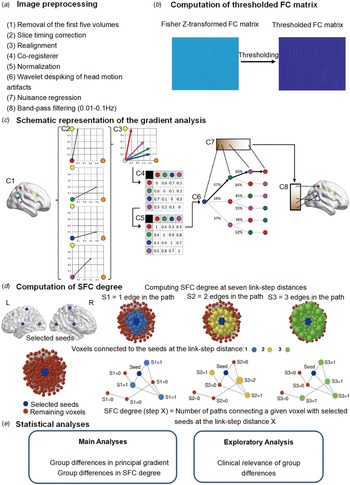
All preprocessing steps were consistent with our previous studies (Ding et al., Reference Ding, Ou, Pan, Shan, Chen, Liu and Guo2019; Dong et al., Reference Dong, Luo, Guell, Wang, He, Duan and Yao2020), see Fig. 1a and supplementary methods for details. To rule out the effects of head motion as much as possible, we conducted wavelet despiking processing, deleting data with high and frequent head motion, regressing out 24 motion parameters and taking relative motion as a covariate in statistical analysis. We did not conduct global signal regression (GSR) in the main analysis because GSR may distort between-group comparisons of inter-regional correlation (Saad et al., Reference Saad, Gotts, Murphy, Chen, Joon Jo, Martin and Cox2012). Besides, studies suggest that altered global signal is an important neuroimaging feature in schizophrenia (Hahamy et al., Reference Hahamy, Calhoun, Pearlson, Harel, Stern, Attar and Salomon2014; Yang et al., Reference Yang, Murray, Repovs, Cole, Savic, Glasser and Pearlson2014). However, because GSR is still controversial, we repeated core analyses (gradient and SFC) with GSR in the control analyses. To reduce computational demands, the rsfMRI data were down-sampled to 4 mm isotropic voxels, resulting in 18 815 voxels. Subsequent gradient and SFC analyses were voxel-based calculation. Consistent with previous voxel-wise FC computation (Tomasi & Volkow, Reference Tomasi and Volkow2010), spatial smoothing was not conducted in the image preprocess step, but was conducted in postprocessing steps (6 mm) for gradient and SFC maps.
Summary of workflow. (a) The steps for image preprocessing. (b) Computation of the thresholded FC. The thresholded FC was then submitted to the gradient and SFC analyses. (c) Schematic representation of gradient analysis. This example (C1) presents a schematic representation of gradient analysis. It illustrates the calculation of the principal functional gradient of four cerebral cortex voxels (red, green, blue, magenta) based on their functional connectivity with two target cerebral cortex voxels (yellow, orange). (C2) Connectivity from each cerebral cortex voxel (red, green, blue, magenta) to the two target cerebral cortex voxels (yellow, orange) is represented as a two-dimensional vector. (C3) All vectors can be represented in the same two-dimensional space. (C4) Cosine distance between each pair of vectors is calculated, and (C5) an affinity matrix is constructed as (1-cosine distance) for each pair of vectors. This affinity matrix represents the similarity of the connectivity patterns of each pair of voxels. (C6) A Markov chain is constructed using information from the affinity matrix. Information from the affinity matrix is thus used to represent the probability of transition between each pair of vectors. In this way, there will be higher transition probability between pairs of voxels with similar connectivity patterns. This probability of transition between each pair of vectors can be analyzed as a symmetric transformation matrix, thus allowing the calculation of eigenvectors. (C7) Eigenvectors derived from this transformation matrix represent the principal orthogonal directions of transition between all pairs of voxels. Here, we illustrate the first resulting component of this analysis – the principal functional gradient of our four cerebral cortex voxels (red, green, blue, magenta) based on their connectivity with our two target cerebral cortex voxels (yellow, orange) progresses from the blue, to the green, to the magenta, to the red voxel. (C8) This order is mapped back into cerebral cortex map, allowing us to generate functional neuroanatomical descriptions. Of note, cerebral cortex functional gradients were calculated using functional connectivity values of each cerebral cortex voxel with the rest of cerebral cortex voxels (rather than between four voxels and only two target cerebellar voxels, as in this example). Vectors in our analysis thus possessed many more than just two dimensions, but cosine distance can also be calculated between pairs of high-dimensional vectors. Figure 1c is adapted from Guell et al. (Reference Guell, Schmahmann, Gabrieli and Ghosh2018). (d) Computation of the SFC. Figure 1d is adapted from Martínez et al.(Reference Martínez, Martínez-García, Marcos-Vidal, Janssen, Castellanos, Pretus and Carmona2020). (e) Statistical analyses.

Connectivity gradient analyses
Gradient mapping techniques describe a continuous coordinate system at the systems level that place sensory and motor networks on one end and transmodel network on the other. This approach thus provides us a simplified representation in terms of main dimensions to characterize the alteration of the macroscale cortical hierarchy in schizophrenia.
First, the voxel-level connectivity matrix for each subject was computed using Fisher's Z-transformed Pearson's correlations (Fig. 1b). Based on previous studies (Dong et al., Reference Dong, Luo, Guell, Wang, He, Duan and Yao2020; Guell, Schmahmann, Gabrieli, & Ghosh, Reference Guell, Schmahmann, Gabrieli and Ghosh2018; Hong et al., Reference Hong, De Wael, Bethlehem, Lariviere, Paquola, Valk and Smallwood2019; Margulies et al., Reference Margulies, Ghosh, Goulas, Falkiewicz, Huntenburg, Langs and Petrides2016), we thresholded the rsFC matrix with the top 10% of connections per row retained, whereas all others were zeroed. The negative connections were zeroed as well. Then, we used cosine distance to generate a similarity matrix that reflected the similarity of connectivity profiles between each pair of voxels. We used diffusion map embedding (Coifman et al., Reference Coifman, Lafon, Lee, Maggioni, Nadler, Warner and Zucker2005), a nonlinear dimensionality reduction algorithm, to identify a low-dimensional embedding from a high-dimensional connectivity matrix. This methodological strategy has been proved to successfully identify relevant aspects of functional organization in the cerebral cortex in previous studies (Hong et al., Reference Hong, De Wael, Bethlehem, Lariviere, Paquola, Valk and Smallwood2019; Margulies et al., Reference Margulies, Ghosh, Goulas, Falkiewicz, Huntenburg, Langs and Petrides2016). Figure 1c showed the schematic representation of the gradient analysis. The result of diffusion embedding is not one single mosaic of discrete networks, but multiple, continuous maps (gradients), which capture the similarity of each voxel's functional connections along with a continuous space. All gradients are orthogonal to each other and capture a portion of data variability in descending order.
To compare between the SZ and HC groups, we used an average connectivity matrix calculated from all patients and controls to produce a group-level gradient component template. We then performed Procrustes rotation to align the gradients of each participant to this template (Langs, Golland, & Ghosh, Reference Langs, Golland and Ghosh2015). To maximize interpretability, we only used the first gradient component in our main analyses. The first gradient explains as much of the variance in the data as possible (~29%, online Supplementary Fig. S1) and, from a neurobiological point of view, represents a well-understood sensorimotor-to-transmodal organizational principle in the cerebral cortex connections. In addition, there's no consensus about the second gradient pattern among the previous studies (Bethlehem et al., Reference Bethlehem, Paquola, Seidlitz, Ronan, Bernhardt, Consortium and Tsvetanov2020; Hong et al., Reference Hong, De Wael, Bethlehem, Lariviere, Paquola, Valk and Smallwood2019; Margulies et al., Reference Margulies, Ghosh, Goulas, Falkiewicz, Huntenburg, Langs and Petrides2016). Furthermore, the second gradient extracted from functional connectivity data could not be reproduced as successfully as the principal gradient at the single-subject level (Guell et al., Reference Guell, Schmahmann, Gabrieli and Ghosh2018). A supplementary exploratory analysis tested group differences using the second gradient component in our analysis. Further analyses based on the second gradient were outside of the scope.
Stepwise functional connectivity analyses
SFC analysis is a graph-theory-based method that detects both direct and indirect functional couplings from a defined seed region to other regions in the brain. More importantly, SFC analytical approach allows for analysis of indirect FC (medium and large connectivity distances from the seed), which is thought to provide information integration about hierarchical flow across specific brain networks (Martínez et al., Reference Martínez, Martínez-García, Marcos-Vidal, Janssen, Castellanos, Pretus and Carmona2020; Pretus et al., Reference Pretus, Marcos-Vidal, Martínez-García, Picado, Ramos-Quiroga, Richarte and Carmona2019; Sepulcre, Reference Sepulcre2014; Sepulcre et al., Reference Sepulcre, Sabuncu, Yeo, Liu and Johnson2012). This approach thus enables us to investigate the presence of atypical functional transitions from unimodal to multimodal cortical areas within the framework of the cortical hierarchy in schizophrenia.
SFC analysis computes the number of functional paths between defined seed regions and every other voxel in the brain at successive numbers of relay stations or ‘link-step’ distances (Martínez et al., Reference Martínez, Martínez-García, Marcos-Vidal, Janssen, Castellanos, Pretus and Carmona2020; Sepulcre, Reference Sepulcre2014; Sepulcre et al., Reference Sepulcre, Sabuncu, Yeo, Liu and Johnson2012). Hence, it complements connectivity gradient approaches by allowing voxel-level functional connections to be assessed at a range of intermediate relay stations. Following previous studies (Martínez et al., Reference Martínez, Martínez-García, Marcos-Vidal, Janssen, Castellanos, Pretus and Carmona2020; Pretus et al., Reference Pretus, Marcos-Vidal, Martínez-García, Picado, Ramos-Quiroga, Richarte and Carmona2019; Sepulcre et al., Reference Sepulcre, Sabuncu, Yeo, Liu and Johnson2012), connectivity matrices were first filtered to include only positive correlations due to the ambiguous interpretation of negative correlations. After that, the connectivity matrices were further filtered to contain only correlations surviving a stringent false-discovery rate (FDR) correction (q < 0.001). Finally, we submitted the resulting FDR thresholded matrices to SFC analysis.
Given that deficits of visual, auditory, and somatosensory processing in schizophrenia were consistently observed [for reviews (Javitt, Reference Javitt2009b; Javitt & Freedman, Reference Javitt and Freedman2015)], three bilateral primary sensory seed regions of interest (ROIs) including visual [MNI coordinates x, y, z: −14/10 (left/right), − 78, 8; (Brodmann 17, V1)], auditory [−54/58, −14, 8; (Brodmann 22, A1)] and somatosensory [−42/38, −29, 65; (Brodmann 3, hand area)] areas (Sepulcre et al., Reference Sepulcre, Sabuncu, Yeo, Liu and Johnson2012), were defined as cubic regions of eight voxels each. To assess the degree of combined SFC of all sensory seeds irrespective of modality, a combined mask was constructed by combining information from all three primary sensory regions. The method is described in detail elsewhere (Martínez et al., Reference Martínez, Martínez-García, Marcos-Vidal, Janssen, Castellanos, Pretus and Carmona2020; Pretus et al., Reference Pretus, Marcos-Vidal, Martínez-García, Picado, Ramos-Quiroga, Richarte and Carmona2019; Sepulcre, Reference Sepulcre2014; Sepulcre et al., Reference Sepulcre, Sabuncu, Yeo, Liu and Johnson2012) and schematically represented in Fig. 1d. The degree of SFC of a given voxel of the brain is defined as the number of functional paths connecting that voxel with an a priori selected seed region at a specific link-step distance. A link-step distance is defined as the number of edges that pertain to a path connecting a given voxel to the seed regions. At each link step, SFC maps were standardized to Z-scores by subtracting the mean and dividing by its standard deviation (s.d.) to yield SFC values. Therefore, each SFC map represents a relative increase of connectivity degree across different link-step distances. As demonstrated in previous studies (Buckner et al., Reference Buckner, Sepulcre, Talukdar, Krienen, Liu, Hedden and Johnson2009; Sepulcre et al., Reference Sepulcre, Sabuncu, Yeo, Liu and Johnson2012), functional pathways ‘collapse’ into the cortical hubs of the adult human brain after link-step distances >7; accordingly, we constrained our SFC analysis to seven link-step distances.
Statistical and control analyses
General linear models were used to determine diagnostic differences (schizophrenia patients (SZ) v. HC) in dependent variables, i.e. Z-normalized values of the principle (first) gradient scores, and SFC degree at each of the seven link-step distances with age, sex, handedness and mean FD controlled for each voxel. This was implemented in DPARBI toolbox (DPABI v4.1, http://rfmri.org/dpabi) (Yan, Wang, Zuo, & Zang, Reference Yan, Wang, Zuo and Zang2016). Two-sample t tests were calculated to determine diagnostic differences (schizophrenia patients (SZ) v. HC) in Z-normalized values of the principal (first) gradient scores, and SFC degree at each of the seven link-step distances. Age, sex, handedness and mean FD were set as covariates. The results for each test are reported at a voxel-based threshold corrected for false-discovery rate of multiple comparisons (FDR voxel-wise correction p < 0.05). We also imposed a minimum cluster extent of 20 voxels. All the results reported below are based on without global signal regression (GSR). GSR, confounding effect analyses of head motion and medication were performed to ensure robustness of the main findings, see supplementary methods for details.
Correlations between altered gradient scores, SFC degree, and clinical variables
As an exploratory investigation, to further examine the relationship between altered gradient scores, SFC degree, and clinical features, we calculated Pearson's correlations between gradient scores, SFC degree and the severity of clinical symptoms measured by PANSS (positive, negative, general psychopathology symptoms subscales and overall scores) in the patients' group. Analyses were computed in each region where the SZ and HC groups differed significantly in the statistical analyses. Given its high correlation with age, illness duration was not included separately in correlation analysis (Moser et al., Reference Moser, Doucet, Lee, Rasgon, Krinsky, Leibu and Frangou2018).
Data and code availability
The preprocessing software is freely available (DPABI v4.1, http://rfmri.org/dpabi) (Yan et al., Reference Yan, Wang, Zuo and Zang2016). The code for gradient analysis is openly available via the BrainSpace toolbox (http://brainspace.readthedocs.io) (de Wael et al., Reference de Wael, Benkarim, Paquola, Lariviere, Royer, Tavakol and Valk2020). The code for SFC analysis is available via a direct request to Jorge Sepulcre. The results were visualized with BrainNet Viewer v1.7 (https://www.nitrc.org/projects/bnv/) (Xia, Wang, & He, Reference Xia, Wang and He2013). The imaging and clinical data are made available via a direct request to the corresponding author (Cheng Luo). Sharing and re-use of imaging and clinical data need the expressed written permission of the authors and clearance from the relevant institutional review boards.
Results
The principal functional gradient of cerebral cortex in schizophrenia
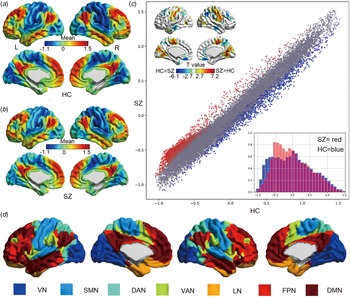
The principal gradient of cerebral cortex FC showed a similar sensorimotor-to-transmodal gradient of cortical organization in HC and SZ (Fig. 2). It extended from primary cortices to transmodal areas. Of note, there was no significant difference between SZ and HC in the explained variance of the principal gradient (two-sample t test, t = 0.86, p = 0.39).
Group mean patterns and statistical differences in the cerebral principal functional gradient. (a) Mean gradient pattern in HC. (b) Mean gradient pattern in SZ. (c) Significant group differences between SZ and HC. Scatterplot represents cerebral gradient of SZ (y axis) v. cerebral gradient of HC (x axis). Scatterplot colors correspond to significant group differences map as shown in top left corner of Fig. 2c: higher gradient value in SZ (red), and lower gradient value in SZ (blue) compared to HC. Compressed gradient pattern in SZ is shown in density histograms in bottom right corner of Fig. 2c. All results are shown after FDR correction (p < 0.05). (d) Yeo network classification (Yeo et al., Reference Yeo, Krienen, Sepulcre, Sabuncu, Lashkari, Hollinshead and Polimeni2011).

Compared to HC (Fig. 2 and Table 2), schizophrenia patients showed increased gradient values in regions of sensorimotor network and visual network, including bilateral post/precentral gyrus, posterior insula, middle occipital gyrus, and lingual gyrus; and decreased gradient scores in transmodal regions mainly belonging to FPN, i.e. middle frontal gyrus, superior frontal gyrus, inferior parietal lobule; also including a few regions in DMN (e.g. medial frontal gyrus, middle temporal gyrus and angular gyrus). Of note, cerebral cortex network allocations are based on Yeo network classification (Yeo, et al., Reference Yeo, Krienen, Sepulcre, Sabuncu, Lashkari, Hollinshead and Polimeni2011), which was also shown in the online Supplementary Fig. S2D. As shown in the scatterplot of Fig. 2c, functional gradient abnormalities in this case extended across the whole principal gradient spectrum. More specifically, higher principal gradient values in the SZ group were localized in the lowest pole of principal gradient (which corresponds to primary sensorimotor and visual processing areas), whereas lower values in the SZ group extended from the medium aspects to the highest pole of principal gradient (transmodal regions).
Group differences in principal functional gradient values

Notes: L, left side of brain; R, right side of brain. Results are reported using a voxel-wise FDR threshold of p < 0.05 and an additional cluster-size threshold of k = 20.
To better characterize the altered pattern of sensorimotor-transmodal hierarchical gradient, global histogram analyses were performed. As shown in the right bottom corner of Fig. 2c, this analysis revealed that there was a prominent compression of the lowest portion of the principal functional gradient and a less prominent compression of the highest portion of the principal functional gradient. Furthermore, Kolmogorov−Smirnov test (Matlab function) indicated that the distribution of SZ group gradient values was significantly different from the distribution of HC group gradient values (p < 0.001, ks2stat = 0.08). To quantitatively demonstrate the overall compression, we tested whether there was a linear correlation between X and X−Y per spatially corresponding voxel (X represents voxel-level gradient values in SZ group mean map, i.e. red histogram of Fig. 2c, Y represents voxel-level gradient values in HC group mean map, i.e. blue histogram of Fig. 2c, and X−Y represents differences of gradient values between SZ and HC mean map per spatially corresponding voxel). We found there was a significant correlation between X−Y and X (r = 0.51, p < 0.001), which suggested the overall gradient value compression in SZ group compared to HC group. In the same logic, we tested the compression of transmodal pole and sensorimotor pole, we found the correlation value in sensorimotor pole (r = 0.53, p < 0.001) was higher than transmodal pole (r = 0.10, p < 0.001), which suggested there was a prominent compression of sensorimotor regions and a less prominent compression of transmodal regions.
Connectivity gradient analysis provides a description of the connectome where each voxel is located along a gradient according to its connectivity pattern. Voxels with similar connectivity patterns are located close to one another along a given connectivity gradient. Therefore, the gradient value represents information about the spatial pattern in the embedding space − shifts in value are not ‘more’ or ‘less,’ but rather reflect changes in relative similarity within a latent dimension, i.e. the similarity of functional connectivity patterns along each dimension (‘gradient’). The gradient values are a scalar, and for this reason significant gradient value alterations in schizophrenia reflect the extent to which the patient group deviates from the HC group. Our interest here was the different spatial distributions of cortical hierarchy between two groups. Interestingly, our finding of compressed cerebral cortical functional gradients suggested a less differentiated global hierarchical organization, i.e. diminished network differentiation in schizophrenia, in which there is a relatively stronger shift in functional affiliation from visual−sensorimotor towards transmodal regions in gradient space.
The SFC degree in schizophrenia
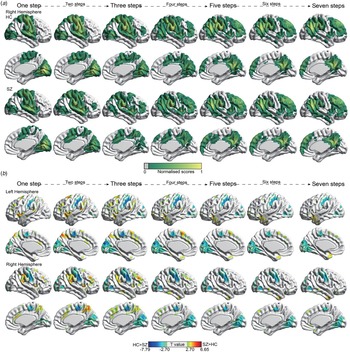
The SFC degree showed a similar spatial transition pattern along the sensation-to-cognition continuum in SZ and HC (Fig. 3a). In steps 1 and 2, sensory-related seeds display a regional–local FC along with the unimodal areas, e.g. somatomotor and visual cortex. From 3 to 7 link-step distances, sensory-related seeds showed gradual transitions towards multimodal integration areas (e.g. dorsal anterior cingulate cortex and frontal eye field, frontoinsular cortex), and eventually displayed convergent to the cortical hubs regions (e.g. dorsolateral prefrontal, inferior lateral parietal cortex, medial prefrontal cortex, posterior cingulate cortex / precuneus or the lateral temporal cortex).
Group patterns and differences in stepwise functional connectivity degree. (a) Stepwise functional connectivity patterns in HC and patients with schizophrenia (one-sample t tests with p < 0.001 uncorrected). In the normalized color scale, 0 represents nonsignificant results (p < 0.001), and 1 is the maximum value corresponding to the smallest p value. Given the results of the left hemisphere are similar to those on the right hemisphere, we only show the results of the right hemisphere for visualization. (b) Group differences between schizophrenia and HC in stepwise functional connectivity degree. All results are shown after FDR correction (p < 0.05).

Statistical comparison indicated that at link-step distance 1, corresponding to classic seed-based FC analysis, patients with schizophrenia showed reduced SFC degree between the unimodal seeds and visual and sensorimotor systems, i.e., bilateral middle occipital gyrus, lingual gyrus and pre/postcentral gyrus (online Supplementary Table S1 and Fig. 3b). Interestingly, this reduced SFC pattern was consistently observed across all link-steps distances (steps 2–7). Increased SFC degree was found between unimodal seeds and frontoparietal regions, i.e. middle/superior frontal gyrus, inferior parietal lobule, supramarginal gyrus, and dorsal precuneus), and ventral attention regions (dorsal anterior cingulate cortex and bilateral anterior insular cortex/central opercular cortex) at early and medium link-step distances (steps 1−4). However, this increased SFC degree gradually faded in the remaining link-step maps (steps 5−7).
Control analyses
Control analyses found GSR, micro head movements and medication did not significantly affect trends of overall results (gradient and SFC analyses), which ensured robustness of main results, see online Supplementary Fig. S2−S3 and supplementary results for details.
Association among altered gradient, SFC and clinical severity of symptoms in schizophrenia
The severity of clinical symptoms was related to decreased functional gradient values in ventral medial frontal gyrus, left anterior insula and left precuneus (online Supplementary Table S2 and Fig. S4). Across all the link-step distances, most of the significant correlations fit the following rule: for those regions involved in high-order cognitive function (i.e. superior frontal gyrus, anterior insular cortex), increased SFC degree was associated with less clinical severity. Accordingly, for those regions involved in sensory processing function, i.e. pre/postcentral gyrus and visual areas, increased SFC degree correlated with greater clinical severity. There is an exception in the left middle frontal gyrus at link-step 4, where increased SFC degree was associated with greater clinical severity. It should be noted that, most of these findings were only seen at uncorrected levels (p < 0.05). Given the exploratory nature of these associations, one should remain cautious when interpreting these results.
Discussion
Recent emerging models and rapidly growing empirical studies emphasize the impaired function and integration of both the early sensory and cognitive processing in understanding the pathophysiology of schizophrenia. Investigating the fundamental sensorimotor-to-transmodal cortical hierarchy organization in schizophrenia would provide critical and integrative experimental evidence for these models. The present study used a novel combination of connectome gradient and SFC analyses to characterize the macroscale cortical hierarchy organization in schizophrenia. In summary, the gradient analysis identified a significantly reduced network differentiation, i.e. gradient compression, in which there is a prominent compression from the sensorimotor system of the cortical hierarchy and a less prominent compression from the higher-level systems such as FPN and DMN. The SFC approach further suggested reduced network differentiation related to atypical functional transitions from unimodal to multimodal cortical areas in schizophrenia. Altogether, the present study provided converging evidence for abnormal cortical hierarchy organization as a system-level substrate underlying the pathological interaction of early sensory and cognitive function in schizophrenia. The findings indicated that impairments at different hierarchical processing steps, especially the foci of effects emphasize that disrupted somatosensory−motor systems may cascade into the higher-order cognitive deficits, which are the hallmark characteristic of schizophrenia.
The cascading effects of early sensory deficits along the sensation-to-cognition continuum
Intriguingly, the present study found a selective gradient compression pattern of the sensorimotor system in the compressed cortical hierarchy organization. Recently, a significant paradigm shift in the research field of schizophrenia has begun to emerge, according to which early regions of the sensory pathway may result in ‘bottom-up’ dysregulation of higher cortical function (Javitt, Reference Javitt2009a, Reference Javittb; Javitt & Freedman, Reference Javitt and Freedman2015; Javitt & Sweet, Reference Javitt and Sweet2015). Further complementing this view, neurophysiology findings indicate that the bottom-up propagation of deficits from early sensory to higher-level processes in schizophrenia occurs even when top-down processes remain intact (Dias et al., Reference Dias, Butler, Hoptman and Javitt2011). Similarly, some recent rsFC and structural studies found that the connectivity deficits of visual and sensorimotor pathway can be detected even when the associative regions, like FPN and DMN, failed to reach statistical significance in schizophrenia (Bordier et al., Reference Bordier, Nicolini, Forcellini and Bifone2018; Chen et al., Reference Chen, Duan, Xie, Lai, Dong, Cao and Luo2015; Guo et al., Reference Guo, Xiao, Liu, Wooderson, Zhang, Zhang and Liu2014; Jørgensen et al., Reference Jørgensen, Nerland, Norbom, Doan, Nesvåg, Mørch-Johnsen and Westlye2016; Liu et al., Reference Liu, Guo, Zhang, Lv, Hu, Wu and Zhao2018; Zhang et al., Reference Zhang, Guo and Tian2019). Our findings of prominent cortical network compression in the sensorimotor and visual systems therefore provides an integrative basis to support previous reports of impaired early sensory processing in schizophrenia. More importantly, this result extends previous findings by showing that the abnormality of early sensory processing is not purely anchored on local functional circuits but rather affects overarching hierarchical cerebral organization, which reflects its global and widespread influence on brain information transitions in schizophrenia.
Furthermore, the SFC findings strengthened global and widespread influence of the early sensory processing on brain information transitions in schizophrenia by demonstrating that the pattern of hypo-connectivity within visual and sensorimotor systems across all (early, medium and large) link-step distances along the sensation-to-cognition continuum. SFC at the 1 (early) link-step distance corresponded to classic seed-based FC analysis. Overall, hypo-connectivity within visual and sensorimotor systems at the 1 link-step distance are largely compatible with the existing seed-based rsFC as well as more sophisticated network-based and/or graph theory analyses in schizophrenia (Bordier et al., Reference Bordier, Nicolini, Forcellini and Bifone2018; Chen et al., Reference Chen, Duan, Xie, Lai, Dong, Cao and Luo2015; Duan et al., Reference Duan, Xia, Womer, Chang, Yin, Zhou and Wang2019; Kaufmann et al., Reference Kaufmann, Skåtun, Alnæs, Doan, Duff, Tønnesen and Lagerberg2015; Liu et al., Reference Liu, Guo, Zhang, Lv, Hu, Wu and Zhao2018; Skåtun et al., Reference Skåtun, Kaufmann, Doan, Alnæs, Córdova-Palomera, Jönsson and Westlye2017). In line with the prominent compression from the sensorimotor and visual system, our stable observation of hypo-connectivity within visual and sensorimotor systems across all link distances suggests an impaired ability to decode early information coming from early sensory regions in schizophrenia. Moreover, the degraded quality of early sensory input would persist, propagate and form the cascading effects along the whole sensation-to-cognition continuum, affecting higher-order integrative networks at subsequent stage of the cortical hierarchy in schizophrenia. These findings provide novel and integrative evidence to support the propagation of sensory deficits to higher cognitive functions in schizophrenia (Calderone et al., Reference Calderone, Hoptman, Martínez, Nair-Collins, Mauro, Bar and Butler2013; Dondé, Silipo, Dias, & Javitt, Reference Dondé, Silipo, Dias and Javitt2019; Javitt, Reference Javitt2009b; Leitman et al., Reference Leitman, Sehatpour, Higgins, Foxe, Silipo and Javitt2010).
The dys-myelination hypothesis of schizophrenia proposed that abnormalities in myelination in the central nervous system may underpin or facilitate the pathogenesis and progress of schizophrenia (Hakak et al., Reference Hakak, Walker, Li, Wong, Davis, Buxbaum and Fienberg2001; Karoutzou, Emrich, & Dietrich, Reference Karoutzou, Emrich and Dietrich2008). Interestingly, a recent study found reduced intracortical myelin in highly myelinated low-level sensory and motor regions in schizophrenia, which could cause disinhibition of sensory input, resulting in abnormal propagation of degraded quality of early sensory input to other cortical areas (Jørgensen et al., Reference Jørgensen, Nerland, Norbom, Doan, Nesvåg, Mørch-Johnsen and Westlye2016). This finding thus provided evidence to further support the cascading effects of early sensory deficits along the sensation-to-cognition continuum. Considering both variations of intracortical myelin and FC across the entire cortex follow the general principle of macroscopic gradients (Paquola et al., Reference Paquola, De Wael, Wagstyl, Bethlehem, Hong, Seidlitz and Margulies2019), future studies integrating the connectomics and myelin feature within gradients-based framework would be especially significant and deepen our understanding of how dysfunctional sensory processing involved in the pathophysiology mechanisms of schizophrenia.
In addition, although deficit of early sensory processing systems is not emphasized within prevailing psychiatric models, our findings are in parallel to the recent neurobiological findings of abnormal early sensory processing which characterize individuals' variability in psychopathology and cognitive impairment across multiple psychiatric disorders (Elliott, Romer, Knodt, & Hariri, Reference Elliott, Romer, Knodt and Hariri2018; Kebets et al., Reference Kebets, Holmes, Orban, Tang, Li, Sun and Yeo2019). So far, with some notable exceptions in neurophysiological studies, hypothesis-driven fMRI studies have primarily targeted high-order brain networks. Consistent with the previous observation of prominent motor pole compression in cerebellar hierarchy (Dong et al., Reference Dong, Luo, Guell, Wang, He, Duan and Yao2020), the present data-driven findings encourage future research to expand the neuroscientific view in schizophrenia and give more attention to sensory processing deficits characterization. Further investigation along these lines would deepen our understanding of the pathophysiology of schizophrenia.
Inefficient integration of bottom-up sensory information with top-down processes
We also found that schizophrenia patients showed hyper-connectivity between unimodal sensory seeds and frontoparietal−ventral-attention regions at the early and medium link distances along the sensation-to-cognition continuum. Several previous seed-based or ROI-based FC studies provide preliminary evidence for sensory networks pathologically interacting with higher-order association systems in the literature of schizophrenia (Berman et al., Reference Berman, Gotts, McAdams, Greenstein, Lalonde, Clasen and Raznahan2016; Hoptman et al., Reference Hoptman, Parker, Nair-Collins, Dias, Ross, DiCostanzo and Javitt2018; Kaufmann et al., Reference Kaufmann, Skåtun, Alnæs, Doan, Duff, Tønnesen and Lagerberg2015). In a more holistic view, we extend the previous studies by showing that this pathological interaction between sensory networks and higher-order association systems exists in the hierarchical information flow, not limited in directed communication (1 link-step). Supporting the cascading effects of sensory process deficits on subsequent high-order cognitive process impairment, our hyper-connectivity may further suggest that the integration of bottom-up sensory information with attentional demands and executive control processes in the sensation-to-cognition continuum is more effortful or less efficient in schizophrenia than in healthy populations.
This inefficient integration process is also characterized by the overall compression of the principal sensorimotor-to-transmodal hierarchy organization, which reflects diminished separation between sensory systems (e.g. visual and sensory regions) involved in the immediate environment and transmodal cognitive systems (e.g. frontoparietal regions) that support complex cognitive inferences. The effective brain function is supported by the maintenance of subnetworks segregation as well as their integration (Wig, Reference Wig2017). Therefore, the diminished network differentiation would unavoidably result in ineffective functional specialization, leading to a blurred boundary between externally oriented immediate environment and internally abstract cognitive processing (Murphy et al., Reference Murphy, Jefferies, Rueschemeyer, Sormaz, Wang, Margulies and Smallwood2018; Northoff & Duncan, Reference Northoff and Duncan2016), which further contributes to the inefficient integration of bottom-up sensory information with top-down processes. Because functional gradients analysis provides a very low-dimensional representation of resting-state connectivity to capture the fundamental corticocortical connectome hierarchy, the compressed corticocortical connectivity hierarchy organization extended previous observations of disturbances in corticocortical connectivity (Phillips et al., Reference Phillips, Nuechterlein, Asarnow, Clark, Cabeen, Yang and Narr2011), by providing an integrative/holistic neuroscientific perspective to understand the disrupted corticocortical connectivity in schizophrenia.
Critically, these cortical hierarchy abnormalities showed trend associations with the severity of clinical symptoms. Specifically, for those regions involved in high-order cognitive function (i.e. superior frontal gyrus, anterior insular cortex), abnormality of hierarchy value was associated with less clinical severity. Accordingly, for those regions involved in sensory processing function, i.e. pre/postcentral gyrus and visual areas, abnormality of hierarchy value correlated with greater clinical severity. These associations might further highlight the importance of cascading impairments of sensory processing and less efficient integration between sensory and cognitive processing to understand the clinical profiles of schizophrenia (Javitt, Reference Javitt2009b; Javitt & Freedman, Reference Javitt and Freedman2015). However, given the exploratory nature of these associations, one should remain cautious when interpreting these results. These results encourage future studies to further verify these exploratory associations.
Implications for future treatment studies
Finally, results reported here also encourage future studies to develop novel intervention strategies, such as complementary sensory-based therapies, which may help to correct early sensory dysfunction and thus further facilitates the remediation of high-order function in schizophrenia. Cognitive training must address limitations in perceptual/pre-attentive processing first (for a review see Vinogradov, Fisher, & de Villers-Sidani, Reference Vinogradov, Fisher and de Villers-Sidani2012). This hope was preliminarily bolstered by some finding of learning-induced neuroplasticity, in which training in early auditory or visual processes results in substantial gains in verbal or visual cognitive processes through ‘bottom-up’ tuning of the neural systems (Adcock et al., Reference Adcock, Dale, Fisher, Aldebot, Genevsky, Simpson and Vinogradov2009; Biagianti et al., Reference Biagianti, Fisher, Neilands, Loewy and Vinogradov2016; Dale et al., Reference Dale, Brown, Fisher, Herman, Dowling, Hinkley and Vinogradov2016; Fisher et al., Reference Fisher, Holland, Merzenich and Vinogradov2009; Hochberger et al., Reference Hochberger, Joshi, Thomas, Zhang, Bismark, Treichler and Cardoso2019; Surti, Corbera, Bell, & Wexler, Reference Surti, Corbera, Bell and Wexler2011). In addition, considering the strong associations between audiovisual temporal processing deficits and clinical symptomatology (Stevenson et al., Reference Stevenson, Park, Cochran, McIntosh, Noel, Barense and Wallace2017), for example, auditory hallucinations (Hugdahl, Reference Hugdahl2009), training aimed at multisensory temporal processing may help relieve clinical symptoms through increasing the individual experience level of perceptual integration in patients with schizophrenia. This hope was also preliminarily supported by our recent works (He et al., Reference He, Yang, Duan, Chen, Lai, Xia and Yao2018; Yang et al., Reference Yang, He, Duan, Chen, Chang, Lai and Yao2018), in which the music intervention (listening to Mozart music), as a type of the auditory input, improved the functional integration in VAN and sensorimotor network in schizophrenia.
Limitation and future direction
Notwithstanding its implications, the main limitations of this study should be acknowledged. A main limitation in the current study, as well as many other clinical imaging studies in the field, is the effect of antipsychotic drugs. While we cannot eliminate completely the potential confounding effects of medication, chlorpromazine equivalents were not associated with the altered gradient or SFC scores. Due to the use of the cross-sectional research design, we did not establish the developmental trajectories of altered cortical hierarchy in schizophrenia. Because altered sensory-motor FC abnormalities have been consistently observed in clinical-high risk, early-stage including drug-naive first-episode, and chronic schizophrenia (Berman et al., Reference Berman, Gotts, McAdams, Greenstein, Lalonde, Clasen and Raznahan2016; Dong et al., Reference Dong, Duan, Wang, Zhang, Jia, Li and Luo2019; Du et al., Reference Du, Fryer, Lin, Sui, Yu, Chen and Mathalon2018; Guo et al., Reference Guo, Xiao, Liu, Wooderson, Zhang, Zhang and Liu2014; Jiang et al., Reference Jiang, Xu, Zhu, Yang, Li and Zuo2015; Luo et al., Reference Luo, He, Duan, Huang, Hu, Wang and Luo2020), it is possible that the prominent compression from the sensorimotor portion of the cortical hierarchy is present at different stages of the illness, possibly ranging from pre-clinical to early and late stages of the disorder. Future longitudinal studies may evaluate the development of cortical hierarchy in schizophrenia across time. And, a supplementary exploratory analysis for the second gradient value in our data showed group differences in the regions of sensorimotor network and visual network, which was similar to the findings in principle gradient value (online Supplementary Fig. S5). This further highlighted the critical role of disorganization of the sensorimotor and visual system in the pathophysiology of schizophrenia. Further testing of this difference is beyond the scope of the current study. However, the findings reported here hint at the possibility of the cerebral cortical functional gradient alterations in schizophrenia beyond the principal gradient of functional connectivity.
Conclusions
The present study provided novel system-level substrate underlying the pathological interaction of early sensory and cognitive function in schizophrenia, i.e. the compression of sensorimotor-to-transmodal cortical hierarchy organization. Within the framework of the compressed cortical hierarchy organization, a cascade of impairments stemming from the disrupted somatosensory−motor system and inefficient integration of bottom-up sensory information with attentional demands and executive control processes may partially account for high-level cognitive deficits of schizophrenia. While top-down processing is certainly deficient in schizophrenia, future investigations of bottom-up dysfunction will further clarify the underlying causes of cognitive deficits in this disorder and promote the development of new treatment intervention.
Supplementary material
The supplementary material for this article can be found at https://doi.org/10.1017/S0033291721002129.
Acknowledgements
We are grateful to all the participants in this study. Our thanks also go to Dr Xi Chen (Civil Aviation Flight University of China) and Mr. Xin Chang (University of Electronic Science and Technology of China) for their help to collect the dataset. A preprint of the present manuscript has been archived on the biorxiv.org preprint server (https://doi.org/10.1101/2020.03.06.980607).
Financial support
This work was supported by the grant from National Key R&D Program of China (C.L., grant number 2018YFA0701400), the grants from the National Nature Science Foundation of China (DZ.Y., grant number 61933003; C.L., grant numbers U2033217, 81771822, 81471638), The Project of Science and Technology Department of Sichuan Province (C.L., 2019YJ0179), and the CAMS Innovation Fund for Medical Sciences (CIFMS) (DZ.Y. and C.L., grant number 2019-I2 M-5-039).
Conflict of interest
None.