


Temperature Profile from Law Dome
In 1993 the glaciology group of the Australian Antarctic Division completed the drilling of a 1200 m deep ice core to bedrock 4.68 km south-southwest of the highest point on the Law Dome ice cap (66°46’ S, 112°48’ E; 1370 m a.s.l.) (Reference Morgan, Wookey, Li, van Ommen, Skinner and FitzpatrickMorgan and others, 1997). In 1996 a temperature profile was inferred from measurements every 10-20 m in the deep borehole, with a measuring accuracy of 0.02 K (Reference Van Ommen, Morgan, Jacka, Woon and ElcheikhVan Ommen and others, 1999). Temperature measurements in the top 50 m are from the cased part of the deep borehole, above the liquid level, and they are disturbed and influenced by the temperature and pressure conditions in the building constructed over the borehole. They do not represent the undisturbed firn and ice temperatures.
In 1997, temperatures were measured in a 270 m deep dry borehole drilled 80 m south of the deep borehole (Reference Van Ommen, Morgan, Jacka, Woon and ElcheikhVan Ommen and others, 1999). These temperatures have an accuracy of 0.05 K, but are believed to be a better representation of the undisturbed firn and ice temperatures than those from shallow depths in the deep borehole. The two temperature profiles were combined in such a way that the shallow borehole profile was used down to 50 m, the depth zone between 50 and 270 m was used to align the two profiles, and the temperatures from the deep borehole were used below 50 m. The combined temperature profile (Fig. la, solid curve) is used to reconstruct the past temperature history. A study of the noise in the data (Fig. lb) clearly shows the increased errors in the measurements from the shallow borehole. Below 750 m depth, convection cells in the borehole liquid are seen to appear. Temperature excursions in the profile due to these cells increase as the temperature gradient increases (Gundestrup, 1989; Reference Gundestrup, Clausen, Hansen and JohnsenGundestrup and others, 1994; Reference Gundestrup and ClowGundestrup and Clow, 1997). The convection cells are smoothed out before the reconstruction of the past temperatures is attempted, as they do not represent ice temperatures.
(a) The measured temperature profile (solid curve) from the Dome Summit South (DSS) borehole on Law Dome, East Antarctica. The top 50 m of the profile is taken from a shallow, air filled borehole 700 m south of the deep DSS hole. The measured profile is compared to a calculated steady-state profile (dashed curve), assuming present surface conditions. Comparison of the curves shows that there is a recent warming from a colder period seen as colder observed temperatures at 10-700 m depth. From 700 to 1196 m, warmer temperatures are observed, suggesting that there was an earlier warmer period, ( b) The noise of the measured temperature profile from (a) (solid curve) is found by comparing the measured data with a smoothed profile. The top 50 m, taken from an air filled borehole, has deviations up to 0.05 K. Below 700 m depth, the noise is seen to increase with depth. A detailed study of this "noise" shows that it comprises differences formed by convection in the borehole liquid. The amplitude of the disturbances increases with increasing temperature gradient (dashed curve).
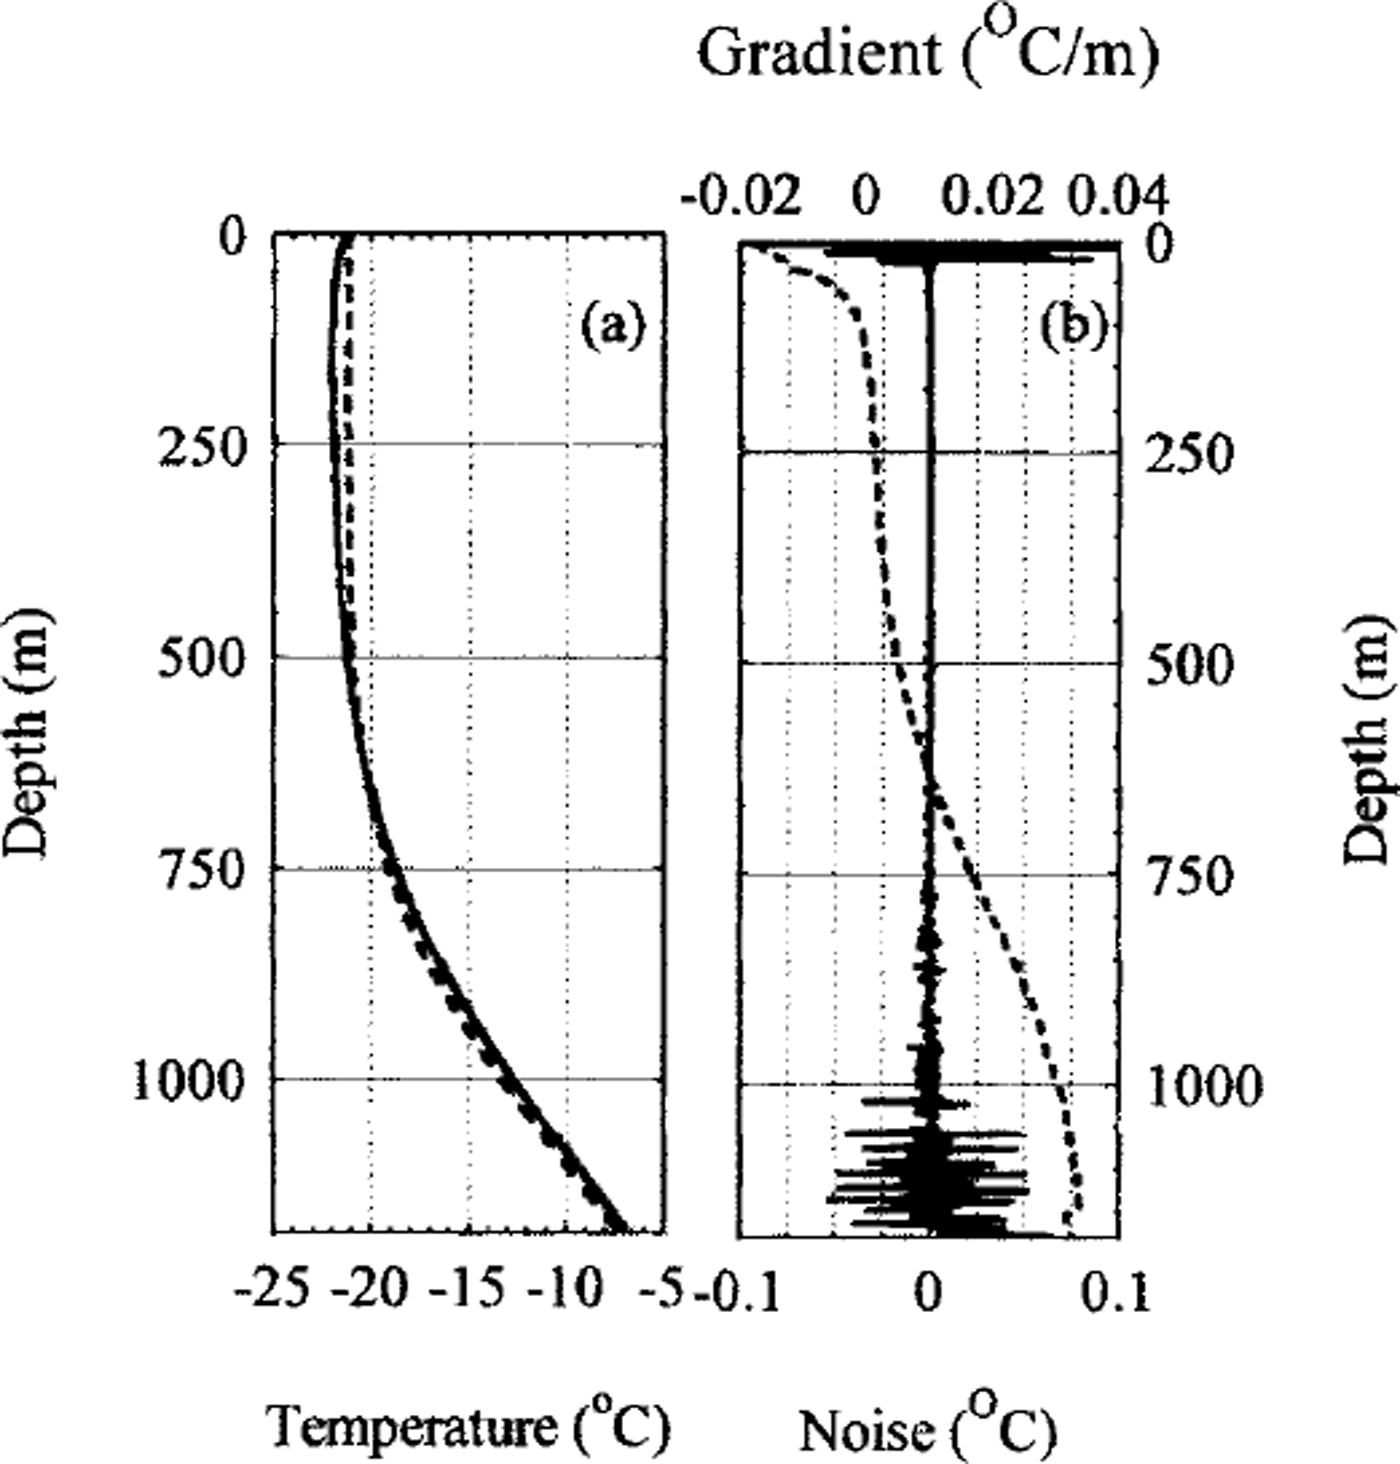
A temperature profile assuming steady-state conditions and the present-day ice-sheet configuration (accumulation rate 0.678 m ice a-1; surface temperature -21.2°G; geothermal heat flux 75.1 mW m-3) is calculated and shown as the dashed curve in Figure la. Comparison between the measured and the modelled temperatures of Figure la provides a first-order estimate on the amount of climate information preserved in the borehole. It is clear that in the past there was a period with colder temperatures, with a recent warming to the present surface conditions. Below 650 m depth the measured temperatures are warmer than the modelled, indicating that there was an even earlier period with warmer temperatures than the present. There is no indication of old colder periods, so we do not expect to find any information on climate conditions during glacial periods in the data.
Heat and Ice-Flow Model
In order to calculate how the temperatures through the ice have changed back in time, we need to formulate a coupled heat- and ice-flow equation with boundary conditions. The applied heat-flow equation is (Reference Dahl-Jensen and JohnsenDahl-Jensen and Johnsen, 1986; Reference Johnsen, Dahl-Jensen, Dansgaard and GundestrupJohnsen and others, 1995; Reference Dahl-JensenDahl-Jensen and others, 1998):

where T(x, z,t) is temperature, t is time, z is distance above bedrock, x is horizontal distance along the flowline, p(z) is ice density, K(T, p) is the thermal conductivity, c(T) is the specific heat capacity and f(x,z,t) is the heat-production term. The ice velocities, v(x, z, t) control the advective term in the heat-flow model. The heat-flow Equation (1) can be reduced to a one-dimensional equation in the Law Dome case because the borehole is located close to the summit of the dome where the horizontal velocity, the horizontal derivatives of T and the internal heat production, / , can be neglected:

The vertical velocity, w(z, t) is approximated by a simple Dansgaard-Johnsen profile (Reference Dansgaard and JohnsenDansgaard and johnsen, 1969; Reference Johnsen, Dansgaard, Bard and BroeckerJohnsen and Dansgaard, 1992; Reference Morgan, Wookey, Li, van Ommen, Skinner and FitzpatrickMorgan and others, 1997) in which the vertical strain rate is constant down to a specified depth (the break depth) and then decreases linearly to zero at the bedrock.
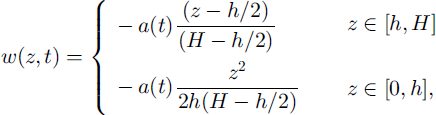
where a{t) is the time-dependent accumulation rate, H is the ice-equivalent ice thickness (1178 m) and h is the distance above bedrock of the break point of the vertical strain rate (248 m). H and h are assumed to be constant with time, and a(t) is assumed to vary as a function of the surface ternperature Tsur(t):

where a0 is the present-day accumulation rate (0.678 m ice a-1) and T0 is the present-day surface temperature (-21.2°C). a (a ∼ 9(a/a0)/9Ts u r ) , the relative change of accumulation rate per °C, determines the temperature effect on the accumulation rate. Estimates of a range from 3-4% from general circulation models to 10% from polar models. Here a value of 7% (a = 0.07) has been used with control runs for a = 0.03 and 0.10. The equation is based on results from Law Dome (Reference Morgan, Goodwin, Etheridge and WookeyMorgan and others, 1991; Reference Van Ommen and MorganVan Ommen and Morgan, 1996), fromVostok (Reference Salamatin, Lipenkov, Barkov, Jouzel, Petit and RaynaudSalamatin and others, 1998) and from similar equations used to describe the accumulation-temperature coupling in Greenland (Reference Dahl-Jensen, Johnsen, Hammer, Clausen, Jouzel and PeltierDahl-Jensen and others, 1993; Reference Johnsen, Dahl-Jensen, Dansgaard and GundestrupJohnsen and others, 1995; Reference Cuffey and ClowCuffey and Clow, 1997). Recent observations of accumulation changes during the last 30 years have a values as high as 0.5 (Reference Morgan, Goodwin, Etheridge and WookeyMorgan and others, 1991; Reference Peel, Bradley and JonesPeel, 1992), but this is not believed to represent the longer time period treated here. It will be shown later that the reconstructed temperature history spans only the last 4 ka, where surface temperatures have changed by only a few °C, and that there is no memory left of the Last Glacial Maximum. The control runs with a = 0.03 and 0.10 vary the reconstructed temperatures by <0.1K, so we conclude that the value of a in Equation (4) is not a sensitive parameter for our analysis.
The calculations are started 100 ka back in time, which is far beyond the memory of the system. The applied boundary conditions are:


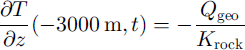

Symbols above are as previously defined, with the addition that Qgeo is the geothermal heat flux. A value of 75.1 mW nT2 is found (later) to be most probable (see Fig. 2e) for Qgeo.The initial boundary condition Tss, (Equation (5a)), is a steady-state temperature profile for glacial conditions. The calculations are started so far back in time that the initial temperature profile will not influence the temperature history through the last 4 ka. The second condition (Equation (5b)) is the unknown temperature history to be reconstructed. The third condition (Equation (5c)) is placed 3 km below the ice/ bedrock interface, where all past temperature changes are assumed to be diffused out. The fourth condition (Equation (5d)) assures that the heat is transferred through the ice-rock boundary at the bedrock (z = 0), assuming that the ice here has always been below the pressure-melting point. Equations (2)-(5) define the boundary value problem, which can be solved when the temperature history and the geothermal heat flux are known.
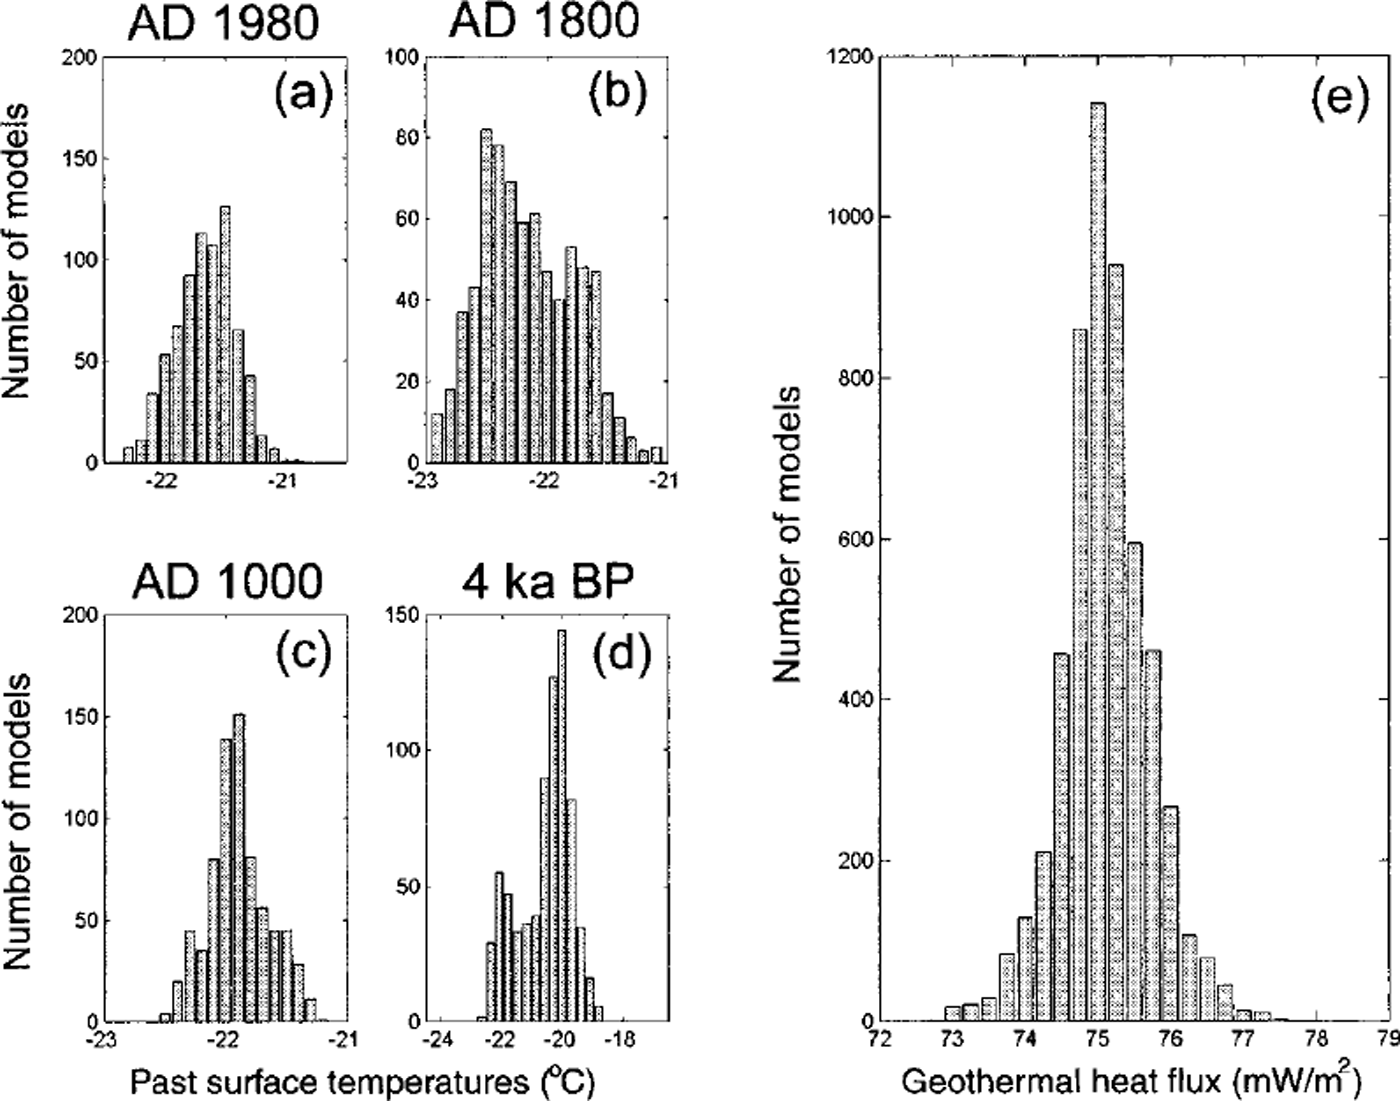
(a-d) The probability distribution of the past surface temperatures at selected times before present. They are constructed as histograms of the 5500 Monte Carlo sampled and accepted temperature histories. All temperature distributions are seen to have a maximum, a most likely value, which is assumed to be the reconstructed surface temperature at these times, (e) The probability distribution of the accepted geothermal heat fluxes. The most likely value is 75.1mWm2.
The problem is solved with a Crank-Nicholson finite-difference scheme where the depth is divided into steps of 20 m and the maximum time-step is 75 years. The unknown temperature history is assumed to be a smooth curve through 50 values that are to be determined. Temperature values are changed at intervals which vary logarithmically from 12 ka when calculations are commenced (t = -100 ka) to 8 a at the present (t = 0 a). The calculations in the Crank-Nicholson scheme use time-steps no larger than 20% of the time-varying intervals.
The Monte Carlo Inverse Method
A Monte Carlo method has been developed to describe the information on past climate that can be derived from the measured temperature profile (Reference Mosegaard and TarantolaMosegaard and Tarantola, 1995; Reference Dahl-JensenDahl-Jensen and others, 1998; Reference MosegaardMosegaard, 1998). The Monte Carlo method tests randomly selected combinations of climate history and geothermal heat flux by using them as input to the coupled heat- and ice-flow model, and considering the resulting degrees of fit between the reproduced and measured temperature profiles.
The Monte Carlo scheme uses a random walk in the high dimensional space of all possible models, m (temperature histories and geothermal heat fluxes). The temperature history has been divided into 50 intervals as described above, so including the geothermal heat flux as an unknown gives a 51-dimensional model. In each step of the random walk a perturbed model, m U of the current model vector m* is proposed. The next model becomes equal to m\elt with an acceptance probability Paccept = min(l, exp{-[S(m\elt) -S(m%) where S(m) = S,[^(m) - ^ o b s ] 2 which is the misfit function measuring the difference between g(m), the calculated borehole temperatures, and dobs, the observed temperatures. If the perturbed model is rejected, the next model becomes equal to m* and a new perturbed model is proposed.
To ensure an efficient sampling of all possible models, different techniques have been developed for choosing the temperature histories and geothermal heat fluxes to be tested. The main scheme to perturb the models is to randomly select one of the 51 temperature/heat-flux parameters and change its value to a new value chosen uniformly at random within a given interval. A singular value decomposition (SVD) of the matrix G = {dg3/dmt}, evaluated in a near-optimal model, yields a set of eigenvectors in the model space whose orientations reveal efficient directions of perturbation for the random walk. The SVD method is included as a possible method of perturbing models, especially at the start of the process, as it speeds the Monte Carlo scheme significantly.
The results presented here are based on tests of 8 x 10⁶ models. Of the approximately 30% that were accepted by the Monte Carlo scheme, every 500th is chosen where the misfit function S is less than the variance of the observations. Thus, 5500 independent solutions were selected. The step of 500 was chosen to exceed the maximum correlation length of the output model parameters, a necessary condition for the 5500 models to be uncorrelated. To further ensure that the output models were uncorrelated, the random walk was frequently restarted at randomly selected points in the model space. The 5500 climate histories and heat fluxes are sampled with a frequency proportional to their likelihood (Reference Mosegaard and TarantolaMosegaard and Tarantola, 1995) and all accepted solutions fit the observations within their limits of uncertainty. A statistical analysis leads to the desired estimate of the past climate changes.
Results
Histograms can be made of the sampled geothermal heat fluxes and of the temperature histories at given times before present. The probabilistic formulation of the inverse problem leads to the definition of a probability distribution in the model space, describing the likelihood of possible temperature histories and geothermal heat-flow densities. The Monte Carlo scheme is constructed to sample according to this probability distribution. The histograms in Figure 2 describe the probability distribution of the geothermal heat flux and temperatures at selected times before present. The maxima in the histograms thus describe the most likely values. The method does not constrain the distributions to have a single maximum; indeed there could be histograms with several maxima (e.g. Fig. 2b), reflecting the fact that more than one value of the temperature at this time would give a good fit to the observed temperature in the borehole. The histograms however, all have a well-defined zone of most likely past temperatures. A smooth curve is fitted to the histograms, and the maximum value is taken as the most likely value.
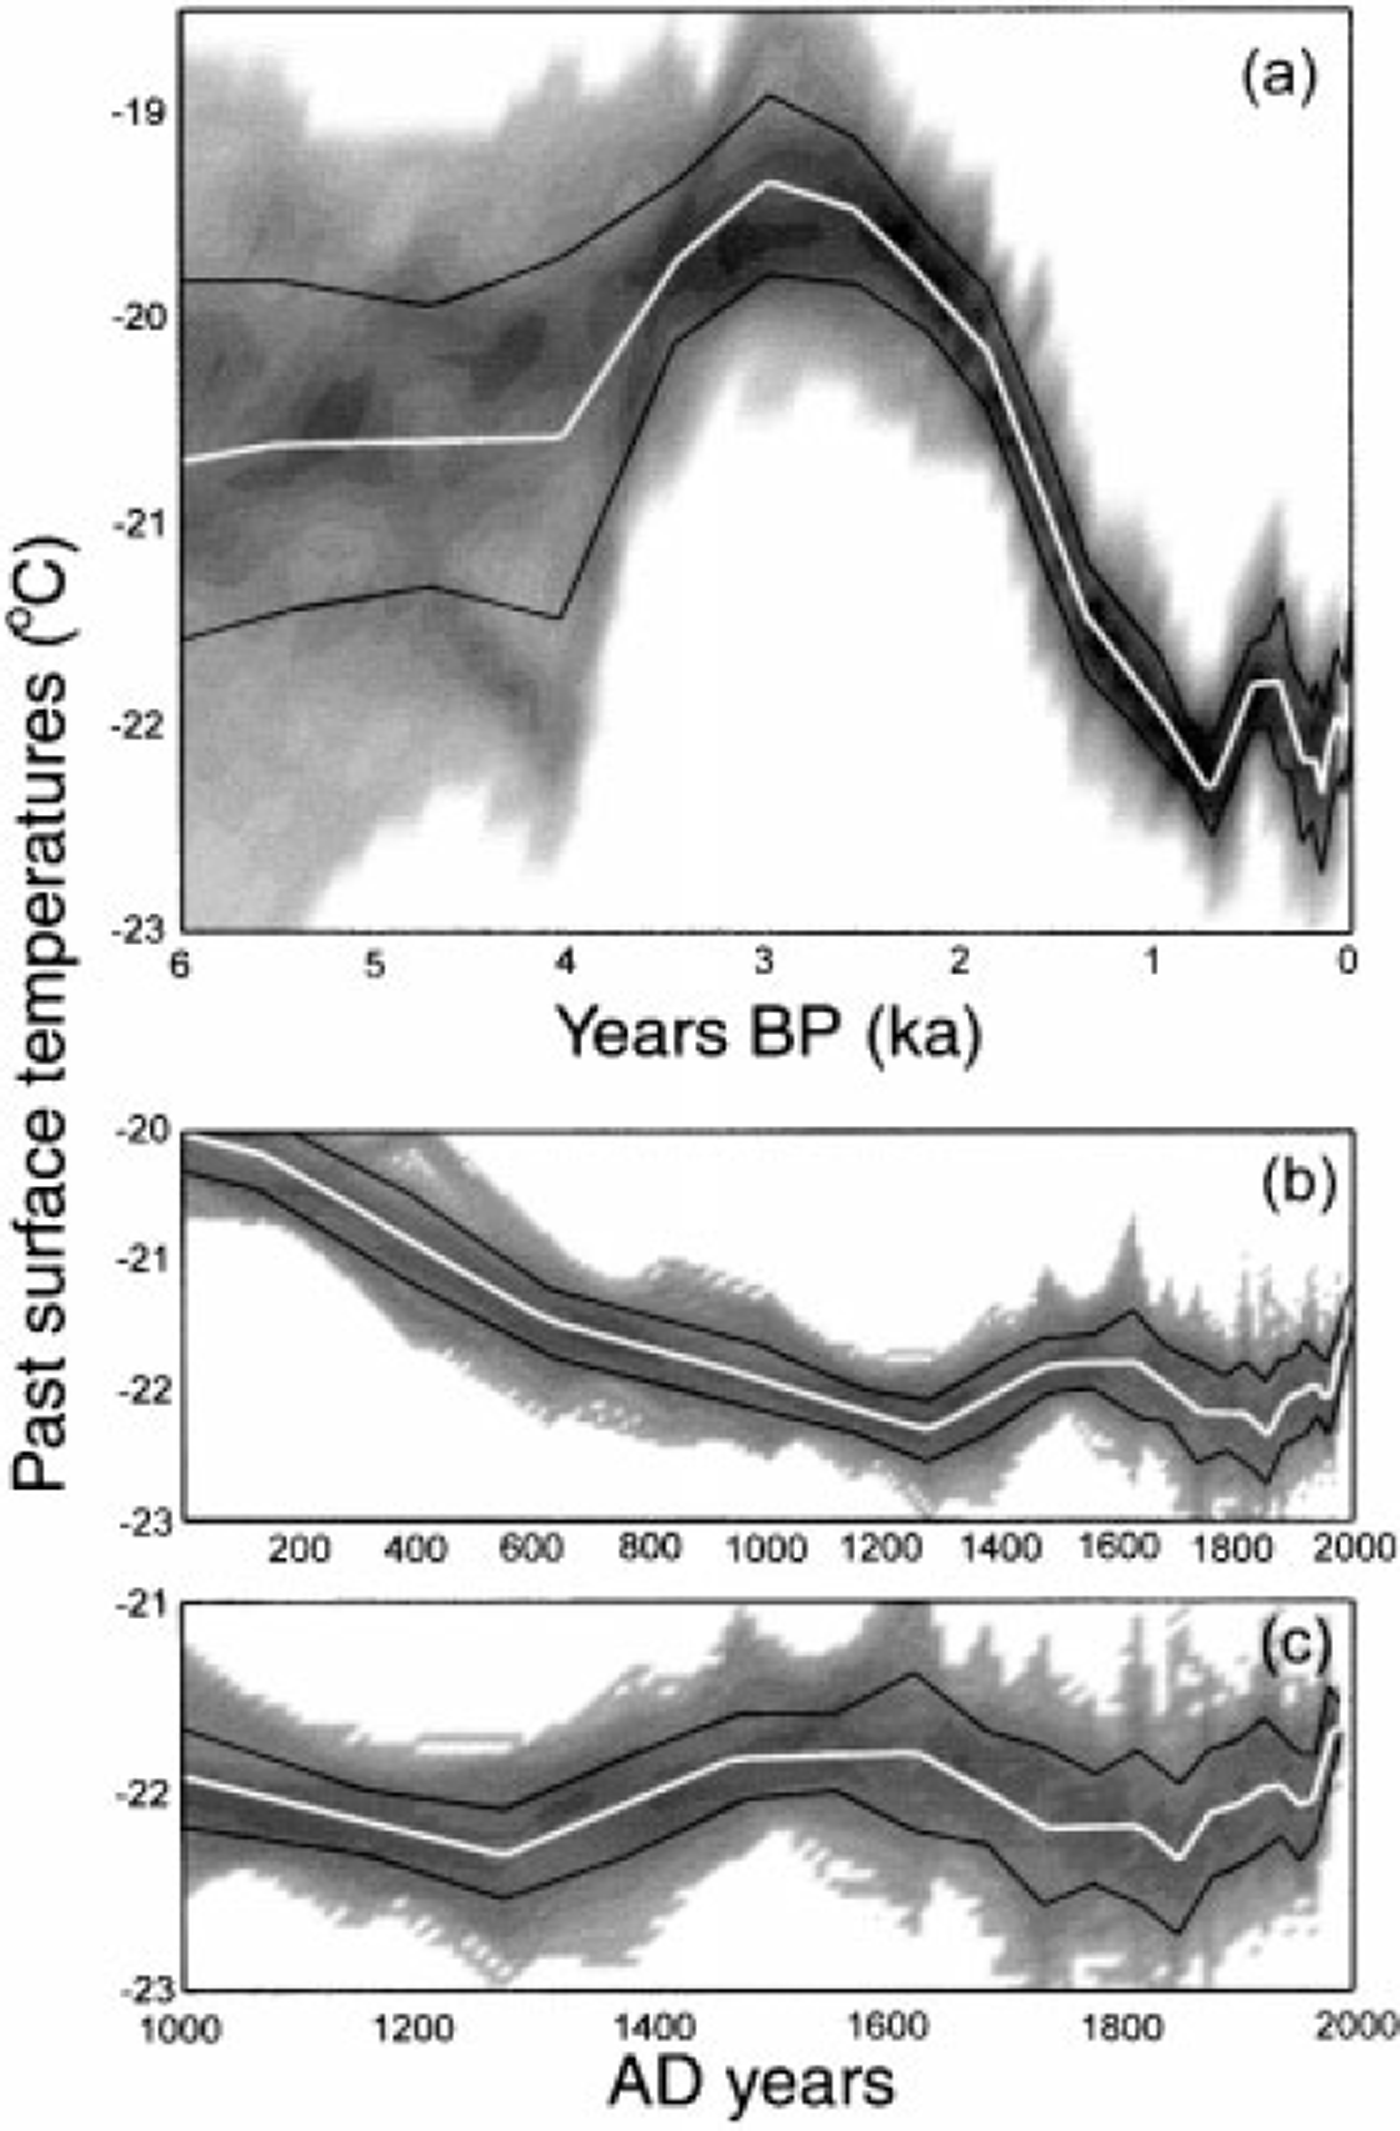
Contour plots of the probability distributions of the past surface temperatures are shown in Figure 3. The most likely past temperature history is shown as white curves that represent the maximum values of the distributions such as those shown in Figure 2. The black curves indicate the standard deviations of the probability distributions; they are a measure for how well the past temperatures can be determined. Figure 3a shows the reconstruction of the past surface temperatures for the last 6 ka. The standard deviation increases from 0.1 K at present to > 1 K at 4 ka BP.
The contour plots of all the DSS temperature histograms as a function of time describe the reconstructed temperature history (white curve) and its uncertainty. The black curves indicate a measure for the standard deviations of the reconstruction. (a) The lastGka. A period 2-4 ka BP has temperatures 2 K warmer than the present, (b) The last 2 ka. A cold period is seen between AD 1300 and 1850. (c) The last 1 ka. The cold period is seen to have minima at AD 1250 and 1790-1850. The temperature has been increasing since AD 1850 and there has been a temperature increase ofOmSKa1 over the last 30year,
A forward analysis with the coupled heat- and ice-flow Equations (2)-(5) gives us information on how Gaussian perturbations of the temperature history can be detected in the borehole-temperature profile. The perturbations of the temperature history during the last 4ka are seen to give well-defined perturbations ("bumps") in the borehole temperatures. The depth of the maximum perturbation in the borehole profile is a function of the location of the perturbation in the time domain. The further back in time the perturbations are placed, the deeper are the maxima found in the borehole. The perturbations in the borehole temperatures are also broadened by diffusion. The deeper and older they are, the more they are diffused out. A perturbation placed further back in time than 4.5 ka no longer has a well-defined maximum in the ice; the maximum has passed down to the underlying rock. The probability distributions of Figure 3a are also seen to broaden for ages older than 4 ka. This reflects the reduced ability to resolve the past temperatures at these ages, so the memory time of the problem is confined to 4 ka.
As described above, the resolution decreases back in time. To maximise computer efficiency without sacrificing resolution, time intervals have been chosen which increase back in time. The time intervals have been selected so that standard deviations of the reconstructed past temperatures are all around 0.3 K for the last 4 ka.
Discussion and Conclusion
The probability distribution of accepted geothermal heat fluxes (Fig. 2e) has a median of 75.1 ± 0.6 mW nT2, a high value for the heat-flow density for the continental crust of Antarctica (Reference Sclater, Jaupart and GabonSclater and others, 1980). The memory of temperatures in the ice is only 4 ka, so there are no remnants of the cold glacial temperatures near the bedrock. The reconstructed value for the heat flux is thus given mainly by the basal temperature gradient and can be considered very reliable.
The reconstructed temperature history for the last 4ka shows a warm period 2-4 ka BP (Fig. 3a). After 2 ka BP, temperatures decrease to a minimum around AD 1300 (Fig. 3b and c). The cold period AD 1300-1850 contains a slight warming around AD 1400-1600, and the coldest period is found at the end (AD 1790-1850). Temperatures have increased since AD 1850, and the mean temperature gradient over the last 30 years is 0.025 K a-1.
Since the reconstructed temperature history is determined from directly observed temperatures in the ice (i.e. remnants of past temperature changes) and not from proxy data such as ^18O, there is no ambiguity associated with calibration of the observed data and the past temperatures (Reference Johnsen, Dahl-Jensen, Dansgaard and GundestrupJohnsen and others, 1995; Reference Cuffey and ClowCuffey and Clow, 1997). The resolution, however, is time-dependent, so temperature events of short duration are detectable if they are very recent, but diffused out if they are older.
The reconstructed temperature history can be compared with other records of past climate over East Antarctica. The most recent history, the last 50 years, can be compared with direct observations (Reference Jones and WigleyJones and Wigley, 1988; Reference JackaJacka, 1990; Reference JonesJones, 1990; Reference Morgan, Goodwin, Etheridge and WookeyMorgan and others, 1991). The observed warming over the last 30 years (Reference JackaJacka, 1990) is seen in the reconstructed temperature history as a 0.75 K rise. This is in agreement with an Antarctic average temperature increase of 0.5 K over these 30 years (Reference JackaJacka, 1990; Reference Peel, Bradley and JonesPeel, 1992; Reference King and TurnerKing and Turner, 1997). The data from Casey station, close to the drill site, support the 0.75 K increase in the Law Dome region (Reference Van Ommen, Morgan, Jacka, Woon and ElcheikhVan Ommen and others, 1999).
For periods reaching back before direct observations are available, the temperature history can be compared with other proxy records of past climate from East Antarctica. The stable-oxygen-isotope record from the Law Dome DSS ice core, i.e. the borehole used in this analysis, is an obvious choice (Reference MorganMorgan, 1985; Reference Morgan, Wookey, Li, van Ommen, Skinner and FitzpatrickMorgan and others, 1997). Figure 4 compares the stable isotopes (5180) measured in the DSS ice core with the reconstructed temperatures. A general agreement is observed over the last lka. The correlation between the isotopes and temperatures for the last 1ka has the gradient ∂(´18O)/∂(Tsur) = 0.6 [‰/K] .This value is in agreement with that found for near-surface studies in the region (Reference Peel, Bradley and JonesPeel, 1992; Reference Van Ommen and MorganVan Ommen and Morgan, 1996; Reference Van Ommen, Morgan, Jacka, Woon and ElcheikhVan Ommen and others, 1999).
The stable oxygen isotope (δ18O) is compared to the reconstructed temperature history, both from the DSS site. There is reasonable agreement for the last lka, but the maximum found in the temperature history at 2-4kaBP is not strongly reflected in the δ18O values, (a) shows the records for the last 4 ka, while (b) enlarges the most recent 2 ka.

Over the last 4 ka an interesting source of information is the presence and abundance of penguins on rookeries along the Victoria Land coast (Reference Baroni and OrombelliBaroni and Orombelli, 1994). For the period 4.3-2.8 ka BP, ten sites with penguin colonies have been found in southern Victoria Land compared to only three at present. This "penguin optimum" is believed to correspond with a warm period in agreement with the reconstructed temperature history from the Law Dome borehole. The period with increased surface temperatures at 2-4ka BP is not seen to the same extent in the stable-oxygen-isotope curve. Two factors that could help to explain the differences are the decrease of ice thickness and the isostatic uplift of the region during and after the deglaciation (Reference GoodwinGoodwin, 1993).
A 50-200 m greater ice thickness during the glacial at the summit of Law Dome (Reference GoodwinGoodwin, 1993) would have left warmer basal temperatures and thus would cause us to reconstruct an erroneously warm period 2-4 ka BP due to our assumption of constant ice thickness. The decrease of ice thickness, however, is assumed to have been finalised 6-8kaBP (Reference GoodwinGoodwin, 1993), so the maximum decrease of the reconstructed temperature history 4 ka back in time is calculated to be 0.5 K. The isostatic uplift of the Law Dome area has been estimated at 0.5-0.6 m (100a) 1 with a total estimated uplift of 53 m (Reference GoodwinGoodwin, 1993). This uplift would affect past surface temperatures, and the reconstructed temperature history would thus overestimate the surface temperatures by 0.2 K at 4kaBP If the geometry of the Law Dome ice cap was different in the past, the shape of the vertical velocity profile at the drill site may have changed. This would change the amount of cold ice advected through the ice cap and thereby the reconstructed temperature history. If the site was closer to the summit, surface temperatures 2 - 4 ka BP are overestimated by up to 1 K. If the site was further from the divide, surface temperatures 2-4kaBP are underestimated by up to 0.5 K.
It is concluded that the reconstructed temperatures could be overestimated by up to 0.7 K for the warm period 2-4kaBP This would lead to a reconstructed temperature profile closer to that inferred by the «5180 of the DSS core (Fig. 4). The isotope values recorded in the ice core are also influenced by ice-thickness changes, isostatic uplift and changing atmospheric circulation patterns. Assuming the ice-thickness change had been finalised by 4kaBP, the surface-elevation changes during the last 4 ka are due to isostatic uplift of the region. This could only account for a 0.1 ‰ elevation correction of the stable oxygen isotope at 4 kaBP
Acknowledgements
Part of this work was carried out while D Dahl-Jensen visited the Antarctic CRC in 1996. D Dahl-Jensen is grateful for the hospitality received as well as for many fruitful discussions.



