INTRODUCTION
Freezing of gait (FoG), described as, a “brief, episodic absence or marked reduction of forward progression of the feet despite the intention to walk” (Nutt et al., Reference Nutt, Bloem, Giladi, Hallett, Horak and Nieuwboer2011, p. 734), is a debilitating feature of Parkinson’s disease (PD) that restricts mobility (Walton et al., Reference Walton, Shine, Hall, O’Callaghan, Mowszowski, Gilat and Lewis2015). Although multifactorial, one hypothesized factor in FoG is altered cognition. The “cognitive control hypothesis” suggests that altered cognitive function may contribute to or precipitate a FoG event (Nieuwboer & Giladi, Reference Nieuwboer and Giladi2013). Indeed, deficits have been observed in motor inhibition and set switching in those with FoG (Bissett et al., Reference Bissett, Logan, van Wouwe, Tolleson, Phibbs, Claassen and Wylie2015; Naismith, Shine, & Lewis, Reference Naismith, Shine and Lewis2010; Smulders, Esselink, Bloem, & Cools, Reference Smulders, Esselink, Bloem and Cools2015; Vandenbossche et al., Reference Vandenbossche, Deroost, Soetens, Spildooren, Vercruysse, Nieuwboer and Kerckhofs2011). Although the tasks used in these studies are varied and tap into multiple cognitive processes, they share an overlapping component whereby the participant is confronted with a stimulus that triggers two competing responses. Resolution of this conflict requires inhibition of one response and facilitation of the other. An impaired ability to appropriately inhibit tasks or switch across tasks could overwhelm the nervous system and result in a neural “traffic jam” that expresses as a freezing episode (Lewis & Barker, Reference Lewis and Barker2009).
Inhibition (or cancelation) of a preplanned response can be assessed with stop-signal test paradigms. In these paradigms, a stimulus cues a motor response, and then in about 25% of the trials, a second stimulus is presented to halt the motor response. Converging evidence suggests that inhibition in stop-signal paradigms is facilitated by a specific network consisting of the right hemisphere’s inferior frontal gyrus (r-IFC), bilateral pre-supplementary motor areas (preSMA), and subthalamic nuclei (STN) (Aron, Robbins, & Poldrack, Reference Aron, Robbins and Poldrack2014; Coxon, Van Impe, Wenderoth, & Swinnen, Reference Coxon, Van Impe, Wenderoth and Swinnen2012; Rae, Hughes, Anderson, & Rowe, Reference Rae, Hughes, Anderson and Rowe2015).
People with PD and FoG exhibit altered supra-spinal neuronal connectivity. Although results are somewhat mixed and need confirmation in larger samples, recent studies have indicated that changes in structural (Fling et al., Reference Fling, Cohen, Mancini, Nutt, Fair and Horak2013) and functional (Bharti et al., Reference Bharti, Suppa, Pietracupa, Upadhyay, Gianni, Leodori and Pantano2019; Fling et al., Reference Fling, Cohen, Mancini, Carpenter, Fair, Nutt and Horak2014) connectivity may be more pronounced in the right hemisphere in people with FoG compared to people without FoG, and may overlap the response inhibition network (Fling et al., Reference Fling, Cohen, Mancini, Nutt, Fair and Horak2013, Reference Fling, Cohen, Mancini, Carpenter, Fair, Nutt and Horak2014; Gilat et al., Reference Gilat, Shine, Walton, O’Callaghan, Hall and Lewis2015). Given the preliminary evidence of deficits in stop-signal-related neural circuitry in people with FoG, as well as the hypothesized relationship between inhibition and FoG, it is plausible that stop-signal ability is related to FoG. However, evidence on this topic is mixed. For example, Bissett and colleagues showed that performance on a stop-signal paradigm was impaired in people with PD who experience FoG compared to people with PD without FoG (Bissett et al., Reference Bissett, Logan, van Wouwe, Tolleson, Phibbs, Claassen and Wylie2015), while Stefanova et al. found no differences across groups (Stefanova et al., Reference Stefanova, Lukic, Markovic, Stojkovic, Tomic and Kostic2014). Together, these conflicting results reflect an incomplete understanding of the links (or lack thereof) between inhibitory control and freezing behavior, as well as the neural circuitry that underlie them.
Therefore, the primary objective of the current study was to characterize the relationship between FoG, inhibition (measured via a stop-signal paradigm), and structural connectivity in the response inhibition network in people with PD with and without FoG. Specifically, in people with PD with and with FoG, we: (1) compared response inhibition performance with a Sop-Signal Task (SST), (2) compared microstructural integrity within the response inhibition network (r-IFC, preSMA, and STN), and (3) correlated stop-signal performance with microstructural integrity in this response inhibition network. We hypothesized that people with FoG would show poorer response inhibition performance, measured by longer Stop-Signal Reaction Times (SSRT), and poorer microstructural integrity within the right hemisphere’s response inhibition network. We also hypothesized that response inhibition performance would be correlated with white matter integrity of the response inhibition network.
METHODS
Participants
Sixty people were recruited (41 people with PD and 19 healthy adults). Convenience sampling was used for participant recruitment. Specifically, participants were contacted by existing participant databases. We also relied on fliers placed in the community and clinician referral. Finally, some participants were recruited via the Parkinson’s Center of Oregon at the Oregon Health & Science University. Of the 41 PD participants, 20 patients self-reported FoG via the New Freezing of Gait Questionnaire (NFoG-Q1 = 1) (Nieuwboer et al., Reference Nieuwboer, Rochester, Herman, Vandenberghe, Emil, Thomaes and Giladi2009), and thus were included in the PD-FoG group, and 21 age- and gender-matched PD patients without report of FoG were included in the PD-noFoG group. One subject without self-reported FoG showed FoG during turning (confirmed by a movement disorders neurologist; J.N.) and was added to the PD-FoG group.
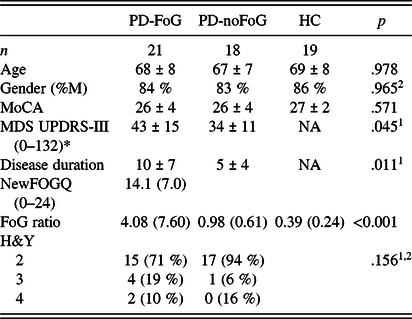
Inclusion criteria were idiopathic PD according to the UK Brain Bank criteria (Hughes, Daniel, Kilford, & Lees, Reference Hughes, Daniel, Kilford and Lees1992) confirmed by movement disorders neurologists, Hoehn and Yahr (H&Y) (Hoehn & Yahr, Reference Hoehn and Yahr1967) stages II–IV, aged 50–90 years, and ability to walk or stand for 2 min without an assistive device. Exclusion criteria were implanted electrodes for deep brain stimulation, dementia (Montreal Cognitive Assessment < 18) (Nasreddine et al., Reference Nasreddine, Phillips, Bedirian, Charbonneau, Whitehead, Collin and Chertkow2005), or contraindications for MRI scans. Finally, participants were excluded if they presented with any peripheral, central nervous system, or musculoskeletal disorders affecting gait or balance other than PD. Severity of parkinsonian signs was assessed by trained raters using the Movement Disorders Society – Unified Parkinson’s Disease Rating Scale Part III (MDS-UPDRS-III) (Goetz et al., Reference Goetz, Tilley, Shaftman, Stebbins, Fahn, Martinez-Martin and Movement Disorder Society2008). Two subjects with PD (both PD-noFoG) had invalid SST results. Specifically, these participants’ probability to stop was above 0.7, the cutoff for validity and interpretability of outcomes such as the SSRT (Verbruggen et al., Reference Verbruggen, Aron, Band, Beste, Bissett, Brockett and Boehler2019). After the removal of these two participants, the final numbers were 21 PD-FoG, 18 PD-noFoG, and 19 healthy subjects (Table 1).
Demographic and clinical characteristics of all participants

MoCA=Montreal Cognitive Assessment; MDS UPDRS-III=Movement Disorders Society – Unified Parkinson’s Disease Rating Scale Part III (motor examination); H&Y=Hoehn & Yahr. For MDS-UPDRS-III, NFoGQ, FoG ratio, and H&Y, larger values reflect worse symptoms or performance; for MoCA, larger values reflect better cognitive performance.
1Comparing PD-noFoG and PD-FoG; 2Chi-square test; *MDS UPDRS-III captured while in the “OFF” medication state.
Data were collected in compliance with the regulations of OHSU and the Helsinki Declaration, and the study was approved by the OHSU Institutional Review Board. Each subject gave informed written consent before participating.
Protocol and Outcomes
All assessments [clinical assessments (MDS-UPDRS-III, MoCA, etc.)], objective assessment of FoG, SSRT, and neuroimaging were conducted in the OFF medication state, after a minimum of 12 hr withdrawal of all PD medications (dopamine replacement and agonists). Assessments occurred in the morning to reduce the OFF medication burden for the PD participants.
Objective Assessment of Freezing of Gait
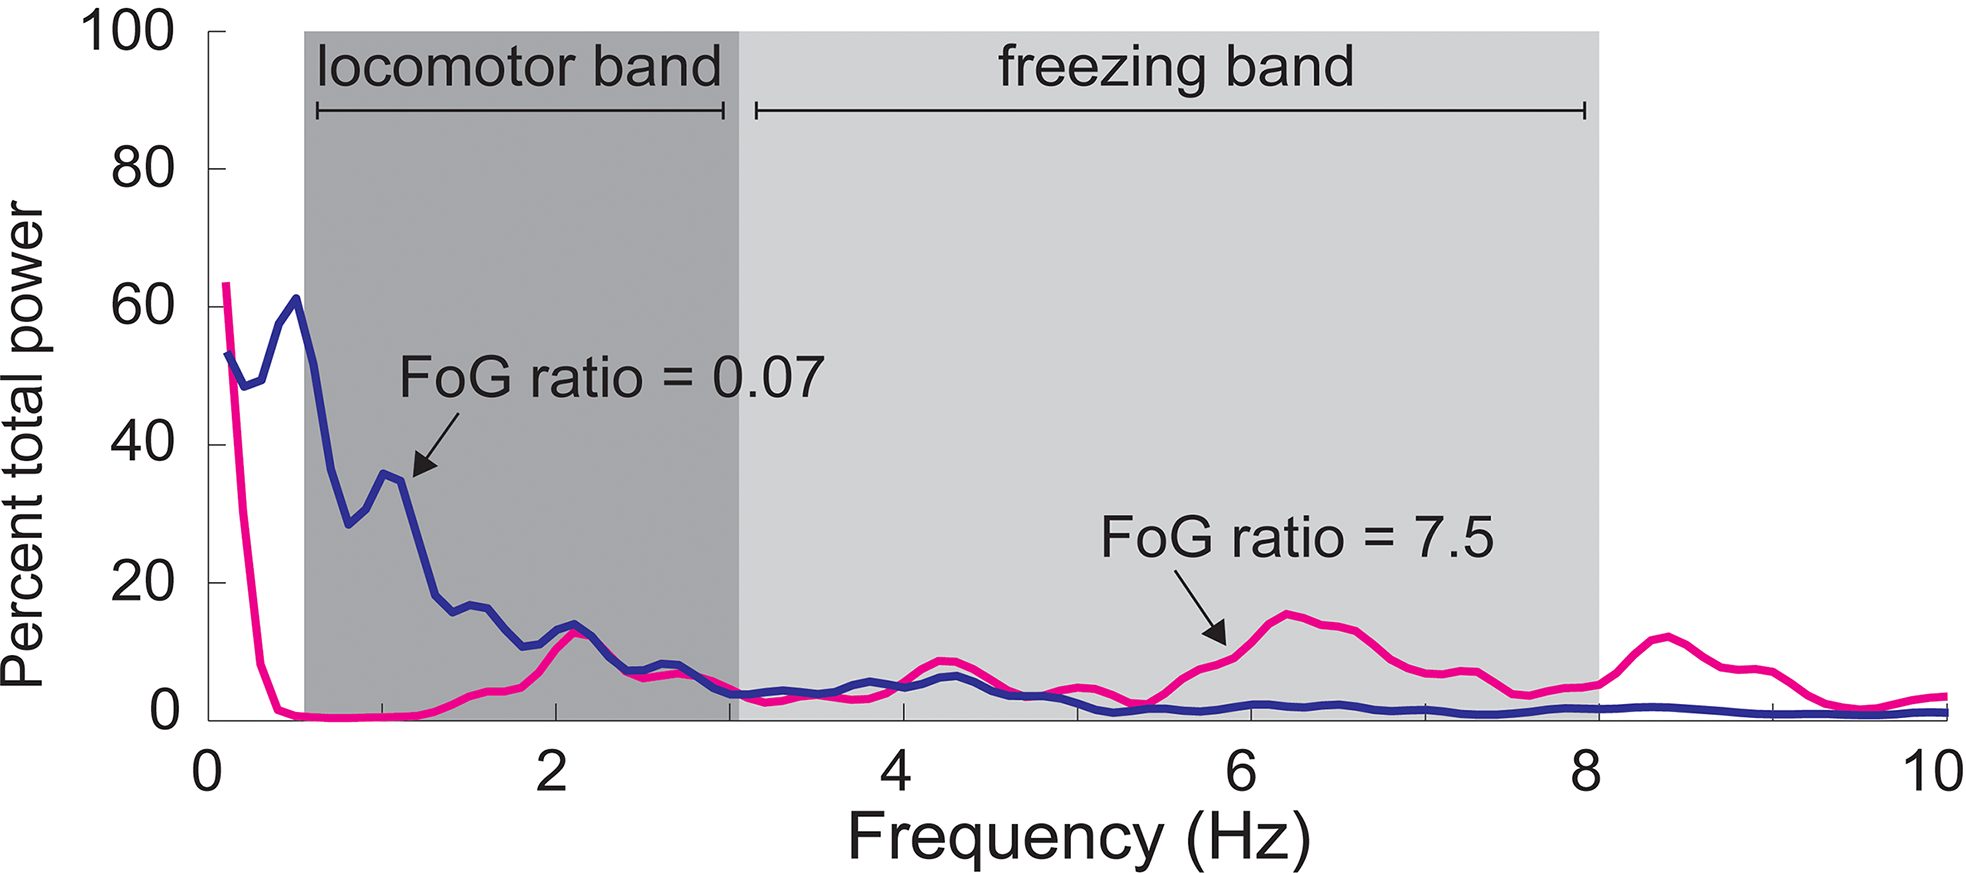
We used objective and continuous measures to assess severity of FoG as described previously (Mancini et al., Reference Mancini, Smulders, Cohen, Horak, Giladi and Nutt2017). Briefly, a FoG ratio was calculated from acceleration of the shins (measured via inertial sensors, Opals by APDM) during a 1-minute turning task in which subjects made alternating 360° turns as fast as safely possible (Figure 1). Power spectral density from anteroposterior acceleration signals was calculated. Then, a FoG ratio was calculated as the ratio of total power in the “freezing band” (3–8 Hz) and the “locomotion band” (0.5–3 Hz). Higher freezing ratios indicate higher severity of FoG. FoG ratio has been shown to correlate well with FoG severity as measured by a video review of turning in place (Mancini et al., Reference Mancini, Smulders, Cohen, Horak, Giladi and Nutt2017).
Calculation of FoG ratio. The FoG ratio is calculated from anterior–posterior accelerations of the shins while turning. The power spectral density of this signal is plotted here. Gait stepping during turning occurs at 0.5–3 Hz (locomotor band), whereas high-frequency movements reflect “trembling of the knees” during freezing episodes (3–8 Hz, freezing band). The FoG ratio is calculated as the ratio between the area under the power density curve in the freezing band divided by the area under the curve of the locomotor band. Two example trials are presented in which no FoG (blue, FoG ratio of 0.07) and multiple FoG episodes occurred (magenta, FoG ratio of 7.5).

Stop-Signal Reaction Time Task
Response inhibition was assessed using the stop-signal paradigm (Verbruggen, Logan, & Stevens, Reference Verbruggen, Logan and Stevens2008). The test consists of 1 practice block (32 trials) and 3 experimental blocks (each 64 trials). Short rest breaks occurred between blocks. Subjects were seated comfortably in front of a 38 × 30 cm monitor, and were instructed to use their left and right hands, respectively, to press the “Z” key (bottom left corner of the keyboard) for a square and the “/” key (bottom right side of the keyboard) for a circle as fast as possible without errors. Wrists were resting comfortably on a table for all trials. The stimulus was presented until the subject had responded, with a maximum reaction time of 1250 ms. Interstimulus intervals were 2000 ms. In 25% of the trials, a stop signal was presented as an auditory tone. Subjects had to stop their response in these trials. The interval between the stimulus and the stop signal depended on the success of the previous stop trial using a staircase tracking procedure. Successful stop trials led to a 50 ms increase in stimulus-stop delay (SSD), whereas unsuccessful stop trials led to 50 ms shorter SSD, resulting in an overall probability of successful stopping around 50%. Initial SSD was set at 250 ms. Participants were reminded not to wait for a stop signal to occur between each block, and were provided feedback after each block regarding the percentage of stop trials actually stopped. These measures are in-line with recent guidelines regarding SST administration (Verbruggen et al., Reference Verbruggen, Aron, Band, Beste, Bissett, Brockett and Boehler2019).
The SSRT was calculated using the integration method (Verbruggen, Chambers, & Logan, Reference Verbruggen, Chambers and Logan2013). First, all reaction times of nonstop trials were rank-ordered. The probability of successfully inhibiting a response whenever a stop signal was present, p(stop|signal), was calculated for every subject. The p(stop|signal) was then used to select the corresponding RT (i.e., if p(stop|signal) = 45%, stop RT is RT at 45th percentile). SSRT was calculated as stop RT – mean SSD. Two PD-FoG subjects were excluded because of p(stop|signal) > 0.7, indicating invalid tests (Verbruggen et al., Reference Verbruggen, Aron, Band, Beste, Bissett, Brockett and Boehler2019). Accuracy (correct left–right responses) was also calculated.
Image Acquisition
Neuroimaging scans occurred in a 3.0T Siemens Magnetom Tim Trio scanner with a 12-channel head coil at Oregon Health & Science University’s Advanced Imaging Research Center. We acquired one high-resolution T1-weighted MP-RAGE sequence (orientation = Sagittal, echo time = 3.58ms, repetition time = 2300ms, 256 × 256 matrix, resolution 1.0 × 1.0 × 1.1 mm.; scan time = 9 min 14 s). High-angular-resolution diffusion images (HARDI) were also collected using a 72-gradient direction, whole-brain echo-planar imaging sequence (TR = 7100 ms, TE = 112 ms, field of view = 230 × 230 mm2, b value = 3000 s/mm2, isotropic voxel dimensions = 2.5 mm3) and 10 images in which the b value was equal to zero. A static magnetic field map was also acquired using the same parameters as the diffusion-weighted sequence.
Diffusion Tensor Imaging Analysis
Diffusion data were processed using the tools implemented in FSL (Version 5.0; www.fmrib.ox.ac.uk/fsl). Briefly, diffusion data were corrected for eddy current distortions and motion artifacts, averaged to improve signal-to-noise ratio, and skull-stripped (Eickhoff et al., Reference Eickhoff, Jbabdi, Caspers, Laird, Fox, Zilles and Behrens2010). For each individual, the fractional anisotropy (FA) images were normalized into Montreal Neurological Institute (MNI) space by using a linear (affine) registration and Fourier interpolation through the FMRIB linear image registration tool. A probabilistic diffusion model that accommodates crossing fibers was applied to calculate fiber tract probability distributions at each voxel to identify tract quality (Behrens, Berg, Jbabdi, Rushworth, & Woolrich, Reference Behrens, Berg, Jbabdi, Rushworth and Woolrich2007; Behrens et al., Reference Behrens, Woolrich, Jenkinson, Johansen-Berg, Nunes, Clare and Smith2003). Probabilistic tractography was run from cortical seed masks, constrained by a target and termination mask, to delineate the following tracts: (1) r-IFC to r-preSMA; (2) r-IFC to r-STN; (3) r-preSMA to r-STN; (4) l-preSMA to l-STN; (5) l-IFC to l-preSMA; and (6) l-IFC to l-STN. Seed masks for probabilistic tractography were determined in MNI space using procedures previously outlined (Coxon et al., Reference Coxon, Van Impe, Wenderoth and Swinnen2012) and transformed to subject diffusion space using the inverse of the FA registrations.
FA Region of Interest Analysis
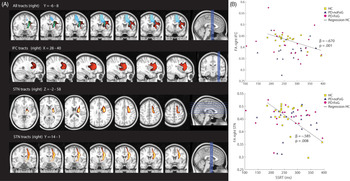
Due to the strong body of literature identifying r-IFC, preSMA, and STN as critical nodes in a neural network for response inhibition (Aron et al., Reference Aron, Robbins and Poldrack2014; Coxon et al., Reference Coxon, Van Impe, Wenderoth and Swinnen2012; Rae et al., Reference Rae, Hughes, Anderson and Rowe2015), we utilized an a priori ROI-based approach. Resultant fiber tracts were thresholded, transformed into MNI space, binarized, and summed across participants (Aron, Behrens, Smith, Frank, & Poldrack, Reference Aron, Behrens, Smith, Frank and Poldrack2007). Voxels that were present in >95% the of participants’ maps were retained (Figure 2A). For ease of interpretation, the ROIs are labeled according to the common seed/target node (e.g., the r-IFC ROI was determined by the multiplication of the tract between r-IFC and r-preSMA and the tract between r-IFC and r-STN). Thus, the value for each ROI can be thought to reflect the integrity of white matter projections to/from the other neural nodes (e.g., r-IFG contains voxels projecting to/from both r-preSMA and r-STN). The resulting MNI space tract ROIs were subsequently used to extract the mean from each subjects’ FA image. FA is a rotationally invariant index that ranges from 0 (isotropic) to 1 (anisotropic), higher FA values indicating higher white matter integrity.
(A). Identified white matter tracts within the response inhibition network. In the upper panel, all tracts are shown between the right hemisphere’s inferior frontal cortex (IFC, in red), pre-supplementary motor area (preSMA, in blue), and subthalamic nucleus (STN, in green). All tracts are thresholded to include fibers where at least 95% of the participants had identifiable tracts. In the lower panels, the IFC and STN tracts are shown separately. (B). Correlations between behavioral response inhibition performance and microstructural integrity in the response inhibition network. Higher mean fractional anisotropy (FA) of the identified right IFC (top) and STN (bottom) tracts correlated with higher Stop-Signal Reaction Times (SSRT) in neurotypical, healthy controls (HC; see regression line), but not in subjects with Parkinson’s disease (PD) with or without FoG. Presented ß values for the relationship between FA and SSRT in panel B represent correlations between these variables while controlling for age and gender.

Statistical Analysis
Demographic, clinical, and response inhibition differences among groups were tested with ANOVAs (comparing all groups), independent t-tests (PD-FoG vs. PD-noFoG), or chi-square for categorical variables.
FA data and some behavioral (i.e., SSRT) data were non-normally distributed. Therefore, nonparametric tests were used to assess across-group differences in FA and behavioral data. Specifically, Kruskal–Wallis tests assess overall group effects, and Mann–Whitney U tests assessed pre-planned, across-group comparisons (HC vs. PD-noFoG, HC vs. PD-FoG, and PD-noFoG vs. PD-FoG). Hodges–Lehmann CI estimates were calculated for these assessments.
Regression models were run in PD-FoG to analyze the association between ROI FA values and FoG ratio, adding age, gender, and disease duration as covariates. FoG ratio was positively skewed across all PD subjects with a median of 1.22 (range from 0.23 to 34.48). Hence, logarithmic transformation (ln) of the FoG ratio was used to equalize variances for this analysis.
The relationship between FA of each ROI and the SST behavior was analyzed using regression models with dependent variable SSRT and ROI FA was the independent variable. Age and gender were included as covariates. Planned within-group (HC, PD-noFoG, and PD-FoG) models were also run. Despite non-normal distributions of some FA outcomes, residuals of the regression models were not skewed (Shapiro–Wilk test outcomes p > .205 for all models). Nonetheless, to identify potential outlier bias, in all instances where significance between the FA ROI and SSRT was observed, Cook’s distance values were calculated. Model outcomes with high-leverage data points excluded are presented.
RESULTS
Results describing SSRT performance across groups, structural integrity across groups, and the relationship between SSRT and structural integrity are presented in turn.
SSRT Performance
Means and statistical outcomes of SST performance are shown in Table 2. Across all subjects, the average RT of Go trials (692 ± 172 ms) and was longer than the average RT of the failed stop trials (627 ± 155 ms; t 1,57 = 10.97, p < .001). Accuracy rates were high and not significantly different among groups (F 2,55 = 1.49, p = .235). Average SSRT of the whole sample was 268 ± 61.6 ms. Mean SSRT also did not differ between groups (main group effect: F 2,55 = 0.38, p = .686).
Stop-Signal Task (SST) output means and statistical comparisons across the three groups: PD who freeze (PD-FoG), PD who do not freeze (PD-noFoG), and healthy controls (HC). SST outcomes (and in particular, SSRT) were largely similar across all groups. Nonparametric Kruskal–Wallis, Mann–Whitney U, and Hodges–Lehmann assessments were used due to the non-normal distribution of data

SSRT=Stop Signal Reaction Time; Go RT=Reaction time for “go” trials; SSD=Stop Signal Delay; p(stop|signal)=probability of stopping a trial with a stop signal.
aKruskal–Wallis Test; bMann–Whitney U Test; cHodges–Lehmann CI estimate.
Microstructural Integrity of the Stopping Network
Across and within-group analyses of all FA values can be found in Table 3. Models showed statistically significant differences across groups for r-IFC (p = .005), l-IFC (p = .003), l-preSMA (p = .001), and l-STN (p = .004), and trends toward significance in r-preSMA (p = .057) and r-STN (p = .064). Within-group analyses showed that: (1) HC exhibited larger (better) FA compared to PD-noFoG across all ROIs (0.001 < p < .042), (2) HC – PD-FoG differences were less robust, and more commonly observed in the left hemisphere ROIs (0.001 < p < .033) than the right hemisphere ROIs (0.036 < p < .72), and (3) no significant differences were observed between PD-FoG and PD-noFoG in FA in any ROIs (0.096 < p < .955).
Across-group comparisons of microstructural integrity in a priori regions of interest

aKruskal–Wallis Test; bMann–Whitney U Test; cHodges–Lehmann CI estimate.
Microstructural Integrity of the Response Inhibition Network and Behavioral Response Inhibition
Regression analysis outputs for models relating SSRT to FA of each ROI in all groups can be found in the Supplemental Table. Analyzing all subjects together, relationships between SSRT and STN, SMA, and IFG were modest in the right (0.081 < p < .167) and left (0.035 < p < .252) hemispheres. No significant associations between the left or right nodes and SSRT were observed in either PD group.
However, planned, within-group assessments showed that in HC, higher (i.e., better) FA values of the right hemisphere were related to faster SSRTs (r-IFC: B = −1301 (SE 332), p = .001; r-STN: B = −495 (SE 162), p = .008; Figure 2B). None of the left hemispheres nodes associated significantly with SSRT in healthy subjects. For the HC models, one participant was noted to contribute a data point that exhibited a notably large Cook’s distance value (>4/(n − k − 1) (Hair, Anderson, Tatham, & Black, Reference Hair, Anderson, Tatham, Black and Englewood Cliffs1998)) for r-IFC, r-SMA, and r-STN (0.44, 0.34, and 0.37, respectively). Removal of this data point reduced the significance of each of the FA–SSRT relationships (r-STN: p = .044, r-SMA: p = .079; r-IFC: p = .064). For the l-SMA total group model, one participant had a large Cook’s value (0.12). Removal of this participant slightly increased the significance of the model (p = .023 after removal; see Supplemental Table for details).
Severity of FoG and Integrity of the Response Inhibition Network
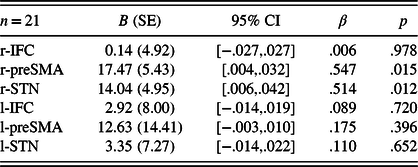
The FoG ratio correlated with NFoG-Q total score (r = .641, p = .002) and was significantly larger in PD-FoG than PD-noFoG (p = .028) or neurotypical adults (<.001). FA values of the r-preSMA and r-STN were significantly associated with the FoG ratio (p = .015 and .012, respectively; Table 4), indicating that larger tract integrity is associated with higher (i.e., worse) FoG ratio (B = 17.47 (5.43), p = .015). Neither the r-IFC nor any of the left hemisphere nodes were associated with the FoG ratio.
Regression models to associate FoG severity (ln FoG ratio) with FA values of the ROIs in PD with FoG

DISCUSSION
Our results did not support the hypothesis that FoG is associated with response inhibition deficits or that microstructural integrity of the right hemisphere’s IFC-preSMA-STN circuitry is disproportionately altered in PD-FoG. First, in contrast to our expectation, PD subjects with FoG did not have poorer SST performance or poorer structural integrity within the predefined response inhibition network compared to those without FoG. Second, the integrity of white matter tracts within the right IFC-preSMA-STN network was higher in subjects with more severe FoG. Third, we observed the expected positive relationship between stopping network structural integrity and stopping behavior, but only in neurotypical older adults.
Behavioral Differences between PD with and without FoG
Our results suggest that neither PD (generally) or the presence of FoG within the PD group resulted in poorer efficiency in response inhibition, measured as SST performance. Previous work has yielded inconsistent results regarding the effect of PD or FoG on stopping performance. For example, some studies have reported longer (worse) SSRT in PD compared to healthy subjects (Di Caprio, Modugno, Mancini, Olivola, & Mirabella, Reference Di Caprio, Modugno, Mancini, Olivola and Mirabella2020; Gauggel, Rieger, & Feghoff, Reference Gauggel, Rieger and Feghoff2004; Manza et al., Reference Manza, Schwartz, Masson, Kann, Volkow, Li and Leung2018; Obeso et al., Reference Obeso, Wilkinson, Casabona, Bringas, Alvarez, Alvarez and Jahanshahi2011, Reference Obeso, Wilkinson, Casabona, Speekenbrink, Luisa Bringas, Alvarez and Jahanshahi2014; Wylie et al., Reference Wylie, van Wouwe, Godfrey, Bissett, Logan, Kanoff and van den Wildenberg2018), and others reported no differences, consistent with our findings (Bissett et al., Reference Bissett, Logan, van Wouwe, Tolleson, Phibbs, Claassen and Wylie2015; Claassen et al., Reference Claassen, van den Wildenberg, Harrison, van Wouwe, Kanoff, Neimat and Wylie2015; Kohl et al., Reference Kohl, Aggeli, Obeso, Speekenbrink, Limousin, Kuhn and Jahanshahi2015; Vriend et al., Reference Vriend, Gerrits, Berendse, Veltman, van den Heuvel and van der Werf2015). Two previous reports investigated the impact of freezing status on SSRT performance. First, and consistent with the current report, Stefanova et al. measured SSRT performance in people with (n = 30) and without FoG (n = 36), showing no differences across groups (Stefanova et al., Reference Stefanova, Lukic, Markovic, Stojkovic, Tomic and Kostic2014). However, Bisset et al. measured SSRT in neurotypical adults (n = 21), people with (n = 20), and without FoG (n = 22). They noted that while people with PD, on the whole, did not have worse SSRT times compared to neurotypical adults, a pre-planned comparison between people with and without FoG exhibited a subtle, but significant, worsening in SSRT in those with FoG.
The reason for the discrepancy in results when comparing FoG and non-FoG groups is unclear, but could be related to at least three differences between our and Bisset et al.’s paradigms. First, the mode of stop-signal presentation was different across studies, as Bisset and colleagues provided a visual (color change) stop signal, while the protocol in our study and that of Stefanova et al. was auditory. Although speculative, differences in the salience of the stimulus, or specific processing impairments of visual, but not auditory, stimuli in subjects with PD with FoG may have contributed to the discrepancy in results (Davidsdottir, Cronin-Golomb, & Lee, Reference Davidsdottir, Cronin-Golomb and Lee2005; Fearon, Butler, Newman, Lynch, & Reilly, Reference Fearon, Butler, Newman, Lynch and Reilly2015). Second, unlike Bisset et al., participants in our study completed the SST while in the “Off” levodopa state. Although the effect of dopamine on SSRT times has been mixed (Claassen et al., Reference Claassen, van den Wildenberg, Harrison, van Wouwe, Kanoff, Neimat and Wylie2015; Manza et al., Reference Manza, Schwartz, Masson, Kann, Volkow, Li and Leung2018; Obeso et al., Reference Obeso, Wilkinson, Casabona, Bringas, Alvarez, Alvarez and Jahanshahi2011; Wylie et al., Reference Wylie, van Wouwe, Godfrey, Bissett, Logan, Kanoff and van den Wildenberg2018), it is possible that dopamine replacement therapy impairs SSRT performance. Finally, Bisset and colleagues also measured (and included in their analysis) SSRT times with the feet as an effector (in addition to the hands). While there was no effector by group interactions observed, the inclusion of these data may have contributed to the significance observed in that study. In sum, while additional work will be necessary to provide consensus, the existing literature suggests FoG status likely has a relatively modest effect on SSRT performance. Further, these studies underscore the diversity in SST methodological paradigms. For subsequent studies, the adoption of reliable and standardized methodologies (e.g., Verbruggen et al., Reference Verbruggen, Aron, Band, Beste, Bissett, Brockett and Boehler2019) should be applied to increase the generalizability of findings.
We selected the stop-signal paradigm as a measure of inhibition because of (1) the strong evidence of the neural circuitry involved, (2) early work indicating potential deficits in these regions in PD-FoG, and (3) potential behavioral deficits in this group. However, we recognize that using upper limb responses rather than stepping responses limits validity for the task for FoG. Interestingly, two recent studies investigated response inhibition tasks during stepping, also showing mixed results. Beaulne-Seguin et al. did not find clear inhibition deficits in freezers compared to non-freezers when instructed to execute or stop a prepared stepping response to a visual cue (Beaulne-Seguin & Nantel, Reference Beaulne-Seguin and Nantel2016). Alternatively, Georgiades and colleagues asked PD participants with and without FoG to perform a virtual reality stepping task with an embedded inhibition component (Georgiades et al., Reference Georgiades, Gilat, Ehgoetz Martens, Walton, Bissett, Shine and Lewis2016). Participants laid supine and tapped their feet while they were shown a first-person view moving through corridors. While tapping their feet, participants were given a visual signal to stop stepping. The authors found that people with PD and FoG took more steps after the stop signal than people without FoG, thus exhibiting more difficulty “stopping” the stepping task. There are important differences between stopping an ongoing task (stepping) versus a released reaction time task (as in the SSRT), which may have also contributed to the partially conflicting findings between Georgiades et al. and the current report. However, together, these efforts represent an important step in developing effector-specific and FoG-specific paradigms to further understanding of inhibitory processes relevant to FoG.
We also acknowledge “inhibition” is in itself a broad domain, which is not entirely described by the SST. Further, FoG events may be related to one’s (in)ability to both inhibit a response and “switch” to another task. Switching ability, often measured by tasks such as Trails B-A, has been shown to be related to freezing in some (Factor et al., Reference Factor, Scullin, Sollinger, Land, Wood-Siverio, Zanders and Goldstein2014; Naismith et al., Reference Naismith, Shine and Lewis2010; Shine et al., Reference Shine, Naismith, Palavra, Lewis, Moore, Dilda and Morris2013), albeit not all (Morris et al., Reference Morris, Smulders, Peterson, Mancini, Carlson-Kuhta, Nutt and Horak2020), previous work. Therefore, it is possible that the null findings in the current study were due to a somewhat myopic view of “inhibition”, measured specifically by SST, which incompletely assesses other relevant FoG-related domains such as switching. Some research has identified neural regions associated with switching, showing partial overlap to the “stopping” network – e.g., (Sylvester et al., Reference Sylvester, Wager, Lacey, Hernandez, Nichols, Smith and Jonides2003). However, there is currently limited information relating to switching ability (e.g., Trails performance), neural regions specifically associated with switching, and FoG severity across PD-FoG and PD-noFoG groups. This information could provide additional insights into factors that contribute to FoG.
White Matter Integrity in PD with and without FoG
We restricted our current analysis to the supposed response inhibition network ROIs, only considering the overlapping tracts among the ROIs, thus providing a measure of the connection strength between each node within this network (Coxon et al., Reference Coxon, Van Impe, Wenderoth and Swinnen2012). Within this a priori selected network, we observed subjects with PD to have poorer microstructural integrity in the IFC-preSMA-STN circuitry than healthy subjects, with particular deficits in the left hemisphere. This result is consistent with previous work showing widespread cortical and subcortical white matter dysfunction in PD (Bohnen & Albin, Reference Bohnen and Albin2011; Isaacs et al., Reference Isaacs, Trutti, Pelzer, Tittgemeyer, Temel, Forstmann and Keuken2019; Uribe et al., Reference Uribe, Segura, Baggio, Abos, Garcia-Diaz, Campabadal and Junque2018).
In contrast to our expectations, we observed no statistical differences when comparing white matter tract integrity (FA) between the IFC, preSMA, and STN in those with PD who do and do not experience FoG. Previous literature suggests that when using whole-brain analyses, people with FoG often exhibit reduced quality and structural integrity of white matter tracts compared to people without FoG, with particular changes to long associative white matter bundles and in white matter emanating from brainstem regions (e.g., pedunculopontine nucleus) (Fling et al., Reference Fling, Cohen, Mancini, Nutt, Fair and Horak2013; Vercruysse et al., Reference Vercruysse, Leunissen, Vervoort, Vandenberghe, Swinnen and Nieuwboer2015). However, to our knowledge, no previous investigations focused specifically on the response inhibition network, and few, if any, whole-brain analyses identified deficits in connectivity in these specific nodes. Therefore, making comparisons to previous research is difficult. In addition, the lack of significant differences in the two PD groups specifically in the response inhibition nodes may be expected given the lack of difference in response inhibition between our cohorts.
White Matter Integrity, SSRT Performance, and FoG Severity
As noted above, although people with PD (with or without FoG) exhibited altered microstructural integrity compared to HC, no differences were observed between people with PD who do and do not freeze. Given the demonstrated link between the stopping network and SSRT performance, it is therefore not entirely surprising that freezing status did not impact SSRT performance. However, previous results (Coxon et al., Reference Coxon, Van Impe, Wenderoth and Swinnen2012) would suggest that within each group, SSRT behavior would be correlated to stopping network integrity. Indeed, consistent with previous results (Coxon et al., Reference Coxon, Van Impe, Wenderoth and Swinnen2012), we did observe a correlation between SSRT outcomes structural integrity in healthy older adults in the r-IFC, r-preSMA, and l-preSMA.
However, this relationship did not persist in either PD cohort. This lack of correlation was not due to reduced variability in SSRT or structural integrity outcomes. Several possible, albeit speculative, reasons are presented. First, low correlations between the right hemisphere’s IFC-preSMA-STN circuitry and behavioral response inhibition in people with PD might be explained by the fact that most of the SSRTs variance in the SST can be explained by the actual stopping phase of the inhibition process, occurring just milliseconds before the SSRT (Boucher, Palmeri, Logan, & Schall, Reference Boucher, Palmeri, Logan and Schall2007; Wessel & Aron, Reference Wessel and Aron2015). Hence, processing in the r-IFC-preSMA-STN might be more related to preparatory processes such as detecting and processing the stop signal and triggering the stop response, which are essential steps for response inhibition, but has a less direct correlation with SSRT variance. Second, given the pathological state of PD patients, it is possible that other variables, not measured in the current study, such as noradrenaline or dopamine levels (Eagle, Bari, & Robbins, Reference Eagle, Bari and Robbins2008), maybe more powerful drivers of the variability in SSRT variance than structural integrity. Finally, parkinsonian pathology causes widespread neural changes and likely results in other pathways contributing to and compensating for behavioral functions, such as response inhibition (Snijders et al., Reference Snijders, Takakusaki, Debu, Lozano, Krishna, Fasano and Hallett2016). Therefore, it is possible that people with PD rely less or differently on the stopping network than healthy adults for inhibition tasks. Indeed, we observed that, in people with PD and FoG, freezing severity was positively correlated to stopping-network structural integrity. Although this relationship was reduced after correcting for disease severity, these findings suggest that the relationship between stopping network integrity and behavior may be altered in this population. Larger (better) than normal FA has previously been shown to reflect pathological changes related to abnormal behavior in neurological populations (Hoeft et al., Reference Hoeft, Barnea-Goraly, Haas, Golarai, Ng, Mills and Reiss2007), further supporting this speculation. Additional work in larger samples will be necessary to determine whether the stopping network plays a similar role in inhibition tasks (such as SSRT task) in people with PD as it does in neurotypical adults.
Limitations
Our results should be interpreted in the context of the following limitations. First, we focused on mean FA values of a predefined network, and we recognize that our chosen structural integrity measure (FA) does not necessarily reflect poorer physiological connectivity between brain areas. Second, although our sample size was larger than some previous neuroimaging studies in PD with FoG (Fling et al., Reference Fling, Cohen, Mancini, Nutt, Fair and Horak2013; Vercruysse et al., Reference Vercruysse, Leunissen, Vervoort, Vandenberghe, Swinnen and Nieuwboer2015), the heterogeneity commonly found in subjects with FoG calls for even larger sample sizes. Third, the stop-signal paradigm that we administered carried a small working memory component (“square is left, circle is right”) that might have been disadvantageous for PD subjects. Although accuracy was high in all groups, a paradigm with direct cues (arrows) may be preferable over indirect stimuli that we used. Fourth, as noted in the results section, one outlier contributed to the observed FA–SSRT relationship in HC. Although residuals of these analyses were normally distributed, these findings should be considered with caution. Fifth, given that PD-FoG often exhibits more severe motor symptoms, it is plausible that the SSRT comparison across PD-noFoG/PD-FoG participants may have been impacted by motor severity. However, we included disease severity (measured as MDS-UPDRS III) into the SSRT analysis. Second, the “go” reaction time outcomes were not different across the FoG and non-FoG groups, further indicating that motor symptoms were unlikely to have impacted the interpretation of SSRT data in the current study. Finally, tract quantity (i.e., the volume of white matter tracts) were unable to be evaluated in this study as it was previously (Fling et al., Reference Fling, Cohen, Mancini, Nutt, Fair and Horak2013). Rather, we focused on tract quality reflecting fiber density, axonal diameter, and myelination in white matter (i.e., FA).
CONCLUSION
In summary, our results are consistent with the literature that microstructural brain changes exist in the response inhibition network in people with PD compared to neurotypical adults and that integrity of the response inhibition network relates to response inhibition in elderly people without PD. However, freezing status in people with PD did not impact the efficiency of response inhibition (measured via the SST), nor white matter changes in the response inhibition brain network (r-IFC, preSMA, and STN). Although preliminary, our findings do not support a cognitive inhibition deficit in people with PD and FoG.
ACKNOWLEDGMENTS
The project was supported by grants from the Medical Research Foundation of Oregon (Early Clinical Investigator award; PI: KS), the US Department of Veteran’s Affairs Rehabilitation Research and Development Service (Career Development Award-1: #I01BX007080; PI: DSP) and VA Merit Award (I01 RX001075-01; PI: FBH), the National Institutes of Health (R01 AG006457 29 PI: FH), an NIH Career Development Award K99 HD078492 0IAI (PI: MM), and NIH/NCATS (KL2TR000152; PI: BWF). The authors thank all participants for their effort, and Natassja Pal, Graham Harker, and Michael Fleming for assisting in participant recruitment, screening, and data collection.
CONFLICTS OF INTEREST
OHSU and Dr Horak have a significant financial interest in APDM, a company that may have a commercial interest in the results of this research and technology. This potential institutional and individual conflict has been reviewed and managed by OHSU.
Supplementary Material
To view supplementary material for this article, please visit https://doi.org/10.1017/S135561772000123X.