Introduction
Intensity-modulated radiotherapy (IMRT) is a radiotherapy technique that has the ability to create high-dose gradients for increasing target coverage and sparing of critical organs.Reference Tejpal, Jaiprakash, Susovan, Ghosh-Laskar, Murthy and Budrukkar1 IMRT has become a standard technique in nasopharyngeal carcinoma (NPC) which is a combination of complex target shapes surrounded by critical organs.Reference Haberer-Guillerm, Touboul and Huguet2 Therefore, the clinical implementation of IMRT requires the precision of delivery by using image-guided radiation therapy (IGRT).Reference Sterzing, Engenhart-Cabillic, Flentje and Debus3
Helical tomotherapy (HT) is the radiotherapy that uses the concept of IMRT delivery with IGRT for daily patient setup verification. The process starts from acquiring daily megavoltage computed tomographic (MVCT) images for rigid registration with kilovoltage computed tomographic (kVCT) images that are used for the radiotherapy planning process and then correcting the patient’s position by translation and rotation adjustment.
The radiotherapy treatment course takes approximately 6 to 7 weeks. NPC patients may have anatomical variations including the shrinkage of tumours and metastatic lymph nodes, weight loss or soft tissue deformation.Reference Barker, Garden and Ang4–Reference Huang, Lu and Feng6 These variations may affect the actual accumulated dose being different from the planned dose which IGRT does not account.Reference Huang, Lu and Feng6–Reference Qi, Santhanam and Neylon9 The actual accumulated dose came from the planning dose on the update structure from daily computed tomographic images. The deformable image registration (DIR) process can create the automatic localisation and determine the accumulated doses by locally registering the anatomically changed image data sets into a reference image data set and identify the spatial correspondence to create a mapping or a deformation vector field (DVF) of the minimised differences of both image data sets.Reference Sotiras, Davatzikos and Paragios10,Reference Oh and Kim11
MIM software is a program for providing practical imaging solutions in the medical imaging, which include the automatic localisation and determine the accumulated doses in the DIR process.
The aim of this study, in addition to validation of the automatic localisation and accumulated doses from MIM software, also answers the questions: (i) When does the accumulated dose begin to change from the planned dose? and (ii) How much different is the accumulated dose from the planned dose at the last fraction? by using daily MVCT images in the DIR process.
Material and Methods
DIR validation
This study used the MIM software version 6.7 (MIM Software Inc., Cleveland, Ohio) for the DIR process. The method used for the validation of the localisation and accumulated doses was created by MIM software, as shown in Figure 1. The Cubic phantom (Lab Laser, France) that inserts the acrylic materials (density 1.15 g/cm3) was used to simulate changes of target and parotid glands in head and neck cancer. The kVCT image of the initial shape phantom was acquired by the computed tomography (CT) simulator to create HT treatment plans by the Tomotherapy Planning Station software version 5.1 (Accuray Inc. Sunnyvale, CA). After that, the MVCT images of the changed shape phantom were acquired by the HT unit (Tomotherapy Inc., Madison, Wisconsin, USA).
The process of DIR validation that used the cubic phantom to simulate two scenarios of anatomical status.

The structure validation of MIM software was explored by comparing the new contours on MVCT image for automatically created by MIM software and manually edited by knowing offset on the Plan adaptive software version 4.2 (Accuray Inc. Sunnyvale, CA). Dice similarity coefficient (DSC) can be calculated with the following formulaReference Lee, Kim and Ji12:
 $$DSC = {{2\left| {A \cap B} \right|} \over {\left| A \right| + \left| B \right|}}$$
where A and B are the volumes that MIM and plan adaptive software created, respectively. If the contours become identical, the DSC approaches the value of 1 because of the contour overlap. If the contours have no overlap, the DSC is 0.
Regarding the dose validation of MIM software, the new dose–volume histogram (DVH) which was created by MIM software was compared with the new dose distribution calculated by a collapsed cone convolution algorithm from plan adaptive software. Statistical correlation of DVH between both software was studied by using Pearson’s correlation coefficient.
Patient study
This study used one hundred and sixty-five images data from five nasopharyngeal cancer patients that were chosen randomly from those previously treated patients treated with IMRT techniques and delivered using a HT unit (TomoTherapy, Inc., Madison, Wisconsin). The prescription dose was 70 Gy to the gross disease at 2.12 Gy/fraction for a total of 33 fractions with a simultaneous integrated boost technique (SIB) according to the RTOG 0225.Reference Lee, Harris and Garden13 This study was granted an ethics exemption by the Institutional Review Board of Faculty of Medicine Chiang Mai University (study code RAD-2561-05828/Research ID: 5828).
Before delivering each fraction, each patient was positioned with an appropriate headrest and a personalised head and shoulders thermoplastic mask. Then, the daily MVCT was acquired on the HT unit by using a matrix of 512 × 512 with voxel dimension of 0.7634 × 0.7634 × 3 mm3. All 165 daily MVCT images were selected to cover the entirety of the planning target volume (PTV70) and both parotid glands. In cases where the image did not cover all of them, the image from the closest day would be used instead.
An HT plan based on kVCT image and daily MVCT was transferred to the MIM software for creating the deformed contour and daily accumulated dose. The dose–volume parameters to be evaluated were D50%, D98% and D2% for PTV70, D50% for PTV59.4, D50% and Dmean for the left and right parotid glands and D2% for the spinal cord. The daily accumulated dose from MIM software was compared with the initial plan. The Shapiro–Wilks test was used to verify the normality of the variable distribution to find the appropriate statistical tests for each data set. The data with normal distributions were analysed by paired sample t-test, while the data with non-normal distributions were analysed by the Wilcoxon signed-rank test. Both test metrics were compared to determine the statistical significance of each data set, with a threshold of p < 0.05. Statistical analysis of this study used version 23 of the SPSS statistical program. In addition, the accumulated dose at the last fraction was compared with the total dose of the initial plan by calculating the percentage of dose difference.
Results
DIR validation
The validation of the automatic localisation and accumulated doses from MIM software has been tested, and the results are shown in Table 1. The DSC values were calculated by comparing the new contours according to anatomical changes from MIM software with contours from the manual editing process with results of all contours greater than 0.8.
Results of the validation of the localisation and accumulated doses from MIM software

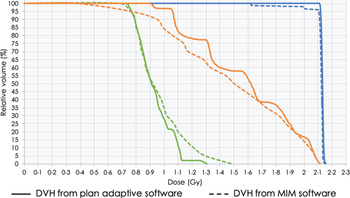
For the validation of accumulated doses, the new DVH that was created by MIM software was evaluated by Pearson’s correlation coefficient with new DVH from plan adaptive software as shown in Figure 2. All contours had a very strong positive correlation between the two DVH.
The dose–volume histogram (DVH) for target, left and right organ at risk (OAR) from plan adaptive software (solid lines) and MIM software (dotted lines).

Patient study
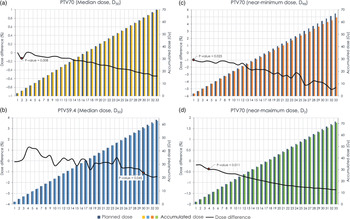
Figure 3 illustrates that the accumulated dose of target tended to decrease from the planned dose throughout the treatment. In the statistical study, the accumulated dose included D50%, D98% and D2% of PTV70 which were significantly different from the planned doses after the second (p-value = 0.008), first (p-value = 0.025) and fourth (p-value = 0.011) fractions of treatment. However, the D50% of PTV50.4 was significantly different after 30 fractions of treatment (p-value = 0.045). At the end of the treatment, the accumulated dose of PTV70 decreased on with an average 0.5 ± 0.27% (D50%), 4.8 ± 1.49% (D98%) and 1.3 ± 0.27% (D2%) the same as PTV59.4 which decreased on average 1.4 ± 0.70% (D50%).
Graph of average percentage of dose difference and histogram of planned dose and daily accumulated dose for (a) D50% of planning target volume (PTV)70, (b) D50% of PTV59.4, (c) D98% of PTV70 and (d) D2% of PTV70.

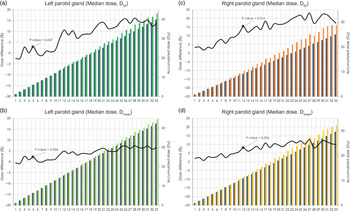
As regards organ at risk (OAR), the number of fractions that the accumulated dose significantly changed from the planned dose was different in each organ. The left and right parotid glands were significantly different after five fractions (p-value = 0.047) and twelve fractions (p-value = 0.016), respectively, while the spinal cord was significantly different from the initial plan after the second fractions of treatment (p-value = 0.002).
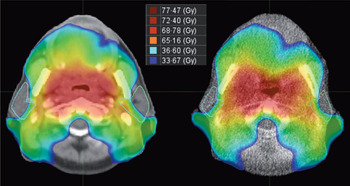
The accumulated dose tended to increase from the planned dose throughout the treatment as shown in Figures 4 and 5. In the last fraction, Figure 6 shows the dose distribution for both parotid glands compared with the initial plan. The accumulated dose was greater than the planned dose on an average of 13.5 ± 18.76% (D50%) and 6.4 ± 8.07% (Dmean) for the left parotid gland and increased on average 17.3 ± 16.60% (D50%) and 9.9 ± 10.74% (Dmean) for the right parotid gland. Moreover, the D2% of the spinal cord increased from the planned dose by an average of 10.4 ± 6.04% at the end of treatment.
The dose distribution for the left (green) and right (blue) parotid glands of the initially planned dose on kilovoltage computed tomography (kVCT) image (left) and accumulated dose at the end of treatment on MVCT image (right).

Graph of average percentage of dose difference and histogram of planned dose and daily accumulated dose for (a) D50% and (b) Dmean of the left parotid gland and (c) D50% and (d) Dmean of the right parotid gland.

Graph of average percentage of dose difference and histogram of planned dose and daily accumulated dose for D2% of the spinal cord.

Discussion
The anatomy of nasopharyngeal cancer patients has complex target shapes, and the tumour is surrounded by critical organs, so we designed the method to test for the accuracy of the DIR process in MIM software for validating the automatic contour. As regards the accuracy of the automatic new contour generation, the DSC values of this study were greater than 0.8 for all of the contours which is consistent with the research of Zimring et al.Reference Zimring, Talos, Bhagwat, Haker, Black and Zou14 that suggested that a satisfactory DSC value for adaptive radiotherapy application should be 0.7 or more. Moreover, Pearson’s correlation coefficient of the DVH from dose wrapping process (MIM software) and recalculation process (plan adaptive software) has very strong positive correlations for each contour as shown in Table 1. Thus, the DIR process in MIM software is appropriate for clinical applications. However, this validation method still has limitations, whether the shape of phantom that although we design the position of the OAR and the anatomy change to be the clinical situation, but the shape of targets and OAR is simple.
In the patient’s image results, the accumulated dose of the target was observed to decrease from the planned dose because the absolute volume from the DIR process was decreased from the initial plan resulting in a decreased dose value in DVH graph. In addition, the accumulated dose was significantly different from the planned dose after the first week of treatment which was consistent with a study by Huang et al.Reference Huang, Lu and Feng6 that recalculated the dose distribution on new CT images.
Regarding both parotid glands, several studies demonstrated that the accumulated dose increased more than planned dose throughout the treatment.Reference Huang, Lu and Feng6–Reference Qi, Santhanam and Neylon9 These results are consistent with this study where we observed that the volume of the left and right parotid glands decreased by an average of 1.12 and 1.01% per fraction, respectively, as well as the reduction of the target volume, resulting in both parotid glands moving towards the patient’s mid-plane which is a high-dose region, thus causing parotid glands dose to be increased.
All of the patient’s image results demonstrate the inter-fractional anatomic changes that affect the actual accumulated dose were different from the planned dose which radiation oncologists use for plan evaluation. These results allow us to realise that the DIR methods should be used for adaptive treatment strategies in the clinical practice.
This study is a retrospective study, thus has limitations of data acquisition for some patient’s MVCT image sets that did not cover a whole contour. Although PTV70 and both parotid glands have been resolved as described in the material and methods section, PTV59.4 and spinal cord are contours that do not have any MVCT images that can be covered as the kVCT images, especially spinal cord, which is an organ that does not deform. Thus, the significant changes in dosimetry are affected by image acquisition more than anatomical changes. In addition, D98% of PTV59.4, which is one of the parameters used for the evaluation plans, was not possible to evaluate in this study because 98% of the target volume was a high error. Another limitation is the small number of patients. However, the total number of image data of this study is as much as one hundred and sixty-five images data from daily acquired before treatment. This would be enough for achieving the objectives of this study. However, we suggest considering these limitations in a further prospective study.
Conclusion
The inter-fractional anatomic changes were evaluated for the effects of accumulated dose by using the DIR process in MIM software that has already been validated for accuracy. The results indicated that the actual dose that patients received was different from the planned dose. The accumulated dose of the target tended to be lower than the initial plan, while OARs were higher than the initial plan. However, the first fraction that is a significant dose difference varies in each target and the OARs. Therefore, these conclusions are important information for consideration of adaptive treatment strategies to increase the efficiency of treatment.
Acknowledgements
The author offers many thanks to TransMedics (Thailand) Co. Ltd. for supporting MIM software.
Financial Support
This research received no specific grant from any funding agency, commercial or not-for-profit sectors.
Conflicts of Interest
None.