

1. Introduction
According to both popular belief and scholarly accounts, urban areas tend to experience language shift faster than rural ones (see Veltman 1983:215, elsewhere), which may follow from what Fishman (1991:58) calls the “negative sociocultural dislocative consequences” of urbanization. Yet, little research has systematically pursued the extent to which this is true and, if so, how different rates of shift may be in particular urban versus rural settings. One way to begin to fill that gap is with fine-grained case studies of particular groups and regions, such as German speakers in the American Upper Midwest.
Anchored by burgeoning metropolitan Milwaukee, the southeastern region of Wisconsin has attracted remarkable numbers of German immigrants to the state from the mid-1800s into the early 20th century and since. In rural parts of the area, native speakers of German can still be found today, and recent work, such as Wilkerson & Salmons 2008, forthcoming, provides strong evidence that many remained German monolingual well into the 20th century. Urban Milwaukee soon became an influential regional hub for German culture and language, including publishing. Yet, language shift there has hardly been studied. Eichhoff (1971:55) writes:Footnote 1
One special problem to be dealt with is the study of German in urban areas. Milwaukee had a German-stock population of almost one-third in the nineteenth century, but Milwaukee German suffered an early and rapid breakdown.
Similarly, Conzen (1980:415–416) comments that although these communities were equipped with institutions and other social structures needed to maintain German, the fact that they were not as isolated as the rural communities “drew the second generation all the more inexorably into the American mainstream and made the community's survival dependent upon continuing immigration.” Louden (2006:134) also notes this rural/urban asymmetry, stating: “in those areas where such efforts were strongest–urban areas–generational transfer of German was the least likely to be successful.”Footnote 2
This area, thus, provides an opportunity to test the longstanding assumption of urban-rural asymmetries in language shift more systematically. By the turn of the century, when many smaller Wisconsin communities were still actively using varieties of German in various domains, the shift to English appeared to be more advanced in Milwaukee. While some Milwaukee institutions continued to use German well into the second half of the 20th century, a full German-language social fabric is thought to have tattered earlier. In this article, we investigate whether that view is supported, that is, whether urbanization appears to play a role in promoting more rapid language shift.
Specifically, we undertake a comparative regional case study, drawing data from three communities of very different sizes and types in southeast Wisconsin, each with a substantial historical German element: the small town of Lebanon, the small city of Watertown, and the large city of Milwaukee. Drawing information from the U.S. Federal Census and other sources, we examine institutional language shift in Milwaukee, Watertown, and Lebanon, with an eye to identifying possibly differential rates of shift. Our evidence shows no great overall differences across these three communities. This does not support the urban-rural dichotomy but is thoroughly consistent with the view that a general change in community structure drives shift in both urban and rural communities, in line with Roland Warren's (1978) Great Change model.
The paper is structured as follows. Section 2 lays out the model of the Great Change for understanding the development of American community structure in the late 19th and early to mid-20th centuries. This framework has already been applied to immigrant language shift, but we specifically place it in the context of urbanization. Section 3 gives a brief introduction to key aspects of German-speaking immigration to South-east Wisconsin, particularly the three communities under discussion. We then present census data (section 4.1), information from Lutheran churches on language use (section 4.2), and information from the German-language press (section 4.3). In section 5, we sift through those findings for possible differences in the rate at which people learned English and lost German. Section 6 is a conclusion.
2. The Great Change and Urbanization
The Great Change is a term used by Warren (1978) to encompass a number of changes in the social structure of American communities. These changes include:
• greater interdependence through an increased division of labor and specialization;
• participation in social activities organized less by locality and more by interest;
• increasing orientation to extra-community organizations;
• the development of impersonal bureaucracies;
• more societal functions being performed by businesses and government than by individuals and their immediate contacts (family, friends, neighbors, etc.);
• the growth of cities and their suburbs;
• a change in community values, which can be attributed in part to extra-community influences.
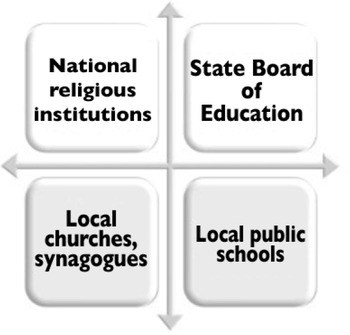
The repercussions of these related and overlapping changes have been “an increasing orientation of local community units toward extra-community systems of which they are a part, with a corresponding decline in community cohesion and autonomy” (Warren 1978:52).Footnote 3 As illustrated in figure 1, community institutions, exemplified here by organized religion and public education, have two types of extra-institutional connections. Local units are connected horizontally to other local units, while at the same time having vertical ties to regional and national agencies, organizations, and bureaucracies. For example, local public schools have horizontal ties to other institutions in their community because they share locality. At the same time, the school is under the purview of the State Board of Education (as well as other State and Federal agencies) that has the authority to make decisions for all of the schools it oversees, including regulating standards, curricula, and the qualifications for teaching.Footnote 4 While virtually all community institutions have this hybrid character, Warren (1978:63) argues that the Great Change facilitates verticalization, in which communities become “more and more a way station for various branches of national organizations.”
Local and extra-community institutional ties (following Salmons 2005a:135, 2005b:134).

While figure 1 illustrates vertical and horizontal patterns for public education and religion, the generalization holds for a wide range of public and private institutions, such as law enforcement (from local police and county sheriffs to the FBI) and commercial enterprises such as food distribution (for example, the local butcher versus a national chain grocery store). As indicated at the outset of this paper, we here present data from one private institution, Missouri Synod Lutheran churches, and one part of the economic sphere, German-language newspapers.
Warren does not directly address linguistic or sociolinguistic issues, but his theory of the Great Change has been used to analyze language shift in 19th and 20th German-speaking communities in Wisconsin by Salmons (2005a, 2005b), and later in a detailed case study by Lucht (2007). On this view, the weakening of horizontal (or intra-community) ties in favor of vertical (or extra-community) ties correlates tightly with shift, and Salmons and Lucht illustrate this with data from religion, education, and the immigrant press.Footnote 5 For language shift in Lebanon, Wisconsin, Lucht (2007) uses this framework to examine linkages between changes in community structure and the shift from German varieties to English.
Within this framework, the goal of the present study is to examine the potential role of urbanization in shift. Here we apply a broad definition of urbanization to describe the development of urban areas in 19th–20th century immigrant Wisconsin, as people increasingly concentrated in areas like Milwaukee.Footnote 6 Citing statistics from the Wisconsin Blue Book (a series of government almanacs), Nesbit (1989:573) charts the population of Wisconsin, separating rural and urban population statistics, defining urban areas as having a minimum population of 2,500. While 9.4% of Wisconsin's population lived in urban areas in 1850, approximately one third of the population (33.2%) was living in urban areas by 1890. By 1930, over half of the population (52.9%) was living in Wisconsin's urban communities. In cities like Milwaukee, this increased population density also correlates with industrialization and mass production, which all contributed to greater verticalization in community structures. Warren writes this (1978:75) about the dynamics of the Great Change and growing verticalization in communities:
[U]rbanization is so intimately intertwined with these changes as to be inseparable from them. The growth of cities and of social structures and behavior patterns associated with city living has constituted one of the most striking aspects of recent history.
Urbanization fueled by industrial development created metropolitan societies characterized by a division of labor, greater anonymity, and impersonalization, as well as a more heterogeneous population (Warren 1978:77). Whereas in rural communities the linkages tend to be more horizontal, urban communities are prototypically defined as vertical in nature. Thus, Warren's theory seems consistent with the traditional expectation of more rapid shift in urban areas. This is not to say that language shift is a necessary outcome of urbanization, but the more vertical structures associated with urbanization correlate with language shift. Also, with much greater population density, the opportunity for control of institutions to move beyond the relevant linguistic community becomes greater.
In a related effort to explain varying levels of maintenance of German in the United States, Seifert (1993:332) examined the “sizes and densities” of the German-speaking populations in these communities but arrived at the following conclusion:
This may be the most important factor in determining the development and survival of the German language in America, but nobody really knows how large and/or compact a settlement must be for some form of the language to be used actively in everyday life.
We fine-tune Seifert's observation by comparing evidence of shift in three different-sized communities, all with sizable German populations. We hypothesize that it is not strictly the size or density of the population that determines maintenance or shift, but rather the degree of verticalization within these communities. This process of verticalization facilitates shift by increasing dependency on extra-community organizations. While size and density represent critical aspects of a community of speakers, extra-community influences can affect language use in various domains of that community, which changes patterns of language use overall.
While the notion of community is ambiguous and its meaning can vary in scope and nature, Warren (1978:5–6) defines it as “a combination of social units and systems that perform the major social functions having locality reference.” In this paper, we use a traditional geographic-political definition of community when describing organization on the city and town levels. However, these geographic entities also consist of multiple communities, “communities within communities” (Warren 1978:7), such as the linguistic communities of German-speaking populations in Wisconsin, where dialect differences existed even in small communities.
In discussing social changes brought on by urbanization and verticalization in Lebanon, Watertown, and Milwaukee, we are specifically examining how these changes correlate with information on language use by German speakers in those three areas. While urbanization promotes vertical structures, it should not be assumed that urban areas cannot have strong horizontal linkages. Multiple small communities with dense, strong horizontal ties exist within larger cities. These smaller communities provide a firm basis for language maintenance, as in the case of Yiddish among Hassidim in the urban United States. Despite this fact, structural differences between such tight-knit urban communities and rural communities tend to correlate with greater verticalization occurring in the cities. Whereas rural communities remained largely dependent on family farms and local businesses well into the first part of the twentieth century, the process of industrialization had an immense impact on urban communities much sooner. As we show in the case of Milwaukee, tight-knit, urban German communities had strong horizontal linkages but were still more immediately susceptible to vertical pressures.
3. Immigration in Southeast Wisconsin
From before statehood in 1848, Wisconsin became home to frontier settlements and small-scale farming communities. With these settlements, especially in eastern Wisconsin, many indigenous communities were driven westward or northward, while others remained, especially in central and northern Wisconsin.
German settlement in the three communities under discussion here followed somewhat different patterns. Long populated by Native Americans including the Ho-Chunk and Potawatomi and recently frequented by trappers and traders, Milwaukee's first “Yankee,” or Anglo-American settlers, arrived in the 1830s (Gurda 1999:1, 3–4, 24–25). Originally called “Johnson's Rapids,” the city of Watertown was founded in 1836 also by Yankee settlers (Jannke 2000:7, 17). During the last part of the 19th century, the population of Watertown, Wisconsin underwent a 215% increase–from 2,778 in 1850 to 8,755 in 1890 (U.S. Census). This increase was largely brought on by an influx of German settlers. According to Bagwell & Olson (2006:3), “… in 1870, 27% of the population in Dodge County was German, which represented 70% of the foreign-born residents.” While this influx of German speakers did create a German-speaking community, some families began adopting English as early as the second generation after immigration. One group even went so far as to found a Baptist church in Watertown, partly in order to begin offering English services. Ultimately, rather than simply fostering a monolingual German-speaking environment, the influx of German settlers to the region seems to have aided the formation of southeastern Wisconsin English (Bagwell & Olson 2006, Salmons & Purnell 2010).
In sharp contrast to Watertown and Milwaukee, Lebanon was originally a German settlement that emerged as a result of the immigration of Old Lutherans to the area in the mid 1800s. In both Watertown and Lebanon, most immigration took place relatively early and mostly in a relatively compact period of time, as is typical for eastern Wisconsin. Most immigrants arrived by the 1870s, as shown by the data examined in Wilkerson & Salmons 2008 with respect to the nearby village of Hustis-ford.
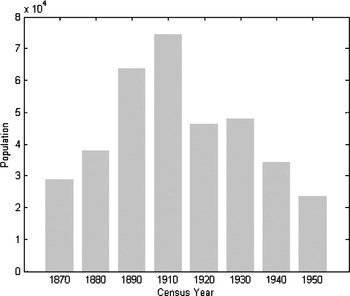
By comparison, Milwaukee has continued to attract German-speaking immigrants down to the present, with a notable influx of Displaced Persons after World War II. One simple measure of this is given in figure 2 below, showing that overall German nativity in 1950 was only slightly less than in 1870.
Over the course of this period of heavy immigration by German-speakers, the state also experienced a drastic diversification of its economic structure:
What had been in 1873 an extractive frontier economy producing primarily grain and lumber had by 1893 emerged as a mainly urban-centered economy operating on the leading edge of contemporary industrial technology. (Nesbitt 1985:v)
While the working population of Lebanon at this time remained engaged almost exclusively in farming, Milwaukee County ranked the highest in the state in the number of industrial workers from 1870–1890 (Nesbitt 1985:207, with further discussion in Lucht 2007).Footnote 7 Again, this is consistent with Warren's findings, with industrialization in an urban area promoting and even representing verticalization, and rural areas being better positioned to retain more horizontal structures.
German nativity in Milwaukee as reported on the national decennial census, 1870–1950 (Salmons & Purnell 2010).

4. Language Shift
We turn now to evidence for shift in each of these communities, presenting (1) U.S. census data on language, (2) data on church services, and (3) information on the German-language press. The first source provides information on the presence of German monolinguals, that is, the extent to which language shift has not yet begun in a community, while the second and third provide information on the robustness of institutional use of German. These measures, some of the most useful available to us, do not correlate directly with the loss of German as a spoken language but mark some key milestones. In discussing shift, we are looking specifically at domains in which German was once used that have now become English dominant. Fishman (1991:44) underscores the complexity of language shift and the importance of considering several different areas of investigation to have an accurate understanding of the processes at work, including looking at the “sociocultural context” and the domains in which language shift occurs.
4.1. The 1910 and 1920 U.S. Federal Census Reports
Information on demographics and immigration for Lebanon, Watertown, and Milwaukee can be found in the U.S. Federal Census reports. Immigration from German-speaking regions had peaked in Wisconsin before the turn of the century, with smaller numbers continuing to arrive in the early 20th century. Continued immigration, albeit not on the same scale as in the 19th century, would act as a maintenance factor. Whereas Lebanon continued to receive almost exclusively German-speaking immigrants, a more diverse population began to settle in Watertown and Milwaukee. In Watertown this meant mostly English-speaking immigrants from the United Kingdom, but also smaller numbers from non-English-speaking regions. While there was always more ethnic diversity in Milwaukee, the turn of the century saw the arrival of many new immigrants, largely from Central and Eastern Europe. Though ethnic neighborhoods in the mid 1800s were highly segregated (Conzen 1976:135), increasing diversity and connectivity to extra-community ties meant that community institutions would need to accommodate these new residents. Their presence likely increased the value of English as a lingua franca. While the mere existence of more diverse populations in these densely populated areas does not suggest shift–there are many cases of stable bilingualism that one can cite–the institutionalization of English did mean a reduction in the number of domains for German.
The census reports from 1890–1930 record English ability. The 1910 census not only reports ability to speak English but also records the native language for foreign-born and US-born non-English speakers (Lucht 2007:24). Wilkerson & Salmons (2008) draw on the 1910 Census for several Wisconsin townships to dismantle the popular notion that immigrants arriving in the 1800s immediately picked up English and ceased speaking their native tongue(s). Supplemented with data from other sources, they suggest the opposite: German monolingualism extended long beyond the period of mass immigration.
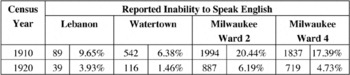
To gain a better understanding of the post-immigration linguistic environment in the early 1900s, we employ information from the 1910 and 1920 Census reports. Table 1 gives the numbers from the 1910 and 1920 Census Reports for individuals reporting an inability to speak English. It represents results from Lebanon and Watertown, as well as two wards in Milwaukee–Ward 2 and Ward 4–with different concentrations of German immigrants. In her detailed history of early immigrant Milwaukee, Conzen (1976:127, 129) states that in 1850, the German immigrants were most heavily concentrated in Ward 2 (44% of the total population was German). Ward 4, directly south of Ward 2, had a higher concentration of English speakers and was 9% German.
Individuals, 10 years old and older, reporting inability to speak English (U.S. Census).Footnote 8

Examining the reported language data from 1910 we find a smaller overall percentage of non-English speakers in Lebanon and Watertown compared to the two Milwaukee wards, which is likely due in part to a greater degree of continuing immigration. In Lebanon and Watertown, the majority of non-English speakers indicate German as their mother tongue for both the 1910 and 1920 census reports.Footnote 9 In Milwaukee, however, there is a greater degree of diversity among non-English speakers. In Ward 2, 47% of non-English speakers were German in 1910, dropping to 32% in 1920. In Ward 4, approximately one-third of the non-English speakers reported German (33.15%) in 1910, dropping to 19.47% in 1920.
It is easy to suspect that the drop in reported German mono-lingualism from 1910 to 1920 reflects more than the actual acquisition of English. In 1910, anti-immigrant sentiment was widespread in the U.S., and for a number of reasons, Wilkerson & Salmons (2008: 269–270) suggest that German monolingualism was likely to be under-reported. People with limited or no command of English still reported knowledge to census takers. Coming on the heels of World War I, 1920 represents a peak of anti-German sentiment, presumably motivating yet more over-reporting of English.
Although it is not surprising that newly arrived immigrants would have lacked a command of English, during this period U.S.-born individuals too reported an inability to speak English. Looking at the 1910 Census Reports as done by Wilkerson & Salmons (2008, forthcoming), Lucht (2007:32) counted 16 Wisconsin-born German monolinguals for Lebanon, 11 females and 5 males, ranging in age from 10 to 87. Those employed worked as farmers or laborers. The 1910 Watertown census records 18 Wisconsin-born German monolinguals, 15 females and 3 males, ranging in age from 12 to 98. As in Lebanon, those working were involved in farm work or were laborers, or specified that they had their own source of income. There are no reported German monolinguals listed in Milwaukee Ward 4, and only 3 in Ward 2, but expanding the search to include Wards 1–23 reveals a total of 221. Of this number, 157 are females aged 11–79 and 64 are males aged 10–78. Only states are given as birthplace, but further biographical research would be needed to determine how long these residents lived in the city or if they are transplants from rural areas. The majority of female U.S.-born German monolinguals in Milwaukee did not list an occupation and likely had limited contacts outside the home or immediate neighborhood, which increased their opportunities for continuous use of German.Footnote 10 Forty-seven of the male German monolinguals were employed outside the home working as carpenters, factory workers, teamsters, among other jobs requiring manual skill.
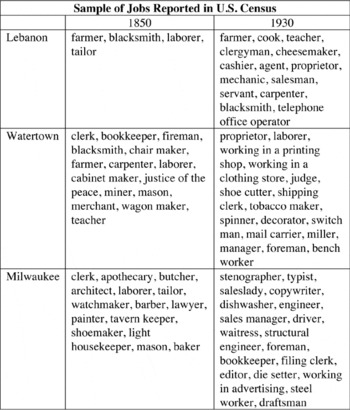
While it is not hard to imagine that a German-speaking plumber would have no problems working in a German-speaking neighborhood, or that he would have limited interaction with non-German-speaking customers, the increasing bureaucratization and hierarchy of jobs would create an environment that would promote English in work domains. The Census reports include occupations, which provides information on the economic structures of these communities. Comparing the earliest and latest census report available for all three communities, in table 2 below we see greater diversity and specialization of jobs in the 1930 reports than in the 1850 reports.
Regarding the rates of language shift, however, the Census data above do not offer a clear picture. Based on the available data, we see a dramatic drop in all three areas from 1910–1920 in the reported inability to speak English. Of these speakers, Milwaukee experiences a greater drop in the number of German monolinguals, but also had a smaller number to begin with. It is important to keep in mind here that the acquisition of English is simply a necessary first step toward shift, and that communities can and do remain bilingual for generations. Moreover, even within Milwaukee, analysis of other wards may show different results, given that the concentrations of German speakers varied tremen-dously throughout the city.
Sample of jobs reported in 1850 and 1930 (U.S. Census).

4.2. Data from Religious Institutions
Spolsky's (2003:89) review of research on religion and language use identifies several studies that suggest that religion can play an influential role in maintenance and loss of a language. In German American communities, German is often maintained longer in religious domains than in other domains (Salmons 2002:191). The Lutheran churches in South-eastern Wisconsin, in particular, used (American Standard) German in virtually all aspects of church life until the early 20th century, when changes in synod policies helped facilitate the shift to English (Lucht 2007:39–40). The Missouri Synod in particular kept careful records of language use in services, reported annually in the synod yearbook. This provides a source of data for language in Milwaukee and Watertown Lutheran churches, which we can compare with finer-grained information from Lebanon.
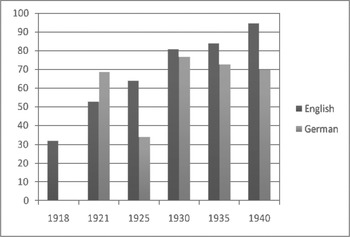
Number of services per month in English and German in all Milwaukee Lutheran–Missouri Synod churches. (Data on German services in 1918 was not reported.)Footnote 11

The gradual nature of the switch from German to English in Milwaukee Lutheran churches can be seen in the long history of English services as a part of church protocol. According to synod records, English services were being offered in some churches as early as 1918. In fact, out of 11 churches to file a report in the statistical yearbook for that year, only two reported no English services at all. The number of English services per month in Milwaukee's Lutheran churches doubles between 1918 and 1925, climbing fairly steadily from 1918 into 1940. Conversely, the number of German services per month decreases by about half between 1921 and 1925. A dramatic increase occurs in the number of German services per month between 1925 and 1930, though from 1930 the number of German services begins a steady decline. The “tipping point” at which trends seem to begin to change occurs in 1930, when numbers of services per month are almost equal. This is followed by a gradual divergence. Interestingly, this tipping point is preceded by dynamic changes in demographics, in which great changes occur in the number of English services per month as well as German ones.
Even in 1955, English services have not yet entirely displaced German ones. There seems, instead, to be a preference among older churches to maintain German services even when English ones are also offered. Indeed, it is primarily in churches founded in 1933 and later that no German services are offered.Footnote 12 Churches founded before 1894, by contrast, show a trend toward conservatism with regard to preserving German, as found for Texas by Salmons & Lucht (2006). The broad switch to English services seems to begin in earnest in 1947, with churches founded in 1933 onward leading the trend. Eleven “young” churches participate in this move to English-only, starting with Hope (founded in 1925) in 1930.
A few reports are of particular interest. Among the older congregations (which we define here as those founded in 1894 or before), one, Mt. Olive, seems fairly progressive, reporting nothing until English-only services in 1940. Individual histories reflect particular choices and often show “blips:” a church called Bethlehem, founded in 1888, reports consistently English and German services until 1947; only English in 1947, then back to English-German afterward.
In summary then, for Missouri Synod Lutheran churches in Milwaukee, having English services was not something new–it cannot be said to replace German services from one year to the next. English was already present from very early periods in synod churches; it only replaced German as services were phased out, beginning in the early 1930s and then heavily in the mid-1940s and declining from there.
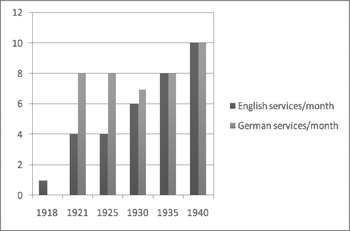
Lutheran–Missouri Synod Church services by language and year in Watertown, WI.Footnote 13

The church data in Watertown likewise suggest a gradual rise in the number of English services per month, as seen in the Milwaukee data. Unlike the Milwaukee data, however, English does not directly supplant German in Watertown churches but rather augments it, as the number of English services per month eventually comes to equal the number of German ones (see figure 4). In 1918, English services were still infrequent, as only one was reported in that year. Unfortunately, data for the number of German services per month for 1918 went unrecorded. By 1921, English services were becoming more commonplace. One church reports as many English services as German ones per month, while another reports four German services per month but no English ones. Reports remained the same through 1925, until 1930 when one church decreases its German services per month to 3 while raising the English services to 2. The other Watertown church maintains an equal number of English and German services for 1930. In 1940, all churches report equal numbers of English and German services per month. An equal presence was then maintained through 1955. Thus, Watertown churches seem to have been somewhat slow to adopt English services–as demonstrated by one church's refusal to do so until 1930. Once all churches did so, however, the English services seem to have been given equal representation with the German ones.
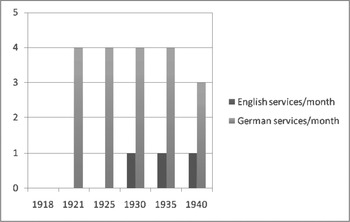
Church services by language and year in Lebanon, WI.Footnote 14

Over the time surveyed, a maximum of two churches in Lebanon submitted reports to the Statistical Yearbook of the Missouri Synod. Of these, St. Peter's is the first to report English services, which began in 1930 with a single service per month. German services continued to be delivered four times per month until 1940, when the number was decreased to three. One church, founded in 1934, begins reporting the use of English in services in 1947 but submits no earlier or later reports. Generally, although English services begin to be a part of church protocol in 1930, their presence seems to be largely secondary to the more numerous German services, whose numbers begin to decline in 1940. Because the Statistical Yearbook does not report numbers for services per month in each language past 1947, it is difficult to determine whether this decrease in the number of German services is a verifiable trend. Regardless, Lebanon churches report the presence of German and English services until 1955.
Lucht (2007) provides a qualitative and quantitative account of this shift to English in Lebanon's Lutheran churches. English use in the churches was a relatively modern topic: the first mention of switching to English was in the church notes of 1929 when one of the congregations suggested that they begin offering English services twice a month on a “trial basis.” German services continued through the next several decades until the 1960s and 1970s, when the congregations were unable to find pastors able to preach in both German and English. This pattern provides a notable example of the challenges presented by verticalization for even a relatively independent community like Lebanon–despite the dense population of German speakers who desired a German-speaking pastor, the extra-community institution of the synod was unable to provide one, and no seminary existed to produce one locally.
The same holds true for publications: once the congregations became affiliated with synods, they relied on their synods for their publications and church materials. The decision of which language to publish in became the domain of the synod publishing houses rather than the individual congregations. Reliance on the synods also had an effect on the training of teachers and pastors, and what materials were available for use in the classrooms. In the case of Milwaukee churches, heterogeneity among the congregation likely also contributed to an increased reliance on English as a lingua franca. Given the increased preponderance of vertical structures within the church, combined with a more heterogeneous congregation, Milwaukee shows far faster overall shift to English among Lutheran Missouri Synod churches despite the ongoing arrival of new German speakers. Other work is necessary to determine whether these trends hold for other churches and for other religious institutions.
4.3. The German Language Press in Wisconsin
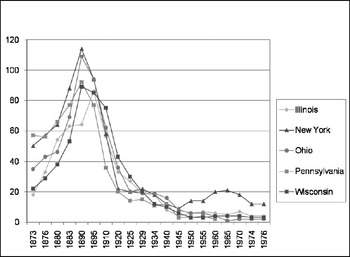
To serve the needs of its growing German-speaking population, Wisconsin developed an active German-language press with Milwaukee as its epicenter. Since the publication of the first German newspaper in the state in Milwaukee in 1844, the Wiskonsin Banner, Wisconsin has been one of the top five states producing German language publications from the mid- to late-19th century to the better half of the 20th century (see figure 6, from Lucht 2007).
Number of German-language publications, 1873 to 1976 (following Arndt & Olson 1976:805–806, and Lucht 2007).

Since the founding of the Banner the German press expanded throughout the latter half of the 1800s, showing a string of steady increases up to the year of peak production in 1890, when Wisconsin was home to 89 German-language newspapers and periodicals (Salmons 2002:183). As observed by Salmons though, after this time we see a sharp decrease in the number of new papers being published, as well as mergers and closings. Over the decade following 1910, the number of German papers dropped sharply and continued to decline. In 1934, there were 12 publications in the state. Salmons (2002:183) noted that while this figure includes newspapers, it is mostly specialty publications geared toward specific audiences.
While many previous scholars have attributed this decline to factors such as the advent of the World Wars, etc., Salmons (2002:190) argues that this process of decline in the production of German papers could be better explained in terms of the changes in societal and especially economic structures of the publishing industry, and that what the smaller German-language papers were experiencing was also the fate of many smaller English-language publications.
This is also illustrated by Lucht (2007), who looked at the decline of the Watertown Weltbürger. The Weltbürger was the main German language publication of the city, as well as that of its neighboring town Lebanon that did not have its own German-language publications. By examining the circulation figures as well as narrative histories of the paper, Lucht discovered that its demise was not the result of a loss of readership but several larger social factors. These factors included the development of new technologies in printing that were affordable for larger papers but not for smaller companies due to rising costs. Additionally, the ownership of the Watertown Weltbürger changed to a conglomeration, rather than a locally operated company, which then phased out the paper in favor of those with broader readership.
Watertown had lost its primary German-language publication, but the German-language press in Milwaukee was still active. Despite also experiencing decline, Milwaukee publishers were able to supply Weltbürger subscribers with copies of the Milwaukee Sonntagspost (“Up and Down Wisconsin” 1932). Even though the Milwaukee Sonntagspost ceased publication several years later, in 1939, it was succeeded by several German-language papers in the coming decades, including the current publication, Amerika Woche, which is a conglomeration of several German-language papers from across the country produced in Illinois.
These examples from the press are consistent with a connection between community structure and language shift, but they raise an interesting question for the traditional urbanization hypothesis. As with the church data, we expected that we would see shift earlier in Milwaukee than in Watertown and Lebanon. However, it seems that unlike the Weltbürger, which was brought down by conglomeration, the Milwaukee German-language press survived by becoming part of a conglomeration, even though it lost its individual character as a Milwaukee paper.
5. Comparing Urban and Rural Rates of Shift
Despite strong institutional support for the use of German and a large number of immigrants from German-speaking regions of Europe, Lutheran church goers tended to shift to English at a more rapid pace in Milwaukee than in Watertown and Lebanon. Although Milwaukee seems to have had the population size, the institutions, and domains for German language use, which might have assisted in long-term language maintenance, shifts in Lutheran churches follow a different pattern. Moreover, immigration continued much longer in this area than in most rural ones. The mid- to late 1800s saw an economy dominated by German businesses: “flour mills, breweries, tanneries, printing and engraving shops, and machine shops” (Zeitlin 2000:24). The city was often characterized as being “German:” “Deutsche Sprache, deutsche Sitten und Gebräuche, sowie deutscher Einfluss auf die politischen Verhältnisse sind daher hier vorherrschend” [German language, German customs and ways, as well as German influence on the political situation are thus here predominant] (Strohschänk & Thiel 2005:131–132). However, by the turn of the century, the once German dominant metropolis was changing in character, as described by Hense-Jensen & Bruncken (1900–1902, II:254):
Noch um das Jahr 1870, ja selbst zehn Jahre später, gab es gewisse Wards, der damals nicht sehr großen Stadt Milwaukee, in welchen man kaum ein englisches Wort auf der Straße hörte, und die Verkaufsläden beinahe ohne Ausnahme neben dem englischen auch ein deutsches Aushängeschild hatten. Nicht wenige bedeutende Geschäftsfirmen bedienten sich zum großen Theil in ihrer Korrespondenz der deutschen Sprache. Diese Eigenthümlichkeiten “Kleindeutschlands” sind jetzt fast ganz und gar verschwunden.
Still around the year 1870, even ten years later, there were certain wards of the then not-very-large Milwaukee in which one hardly heard a word of English on the street and the stores practically without exception displayed German signs next to English ones. Not a few important businesses conducted most of their correspondence in German. These characteristics of “Little Germany” have largely disappeared.Footnote 15
Starkly different is the situation in the town of Lebanon, where the shift to English was far more gradual, and particularly in the domain of religious institutions, with German language use persisting well into the first half of the 20th century before experiencing consistent decline.
6. Conclusion
The changes in American community structure outlined by Warren had a considerable weakening effect on local (“horizontal”) community ties in all three communities examined in this paper. Rural or urban, all three communities underwent different degrees of urbanization and verticalization at somewhat different rates, which correlates with slightly different rates of shift in various domains of language use. Despite all having relatively large German populations during the height of German immigration to the state, the changing social structures associated with the Great Change taking place across North America necessitated increasing dependency on resources and institutions outside of the local communities. Regional and national efforts at standardization and the development of governmental and other institutional bureaucracies incorporated, and in some cases replaced local autonomy and decision-making powers. The changing economic structures associated with urbanization and a state-wide movement from family farms to large-scale farming and nonfarming industries with a more specialized division of labor contributed to the development of stronger vertical ties to extra-community units, subsequently weakening local horizontal ties. An increasing orientation to the community at large has meant that domains that were once German dominant became English dominant.
Overall, then, we find surprisingly little asymmetry across the three communities treated in this case study. There are, for example, locally born German monolinguals in the smaller towns, but not in Milwaukee. Institutionally, though, we see the same processes at work, if at slightly different rates. While this runs counter to the traditional view of more rapid urban language shift, it is fundamentally consistent with Warren's view of the Great Change.
We have provided an overview of Census data to shed light on the changing demographics and immigration patterns in these three communities, paying particular attention to the domains of religion (using the Missouri Synod Lutheran Church as a case study) and the German language press. Naturally, investigation of additional domains of language use will provide better and finergrained tests of whether urbanization does indeed correlate with somewhat faster language shift. Shift does not occur evenly in all domains: religious institutions shift somewhat faster in Milwaukee and fewer American-born German monolinguals are found there, but the German press survives longer in Milwaukee, albeit for quite different (namely economic) reasons. A comparison of German language instruction in the schools and an investigation of language use in home life will give a more complete picture. One also must be aware that the variety of German in the domains of religion and the press is Standard American German. Thus, the data from these sources does not account for dialect use, which may present a different picture, as it is primarily used in the home domain.