Introduction
Of the 22 major calving glaciers in Patagonia, southern South America, 12 glaciers have been retreating considerably in a range from 1 to 13 km during the last 50 years (Aniya and others, 1992; Naruse and others, 1995a). On the other hand, Glaciar Perito Moreno (sometimes called simply Moreno) seems to have been in a rather stable stale, although it is well known that the glacier snout has oscillated frequently, causing damming of the proglacial lake and collapses of the ice-dam (Mercer, 1962; Aniya and Skvarca, 1992; Warren, 1994). In order to explain why this glacier behaves differently from other Patagonian glaciers, a large amount of data is necessary, especially on topography, ice dynamics and local climate. The present paper aims to compile various information about fluctuations of the snout and ice-dam ruptures over the past century, and also to show recent changes in ice-surface elevations and characteristics of the glacier flow.
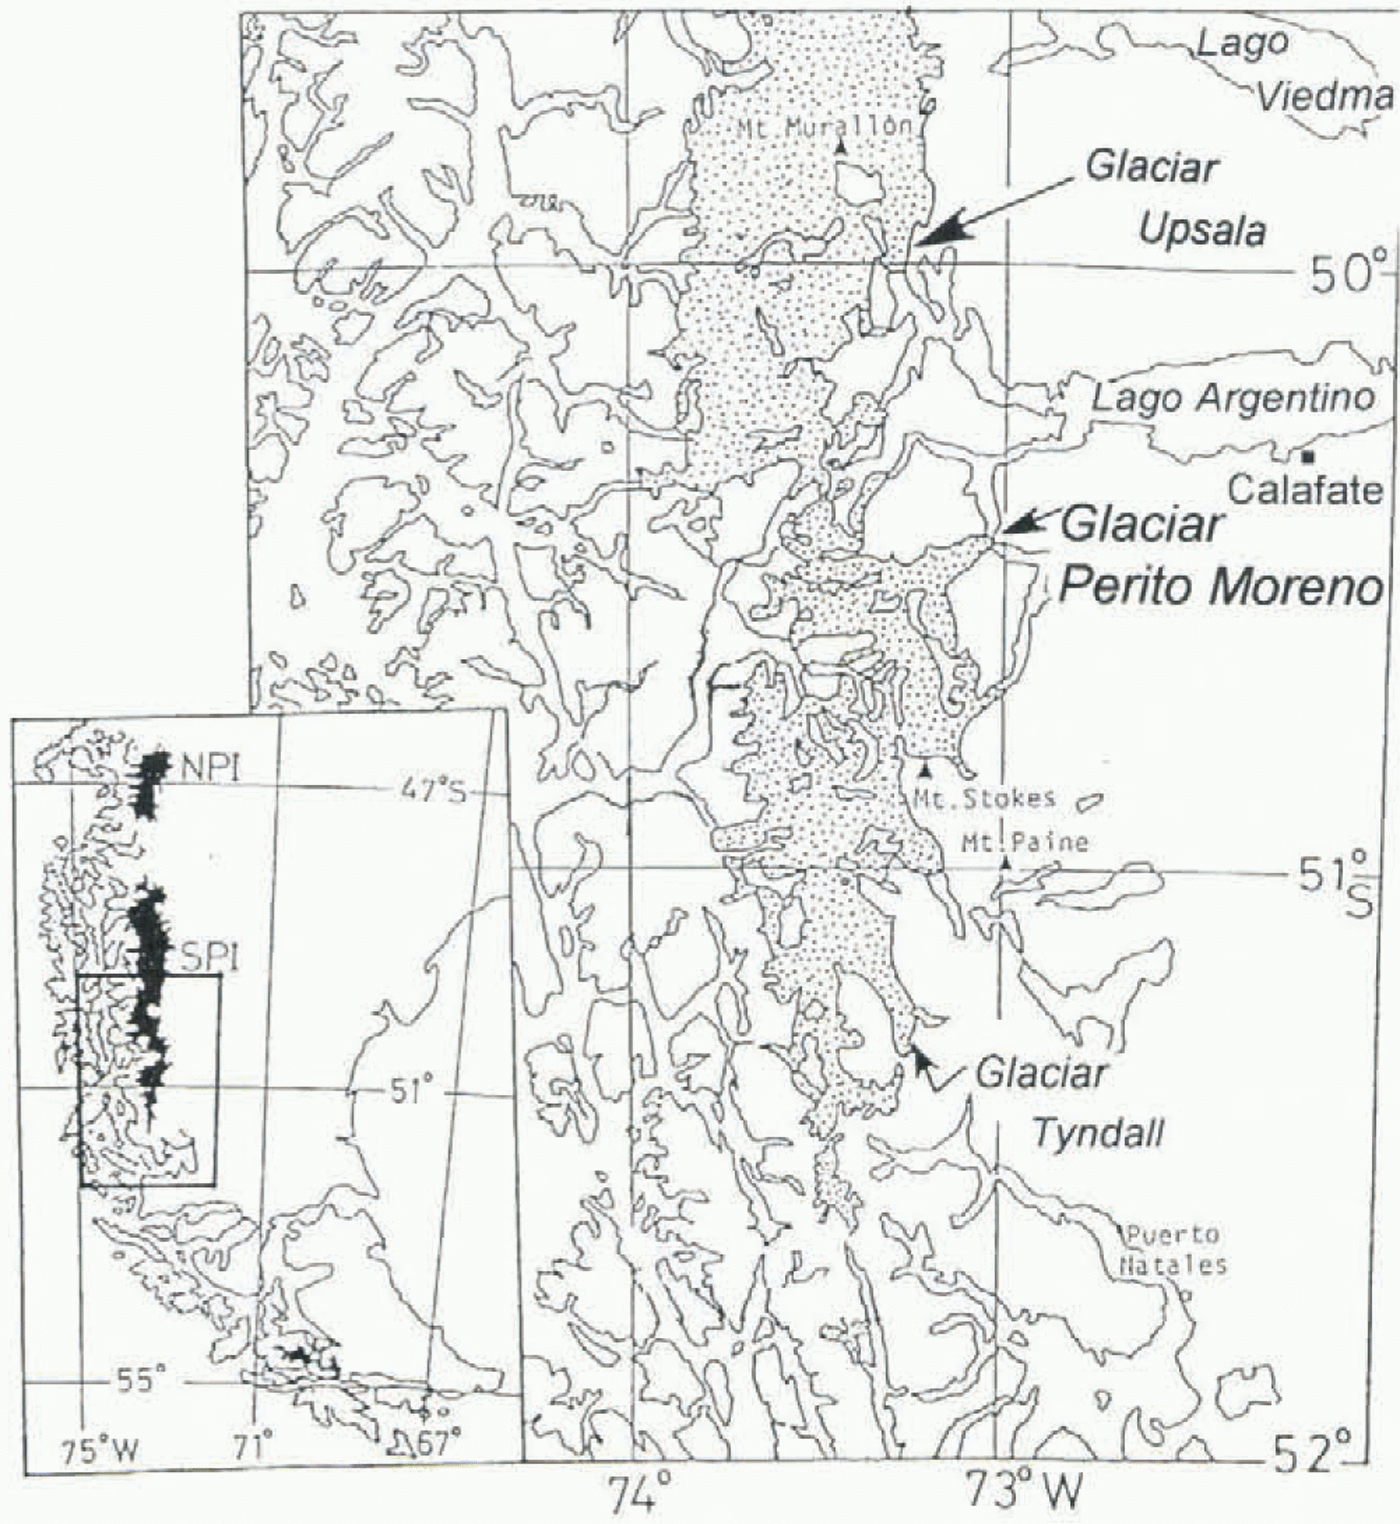
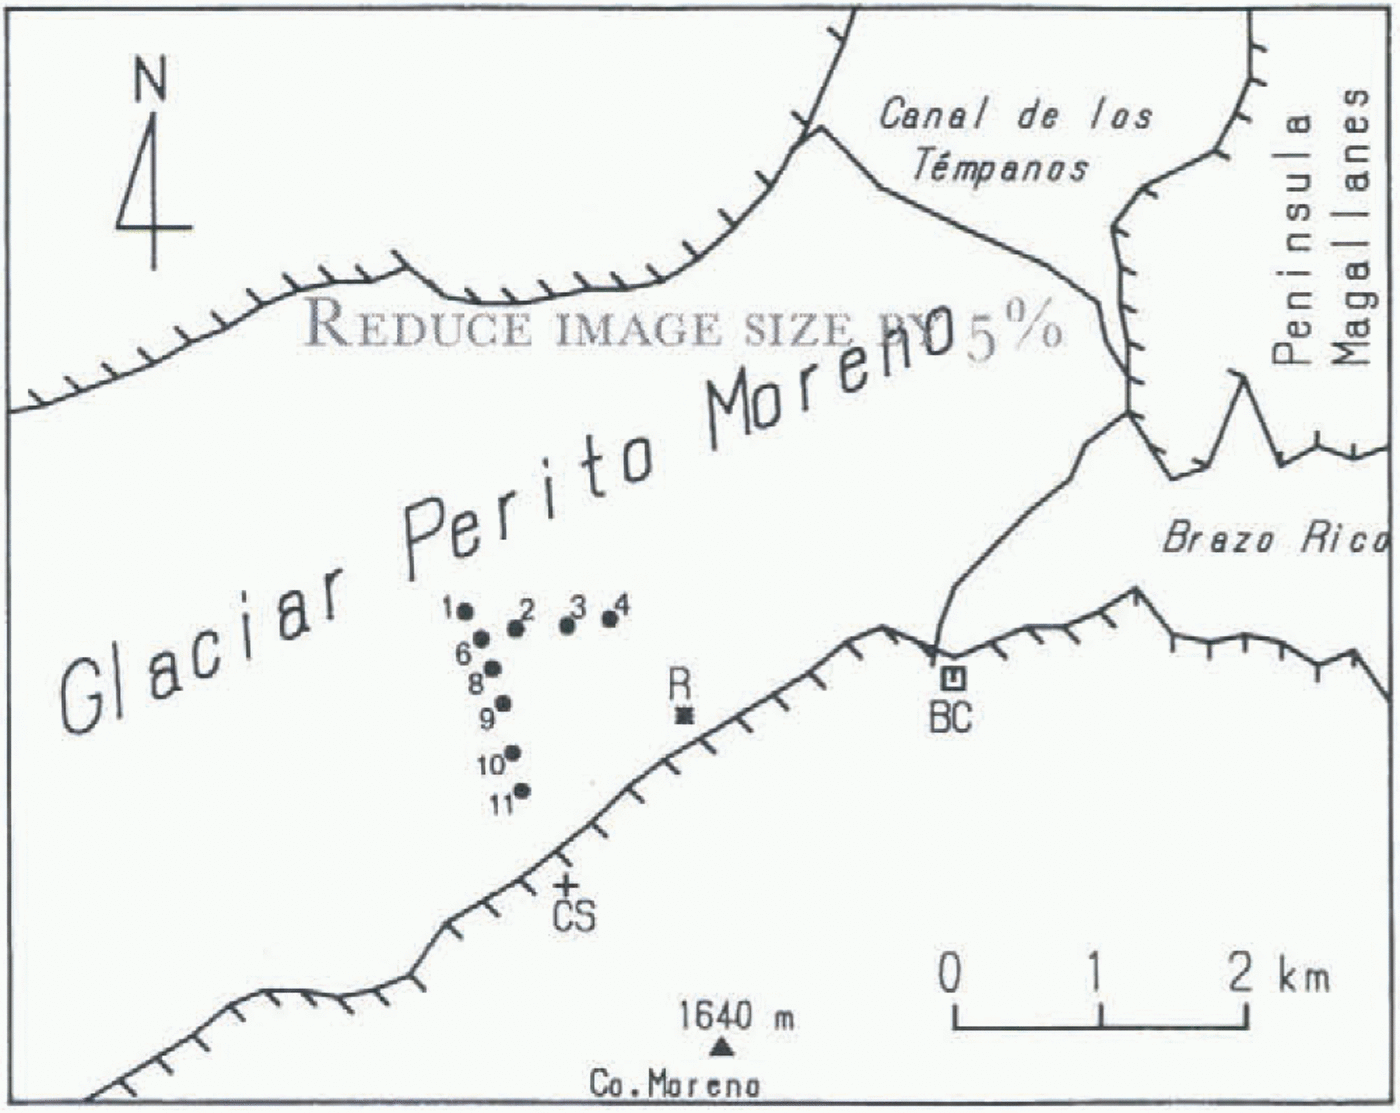
Glaciar Perito Moreno is an eastward outlet glacier of Hielo Patagónico Sur (HPS; southern Patagonia ice field, Fig. 1). The glacier flows northeastward for about 25 km from the ice divide on HPS and has an estimated drainage area of 257 km2 (Aniya and Skvarca, 1992); the accumulation and ablation areas comprise about 70% and 30%, respectively, of the total glacier area. The ablation area is a valley-type glacier 15 km long, and about 4 km wide. The snout of the glacier calves into the southwestern arm of Lago Argentina, namely into Canal de los Témpanos and Brazo Rico (Fig. 2), at an altitude of about 180 m a.s.l. The ice front currently (1990–96) reaches the opposite bank at Península Magallanes with a drainage ice tunnel at 50°28.5′ S, 73°02′ W (Fig. 3).
Numerous outlet glaciers discharge radially from Hielo Patagónico, mostly calving into fjords on the western side and into lakes on the eastern side. Before the 1970s, only a few preliminary studies of glacier dynamics had been made in Patagonia (e.g. Raffo and others, 1953). In 1983 and 1985, detailed surveys of flow velocity were carried out at Glaciares Soler and San Rafael (Naruse, 1985) in Hielo
Map of the southern part of Hielo Patagónico Sur, South America.

Location map of the ablation area of Glaciar Perito Moreno. The shape of the snout roughly represents that in 1990–95. Solid circles with numbers (1, 2, 3, …, 11) indicate survey points M1, M2, M3, …, M11 in 1990, 1993 and 1996. Mark + indicates the control station (CS), R is a survey point of short-term, velocity variations, and BC is the base camp.

Patagónico Norte (HPN; northern Patagonia ice field). It was found that the maximum flow speed as a mean over a few hours was about four times the minimum value at Glaciar Soler (Naruse and others, 1992b). Tidewater and freshwater calving phenomena were studied recently by Warren and others (1995a, b).
A comprehensive glaciological study on Glaciar Perito Moreno has been performed through the Japan–Argentina–Chile joint Glacier Research Project in Patagonia (GRPP) in the austral summers of 1990–91 and 1993–94. Measurements of surface elevation, ice flow and heat balance were carried out in the ablation area (Naruse and others, 1992a, 1995b). Another joint program on mass balance and ice dynamics of the glacier based on field researches and satellite data analyses was initiated in 1995, in cooperation between Innsbruck University, Instituto Antártico Argentino and Alfred-Wegener-Institut. This paper gives the results of the glacier dynamics undertaken as a part of GRPP between 1990 and 1996.
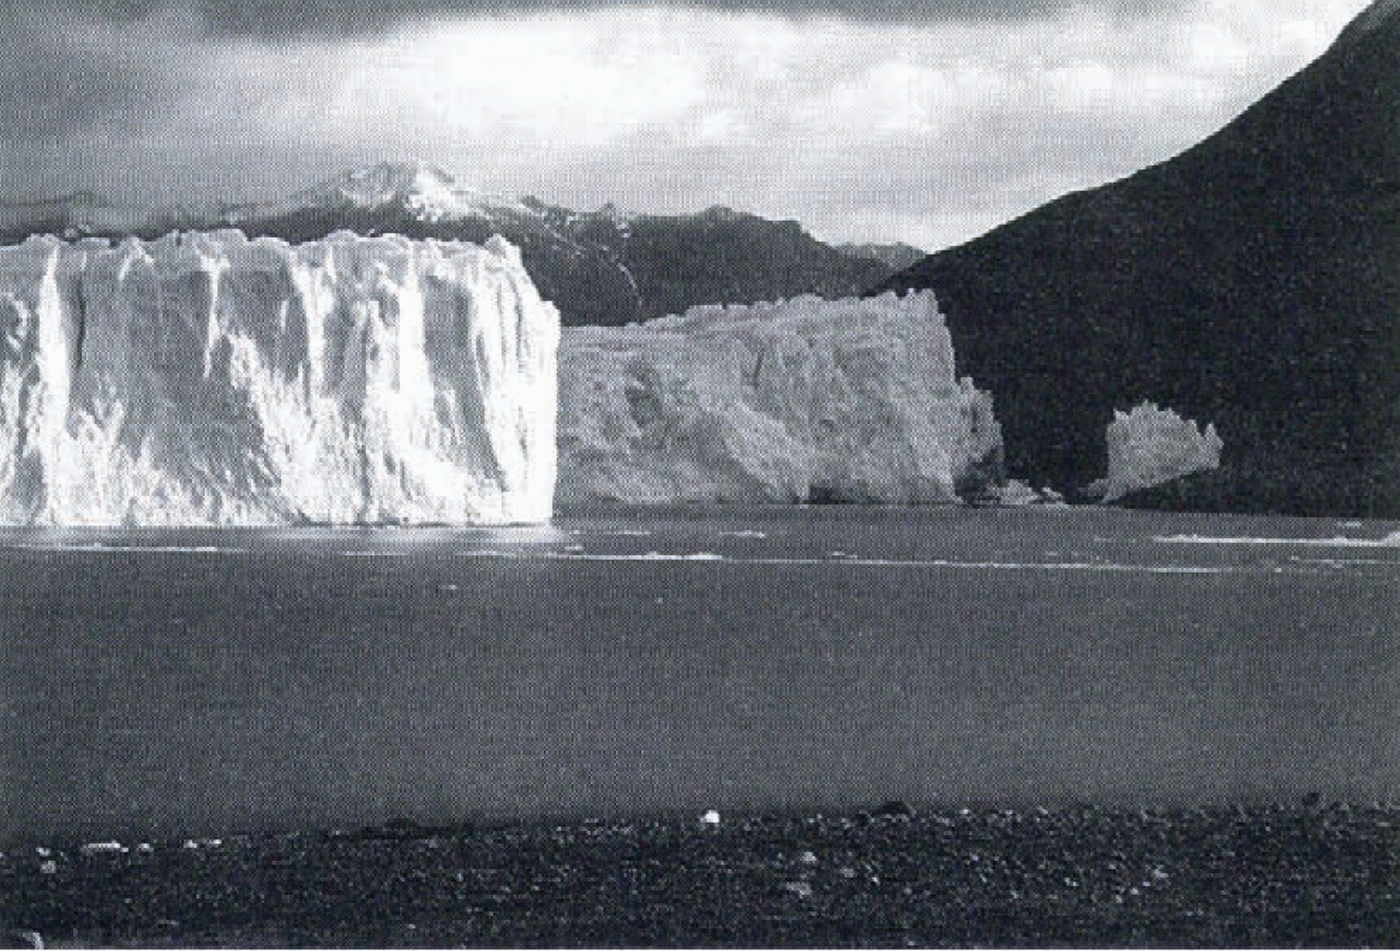
Frontal part, of Glaciar Perito Moreno seen from the southern beach of Brazo Rico on 6 April 1996. In early 1996 the ice bridge collapsed and a narrow channel has opened again between Canal de les Témpanos and Brazo Rico.

History Of Front Fluctuations During The 20Th Century
A detailed description of the lower part of Glaciar Perito Moreno was first given by Hauthal (1904). He measured the outermost edge of the glacier tongue of 30 m height with a prism compass in February 1899 and March 1900, obtaining an advance of 140 m in 2 years. In March 1908, the Skottsberg Swedish Expedition visited the same place, and Quensel (in Reichert, 1917) checked Hauthal’s data and confirmed the further advance. In March 1914, Reichert and Hicken (Reichert, 1917) measured the distance from the glacier snout to the foot of the opposite bank to be 100–150 m. They predicted that, if the advance continued at the same progression, it would take 5 years until the glacier completely closed the Témpanos channel. Reichert (1917) mentioned, “Because the nearby glaciers are neither advancing nor stationary but are retreating, the fluctuations of glaciers which come from the large interior ice sheet may depend only on the local conditions, governed by the topography and by the amount of accumulation”.
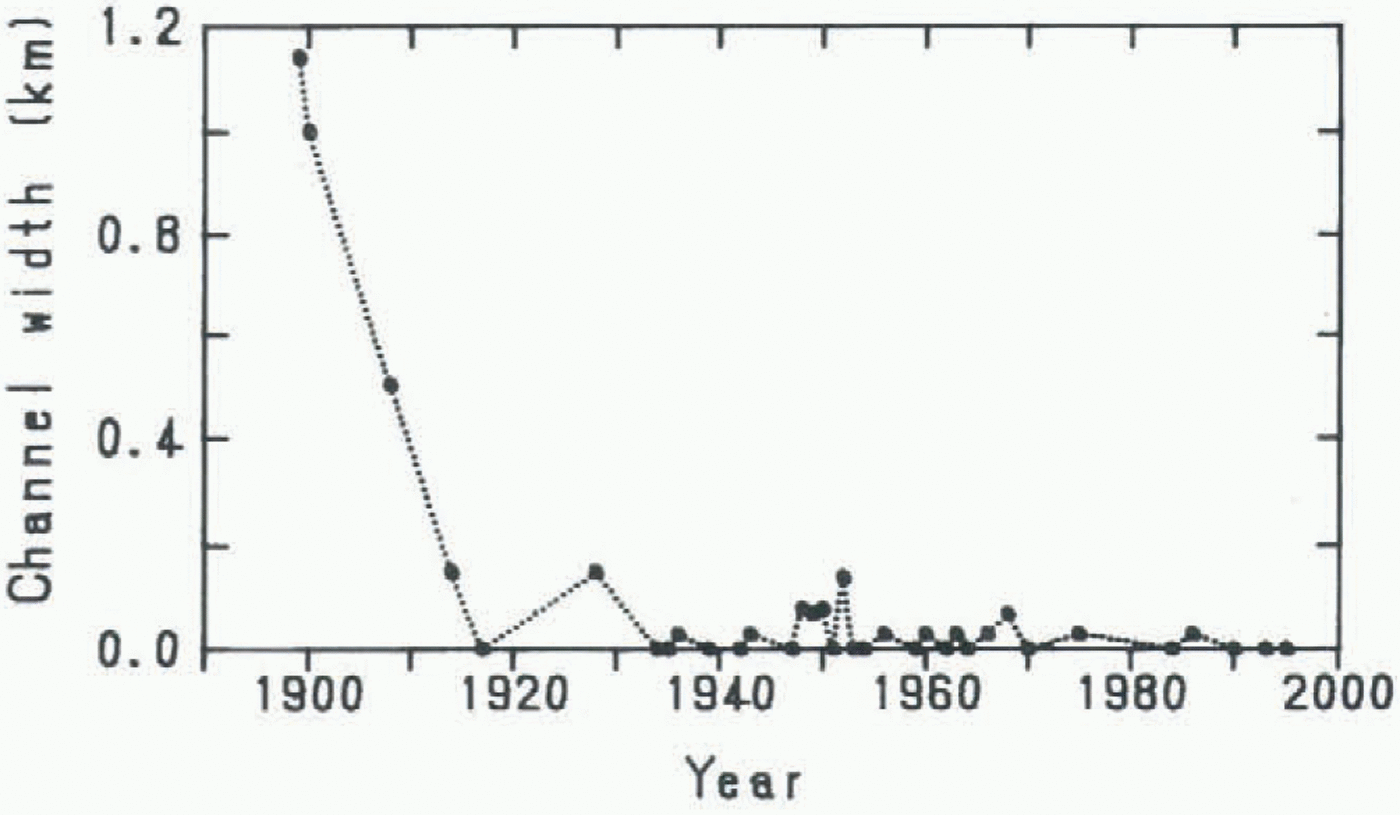
Fluctuations in the frontal position of Glaciar Perito Moreno during the 20th century, expressed in terms of the channel width between the glacier tongue and the shore of the opposite bank, Peninsula Magallanes. Data sources: Hauthal (1904) for 1899 and 1900; Reichert (1917) for 1908 and 1914; R. A. Chiesa (unpublished) for 1917–42; Raffo and others (1953) for 1943–53; Liss (1970) for 1954–66; Aniya and Skvarca (1992) for 1968–90; and present study for 1990–95. If the glacier tongue overrode the opposite shore, the channel width is indicated as 0 m. When an event of ice-dam rupture is known, the channel width is assumed to be 30 m after the rupture.

Raffo and others (1953) compiled the fluctuation data, including the above, up to 1953. Liss (1970) and R. A. Chiesa (personal communication, 1994) of Administración Nacional de Parques summarize the events of ice-damming and rupture of the glacier from early in the century to 1966 and 1988, respectively. Aniya and Skvarca (1992) revealed the frontal positions from 1947 to 1986, based on air photographs and Landsat data. According to the available information, ice-dam formation and rupture had occurred at intervals of 1–5 years during the period from the 1930s to the 1980s, the 1988 break-up event being the last recorded.
Figure 4 shows the variations in channel width between the outermost frontal edge of Glaciar Perito Moreno and the shore of Península Magallanes. It is clear that the glacier advanced steadily from the end of the 19th century to 1917, the year that the channel closing was first documented according
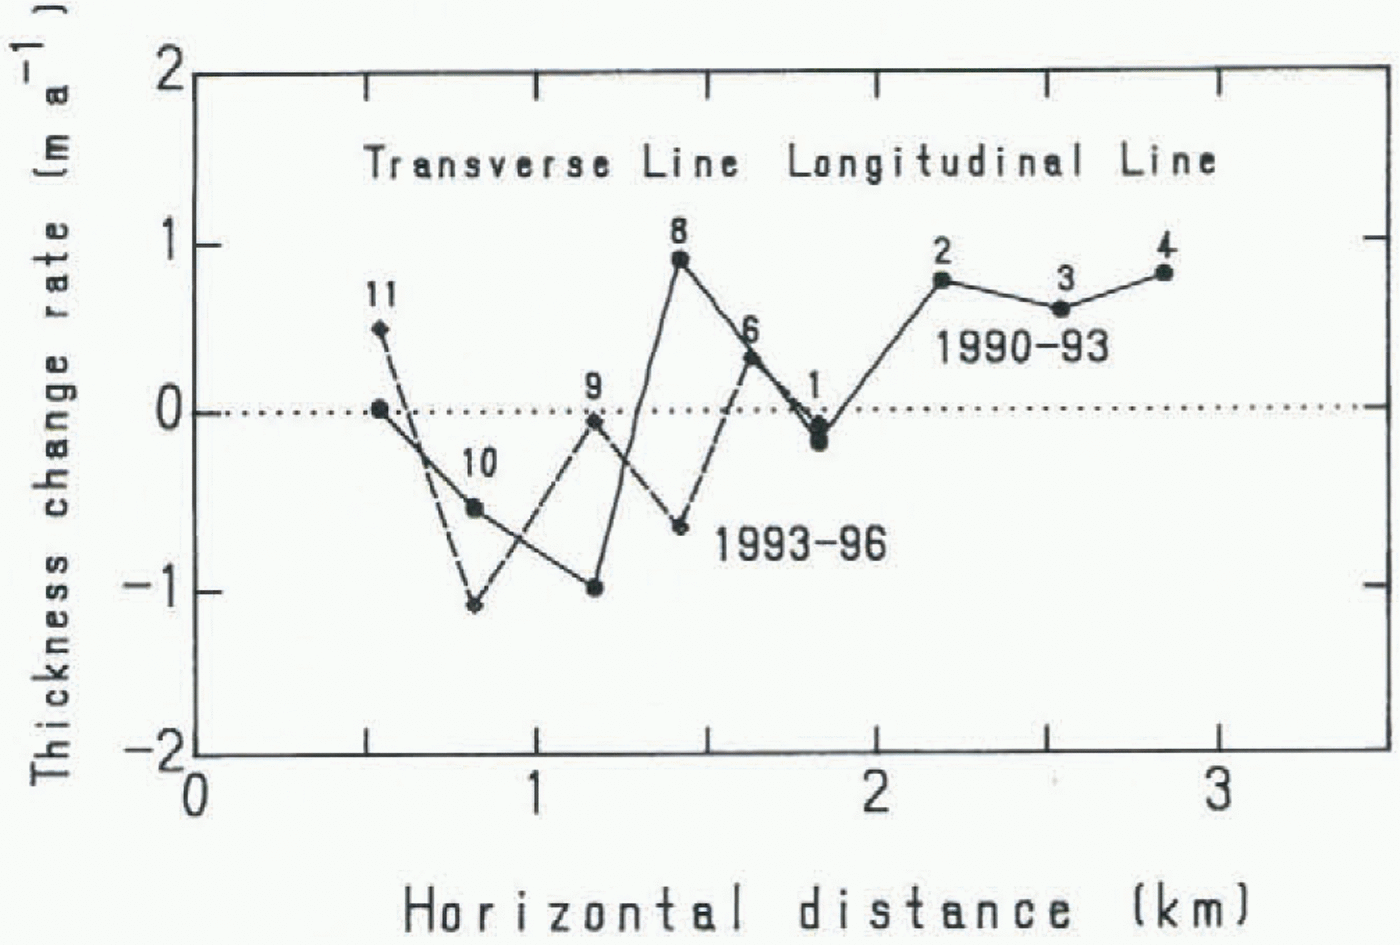
Distribution of the annual thickness-change rate. The negative sign indicates thinning. A solid line indicates the result obtained from November 1990 to November 1993 (Naruse and others, 1995b), a broken line that obtained from November 1993 to April 1996. The rate at point M6 was obtained from surveys in 1990 and 1996. Numbers (1, 2, 3, …, 11 attached to solid circles indicate survey points M1, M2, M3, …, M11. Points M11–M1 are along a transverse line, and points M6–M4 are along a longitudinal line (see Fig. 2).

to Liss (1970). From the 1930s to the present, the fluctuations have been within several tens of meters. In contrast to the significant retreat rates of most Patagonian glaciers, of l–13 km during the last 50 years (Aniya and others, 1992; Naruse and others, 1995a), Glaciar Perito Moreno seems to be stationary during the same period.
Ice Thickness Change
Change in ice thickness at a point fixed to the space can be obtained from the difference in surface elevations measured at different times. Surveys of surface elevation were made in the austral summers of 1990–91, 1993–94 and 1995–96 in the ablation area of Glaciar Perito Moreno.
A control station (CS) was established in the 1990 survey (Naruse and others, 1992a) at about 430 m a.s.l. on the southern (right) bank about 5 km from the front of the glacier (Fig. 2). An azimuth point was set up about 100 m from CS. For the surveys in 1990, 1993 and 1996, an electronic distance meter (Topcon EDM-Theodolite Guppy with a minimum reading of 1s) or a laser distance meter (Geo-Fennel, Model: Pulsar 50) and a theodolite (Zeiss Th 2) were utilized at the control station, and a reflector was placed by a mobile team at survey points around 360 m a.s.l. on the glacier.
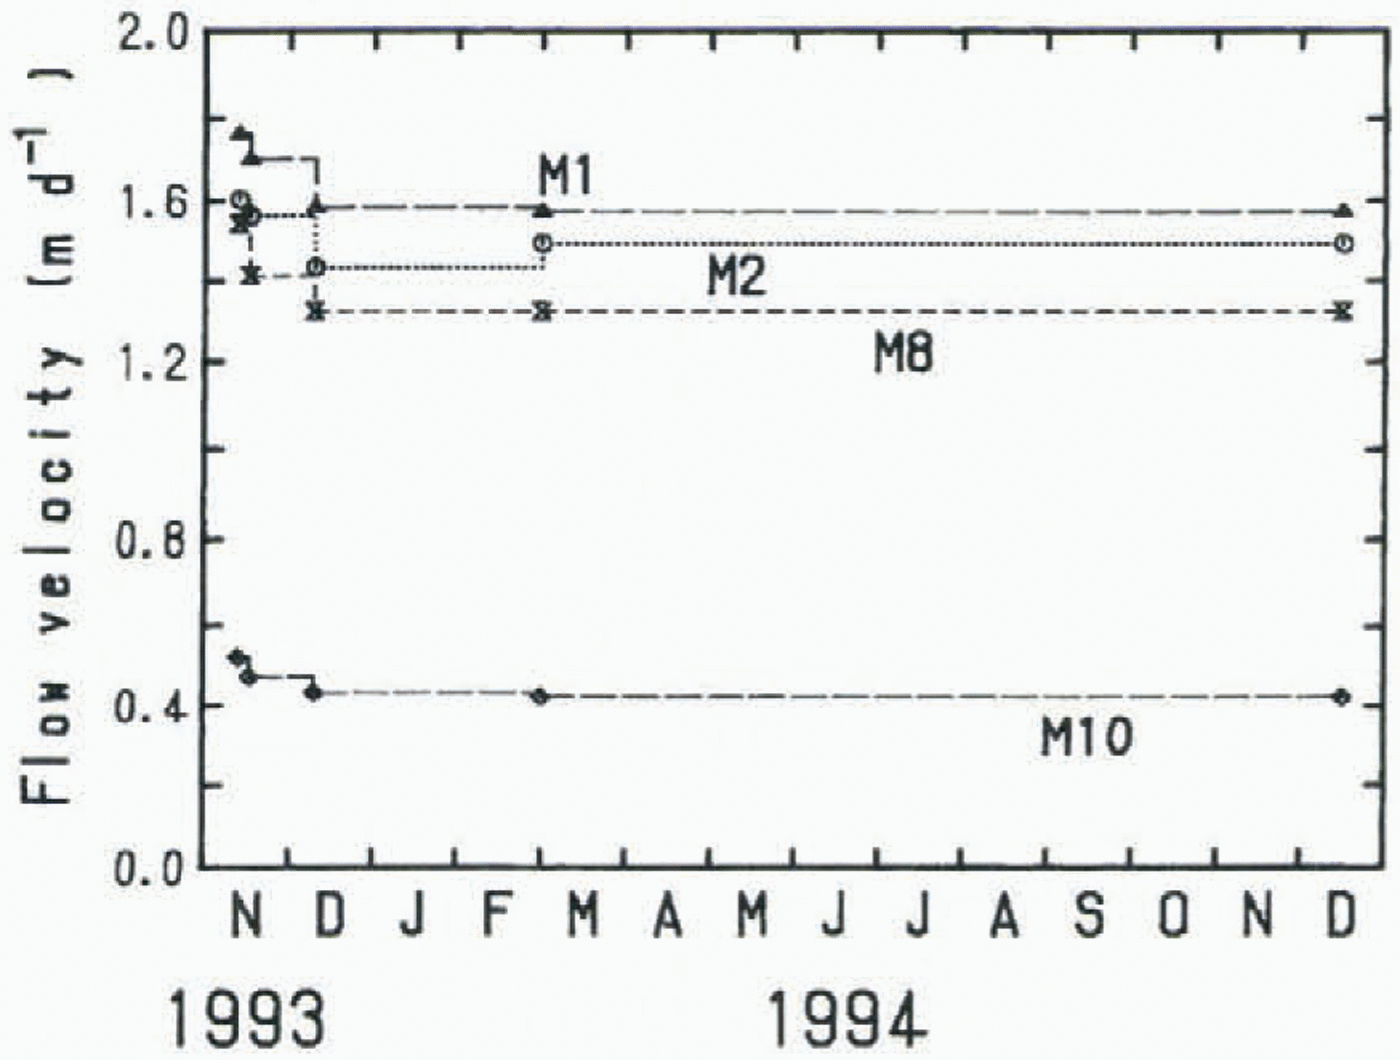
Variations in surface flow velocities at four points, 12 November 1993–15 December 1994.

The first measurement was made on 25 November 1990, and three-dimensional coordinates of 11 points on the ablation area were determined. In the second and third measurements (10 November 1993 and 1 April 1996), the same survey points as in 1990 were located by using the raw data of the horizontal angles and distances measured in 1990. Of 11 points, three (M5, M6 and M7) were not accessible in 1993, due to the existence of heavy crevasses or large supra-glacial ponds. Measurements were performed at eight survey points in 1993 and at six points along a transverse line (Fig. 2) in 1996. The difference in surface elevations at the same coordinates corresponds to ice-thickness change at the point.
Changes in ice thickness from November 1990 to November 1993 ranged from +2.7 to −2.9 m, while those from November 1993 to April 1996 ranged from −3.2 to −6.6 m. The latter period covers 2 years and 143 d in summer. Thickness change is the difference between emergence velocity and surface net ablation. Assuming an emergence velocity of 12 m a−1 and a summer ablation in 143 d of 8.9 m in ice, which are rough estimates based on Naruse and others (1997), the measured thickness changes from November 1993 to April 1996 were corrected to annual values.
Annual thickness change rates are plotted in Figure 5. The rate at point M6 was obtained from the measurements in 1990 and 1996. From 1990 to 1993, the mean thickening rate of eight points was +0.17 m a−1, and the mean of five points along the transverse line was −0.16 m a−1, whereas from 1993 to 1996 the mean of six points was −0.43 m a−1. There are numerous crevasses and ice mounds several meters high on the glacier surface. The movement of undulating surface with the glacier flow may have caused surface elevation changes of the order of several meters during 3 years. The thickness change measured as smaller than this value, namely, about 2 m a−1, can be attributed to the undulation. Hence, we can say the ice thickness of Glaciar Perito Moreno has not changed significantly during the last 6 years.
Flow Velocity
Surface ice-flow velocities covering different seasons in a complete year have never previously been measured on any glacier in Patagonia. For the first time such data became available from sequential measurements carried out at Glaciar Perito Moreno during the 1993–94 field campaign.
Aluminum poles 10–12 m long (in 2 m sections) were set up in about 10 m deep holes drilled with a steam drill at four survey points (M1, M2, M8 and M10) on 11 November 1993. Positions of the four points and heights of the poles above the ice surface were measured five times: on 12 and 16 November and 9 December 1993 and 1 March and 15 December 1994. In the last measurement, all the poles were found laid clown near or in the holes which were enlarged due to ice melting.
Variations in flow velocities covering a full year, November 1993–December 1994, are shown in Figure 6. At all four points the velocities from November to December 1993 are larger than the annual mean. However, no significant changes were observed between the periods December 1993–March 1994 and March–December 1994.
Discussions And Conclusions
A profile of water depth in Brazo Rico was reported by Hauthal (1904), showing a maximum depth of 137 m near the glacier tongue. Heights of the tongue of Glaciar Perito Moreno above the lake level were measured as being in the range 55–75 m (Naruse and Aniya, 1992). Based on these statistics, the glacier tongue should be grounding in any period. Therefore, the fluctuations of the glacier during the 20th century do not correspond to those of floating ice tongues.
Of the 22 major calving glaciers in HPN and HPS, 9 glaciers have been fluctuating within 1 km, and 12 glaciers have been retreating in a range from 1 to 13 km (Glaciar O’Higgins) during the last 50 years (Aniya and others, 1992; Naruse and others, 1995a). Considering these variation rates of Patagonian glaciers, Glaciar Perito Moreno can be regarded as having been in a stable condition during the last half-century.
Ice thickness in the ablation area of Glaciar Perito Moreno was found to have remained unchanged for 6 years since 1990. On the other hand, large thinning rates were obtained of 11 m a−1 near the terminus of Glaciar Upsala (Skvarca and others, 1995) and of 3.1 m a−1 at the upper reach of the ablation area of Glaciar Tyndall (Nishida and others, 1995). Frontal positions of these thinning glaciers have been receding considerably.
From the results of the frontal variation and thickness change at Glaciar Perito Moreno, we can conclude that this glacier, at least its ablation area, is currently in a steady state. The near-steady behavior of the glacier may be attributed to the downslope bedrock topography near the glacier tongue. Many studies have revealed empirically that calving rates are linearly related to water depths (Funk and Röthlisberger, 1989; Warren and others, 1995b), so that, at Glaciar Perito Moreno, the calving rate may increase with the front advance, and decrease with a retreat. Thus, the calving has a regulating effect on the front fluctuations.
In the early summer (November), the ice flow velocity obtained was slightly larger than the annual mean. However, since no measurements were made from March to December, seasonal fluctuations in velocity could not be detected. On the other hand, short-term fluctuations of flow velocity were measured at a point R near the right margin (Fig. 2) at intervals of 2–8 h in November 1993 (Naruse and others, 1995b). It was found that the velocity fluctuated significantly from 4 to 11 mm h−1 within several hours, being larger in afternoons and smaller in mornings. A relatively high correlation can be noticed between velocities and air temperatures. These variations can be considered to be due to the basal sliding variations, as has been found at other glaciers (Iken, 1978; Kamb and Engelhardt, 1987).
Near the glacier front, the mean air temperature in the coldest month (June) was measured at +0.3°C. Therefore, meltwater may be drained to the glacier bed even in winter, so that basal sliding is possible, though the velocity may be much smaller than in summer. It is thus concluded that basal sliding is significant throughout the year at this temperate glacier.
To clarify the mechanism of response of this near-steady glacier, knowledge of the calving rates and the bottom topography of the proglacial lake is greatly needed.
Acknowledgements
The authors are grateful to T. Toconás, J. Lusky, B. Roil, H. Rott and T Nagler for their help in finding and remeasuring the stakes on different field trips, as well as to N, Benedetti for resetting the 1990 traverse profile in April 1996. They are thankful to C. Skvarca, who found two ablation poles in a crevassed area after 394 d. Thanks are due also to Compañia Hielo y Aventura and Adminstración de Parques Nacionales — Intendencia Parque Nacional los Glaciares for their efficient logistic support.