Implications
In milk-fed calves, ruminal drinking occurs when ingested milk replacer enters the reticulorumen instead of the abomasum. Previous studies have indicated that subclinical ruminal drinking may be substantial (13% to 25%) in veal calves, and is therefore likely to affect nutrient utilization. The volume of ruminal milk can be measured by assessing recovery of an indigestible dietary marker in the rumen but this method cannot be repeated in the same animal. Ultrasonography allows estimation of the volume of milk replacer reaching the abomasum at feeding, which can be used to calculate the volume of milk replacer that leaks into the rumen.
Introduction
In calves, milk replacer bypasses the rumen and enters the abomasum directly because of closure of the esophageal groove (Guilhermet et al., Reference Guilhermet, Mathieu and Toullec1975). It is therefore commonly accepted that digestive processes in milk-fed calves resemble those in true monogastric animals. Nonetheless, even in calves that are not clinically identified as ruminal drinkers, considerable amounts of milk replacer may enter the rumen (called ‘ruminal milk’; up to 25% of milk intake, Suárez et al., Reference Suárez, Van Reenen, Stockhofe, Dijkstra and Gerrits2007), which may induce ruminal and metabolic acidosis in a clinical case (Gentile et al., Reference Gentile, Sconza, Lorenz, Rademacher, Famigli-Bergamini and Klee2004; Herrli-Gygi et al., Reference Herrli-Gygi, Steiner, Doherr, Blum, Kirchhofer and Zanolari2008). Owing to fermentation of nutrients from milk replacer in the rumen, ruminal drinking will decrease nutrient availability and the efficiency of nutrient utilization for protein and fat retention (Armstrong, Reference Armstrong1969; Herrli-Gygi et al., Reference Herrli-Gygi, Hammon, Zbinden, Steiner and Blum2006), hence reducing growth performance in calves. Therefore, identifying ruminal drinkers and quantifying the volume of milk replacer that leaks into the rumen (ruminal milk volume, RMV) in non-clinical ruminal drinkers is of importance in nutritional practice and in nutritional studies, and is required to identify age-related developments, within and between animal variation and risk factors in the occurrence of RMV.
Quantification of RMV requires measuring the volume of milk replacer that is recovered in the rumen after feeding. This can be achieved by providing a soluble indigestible marker with the last feeding before slaughter, and then measuring marker recovery in the calf’s rumen at slaughter (Suárez et al., Reference Suárez, Van Reenen, Stockhofe, Dijkstra and Gerrits2007; Berends et al., Reference Berends, Van Reenen, Stockhofe-Zurwieden and Gerrits2012). This direct measurement requires quantitative collection of rumen contents, and does not allow repeated measurements on the same animal. Furthermore, it may be biased by postmortem equilibration of hydrostatic pressure. Repeatable and less-invasive methods to identify ruminal drinkers have also been proposed, such as the acetaminophen absorption test or imaging techniques. The acetaminophen absorption test has been successfully used to identify, but not to quantify, ruminal drinking in lambs and calves (Schaer et al., Reference Schaer, Herrli-Gygi, Kosmeas, Boschung and Steiner2005; Herrli-Gygi et al., Reference Herrli-Gygi, Steiner, Doherr, Blum, Kirchhofer and Zanolari2008; Sharifi et al., Reference Sharifi, Gründberg, Soroori, Mohri and Ahrari-Khafi2009). This test involves provision of acetaminophen with milk replacer and assumes that the appearance of acetaminophen in blood is delayed by ruminal drinking (Herrli-Gygi et al., Reference Herrli-Gygi, Steiner, Doherr, Blum, Kirchhofer and Zanolari2008). In addition, it is assumed that acetaminophen cannot be absorbed from the rumen and abomasum, but is absorbed quickly from the proximal intestinal lumen. Although the mechanisms and sites of acetaminophen absorption are poorly documented, the delay in absorption (time to reach maximal concentration, T max) or the area under the plasma concentration curve (AUC) may relate to the RMV (Schaer et al., Reference Schaer, Herrli-Gygi, Kosmeas, Boschung and Steiner2005; Herrli-Gygi et al., Reference Herrli-Gygi, Steiner, Doherr, Blum, Kirchhofer and Zanolari2008). Imaging techniques of the digestive tract can also be used to quantify transit of digesta in the gastrointestinal tract. For instance, ultrasonography has been proposed as a method to identify ruminal drinkers (Braun and Gautschi, Reference Braun and Gautschi2013) and it offers the opportunity to measure abomasal milk volume (AMV) in calves (Wittek et al., Reference Wittek, Constable, Marshall and Crochik2005). This may allow quantification of RMV by subtracting the increase in AMV after feeding from total milk volume intake. Until now, studies that estimated AMV from ultrasonography have been conducted in calves younger than 50 days, whereas the age of veal calves in fattening stage may reach 240 days. It is currently not known if ultrasonography can also be used for measuring AMV accurately in heavy calves. In addition to these methods, the urinary recovery of a pulsed dose of a non-metabolizable monosaccharide could be used to quantify RMV. To account for differences in clearance time, 3-O-methylglucose, 3-O-MG; l-rhamnose,l-R; and d-xylose,d-X in milk replacer can be used as potential candidates. These monosaccharides are added to the milk replacer, absorbed by different pathways (Wijtten et al., Reference Wijtten, Verstijnen, van Kempen, Perdok, Gort and Verstegen2011) but not metabolized by the calf and thus excreted in the urine. Recovery of these monosaccharides in urine should therefore be close to 100% when milk replacer bypasses the rumen. Ruminal drinking, however, will result in microbial degradation of these monosaccharides in the rumen, thereby reducing urinary recovery. The objective of the current study was to evaluate these three indirect, repeatable methods to quantify RMV in veal calves, and to compare these methods to the direct method, that is, recovery of indigestible markers in the rumen at slaughter.
Material and methods
All procedures were in agreement with the Dutch Law on Experimental Animals, which complies with ETS123 (Council of Europe 1985 and the 86/609/EEC Directive) and were approved by the Animal Care and Use Committee of Wageningen University.
Experimental design
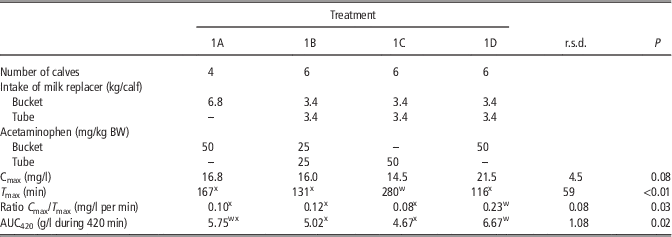
Three experiments were designed to evaluate indirect methods for measuring RMV in veal calves, and to compare the most promising indirect method with the direct method in which an indigestible marker added to the milk replacer is recovered in the rumen at slaughter. In Experiment 1, effects of induced ruminal milk on kinetic parameters of blood acetaminophen concentration were studied. Milk replacer was introduced in the rumen of calves (hereafter referred to as tube milk) or fed via a bucket (hereafter referred to as bucket milk), and kinetics of blood acetaminophen were assessed after tracing either the tube milk or the bucket milk, or both (Table 1). In Experiment 2, effects of an induced contrast in ruminal milk on changes in AMV (ultrasonography), abomasal emptying (acetaminophen absorption test) and urinary recovery of non-metabolizable monosaccharides in urine were studied (Table 2). Based on the results of Experiments 1 and 2, the most promising indirect method was selected and compared with the direct method of indigestible marker recovery in the calf’s rumen at slaughter (Suárez et al., Reference Suárez, Van Reenen, Stockhofe, Dijkstra and Gerrits2007), which is considered to be the ‘gold standard’, in Experiment 3.
Effect of route of administration (bucket v. intraruminal tube) of acetaminophen and milk replacer on kinetic parameters of plasma acetaminophen concentration in milk-fed calves (Experiment 1)

C max=maximum plasma acetaminophen concentration; T max=time to reach maximum plasma acetaminophen concentration; AUC420=area under the concentration curve between 0 and 420 min after feeding.
wxWithin each row means with different subscripts differ (P<0.05).
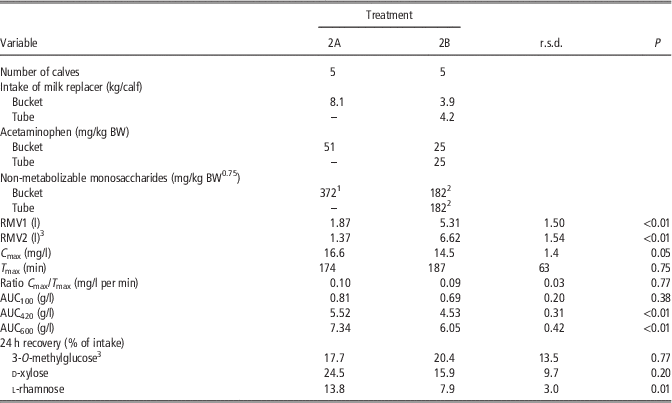
Effects of route of administration (bucket v. intraruminal tube) of milk replacer on ruminal milk volume, kinetic parameters of plasma acetaminophen concentration and recoveries of 3-O-methylglucose, d-xylose and l-rhamnose in 24-h urine of milk-fed calves (Experiment 2)
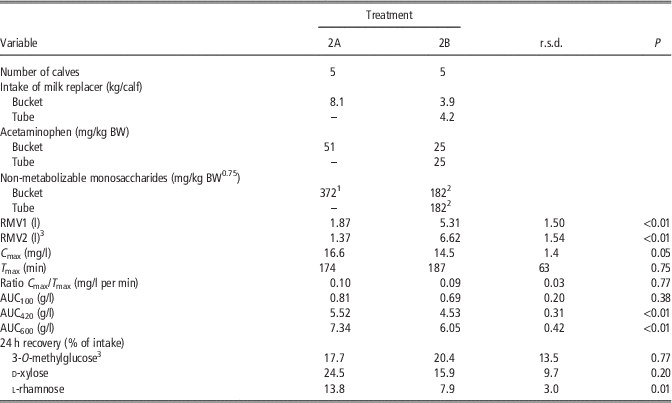
RMV1=ruminal milk volume estimated from the first measurement of abomasum volume by ultrasonography; RMV2=ruminal milk volume estimated from the kinetics of abomasum volume; C max=maximum plasma acetaminophen concentration; T max=time to reach maximum plasma acetaminophen concentration, AUC100 to 600=area under the curve of plasma acetaminophen concentration between 0 and 100, 420 or 600 min after feeding.
1 Composition: l-rhamnose, 59.4%; d-xylose, 28.2%; and 3-O-methylglucose, 12.4%.
2 Composition: l-rhamnose, 59.3%; d-xylose, 28.0%; and 3-O-methylglucose, 12.6%.
3 Data from one calf per treatment were missing for RMV2; data from one calf on treatment 2B were missing for 3-O-methylglucose recovery; see text for details.
Experiment 1
The objective was to determine the effects of induced ruminal milk on kinetics of plasma acetaminophen concentration when tracing either bucket milk, tube milk or both by acetaminophen (Table 1). Measurements were conducted in 24 calves (mean BW: 160.8±6.7 kg) housed individually and allocated to one of four dietary treatments. In treatment 1A, a whey-based milk replacer was provided in a bucket (without nipple), assuming that the vast majority of milk replacer from the bucket directly enters the abomasum. In treatments 1B, 1C and 1D, 50% of the milk replacer was provided via a bucket, and 50% was provided directly into the rumen of the calves via a tube that was inserted in the esophagus until the rumen (length of the tube: 150 cm), after the calf finished drinking milk replacer from the bucket. Acetaminophen (Sigma Aldrich, Zwijndrecht, The Netherlands, 50 mg/kg BW) was dissolved in boiling water and mixed with the milk replacer before feeding. It was offered with the bucket milk for treatments 1A and 1D, with the tube milk for treatment 1C, or divided equally over the bucket and the tube milk for treatment 1B (Table 1). The total amount of liquid milk replacer equaled 6.8 kg/calf, which was prepared by dissolving a standard commercial milk replacer in hot water at 65°C (147 g of powder/kg of liquid). It was offered to the calves at a temperature of about 42°C. Energy allowance was 850 kJ of digestible energy (DE)/kg BW0.75 per day. Calves were not offered solid feed during the experiment. Blood samples were taken by venipuncture from the jugular vein at 30 min before and at 30, 60, 90, 120, 150, 180, 300 and 420 min after feeding. Plasma was harvested and stored at −20°C. Two calves on treatment 1A were excluded because they showed clinical signs of ruminal drinking (clay-like feces and abdominal distension; Breukink et al., Reference Breukink, Wensing, van Weeren-Keverlink, van Bruinessen-Kapsenberg and de Visser1988), hence data from 22 calves were considered in the analyses.
Experiment 2
The objective was to determine the effects of induced ruminal milk on AMV estimated from ultrasonography, recovery of non-metabolizable monosaccharides (3-O-MG, l-R and d-X) in urine and kinetics of plasma acetaminophen. In addition, the predictive quality of these variables for RMV was evaluated through correlation analysis. Measurements were conducted in 10 calves (mean BW: 203±11 kg) that were housed individually in metabolic cages and allocated to one of two treatments. Calves received 100% of the milk replacer via a bucket without nipple (treatment 2A; five calves; Table 2) or 50% of the milk replacer via a bucket and 50% via a tube (treatment 2B; five calves). Acetaminophen (50 mg/kg BW) and monosaccharides (46 mg/kg BW0.75 of 3-O-MG, 103 mg/kg BW0.75 of d-X and 218 mg/kg BW0.75 of l-R) were dissolved in boiling water, mixed with the milk replacer before feeding, and offered to the calves via bucket and tube according to treatments. A catheter was inserted in the jugular vein to allow frequent blood sampling and the abdominal site (from the xiphoid process to the navel) was shaved to allow ultrasonography. The calves originated from another experiment, where they were fed 1064 kJ DE/kg BW0.75 per day, using two whey-based milk replacers differing in fat and lactose content. Calves were divided over treatments so that experimental diets were equally divided over treatments. The powder was dissolved in hot water at 65°C (174 g of powder/kg of liquid) and offered to the calves at a temperature of 43°C. Total liquid milk replacer allowance averaged 8.1 kg/calf. The calves had no access to solid feed during the experiment.
Blood samples were taken at 30 min before and at 30, 60, 90, 120, 150, 180, 300, 420 and 600 min after feeding via the jugular vein catheter. Plasma was harvested and stored at −20°C pending analysis. Width, height and length of the abomasum were measured by ultrasonography (3.5 MHz ultrasound linear transducer, MyLab 30; Pie Medical, Maastricht, The Netherlands) after local application of a gel to the skin of the abdominal site (from the xiphoid process to the navel; Wittek et al., Reference Wittek, Constable, Marshall and Crochik2005). Measurements were conducted three times during the 1st hour after feeding and once per hour during 3 subsequent hours. All dimensions were measured in duplicate for each timepoint. Urine was collected quantitatively for 24 h after feeding, weighed, sampled and stored at −20°C.
Experiment 3
The objective was to compare the most promising indirect method from Experiments 1 and 2 with the direct method, that is, indigestible marker recovery in the rumen at slaughter (Suárez et al., Reference Suárez, Van Reenen, Stockhofe, Dijkstra and Gerrits2007). From Experiments 1 and 2, ultrasonography was considered the best indirect method for estimating RMV (see Results section), and was therefore included in Experiment 3. The experiment included 16 calves that were housed individually in metabolic cages and allocated to one of four treatments (n=4 per treatment) for the meal preceding slaughter. In treatments 3A, 3C and 3D, calves received 100% of their milk replacer in a bucket without nipple (Table 3). In treatment 3B, calves received 75% of their milk replacer in a bucket without nipple and the remaining 25% was directly introduced into the rumen via a tube. In all treatments, calves received 36 g of Co-EDTA with the bucket milk. In addition, calves at treatment 3B received on average 821 g of Cr-EDTA solution (5 mg of Cr/g) with the tube milk. Calves on treatments 3A and 3B were slaughtered at 121 and 124 min after feeding, respectively, and calves on treatments 3C and 3D were slaughtered at 248 and 365 min after feeding, respectively. The calves were fed the same milk replacers that were used in Experiment 2. Milk replacer was offered to the calves at a concentration of 167 g of powder/kg of liquid at a temperature of 43°C so that the daily energy intake was 1064 kJ DE/kg BW0.75 (calves received 9.8 kg of liquid milk replacer on average). Calves had no access to solid feed during the experiment.
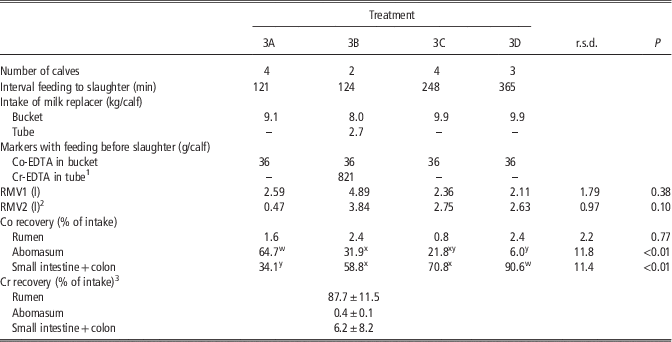
Effects of route of administration (bucket v. intraruminal tube) of milk replacer and indigestible markers (Co-EDTA and Cr-EDTA) and interval between feeding and slaughter on ruminal milk volume and marker recoveries in segments of the digestive tract of milk-fed calves (Experiment 3)
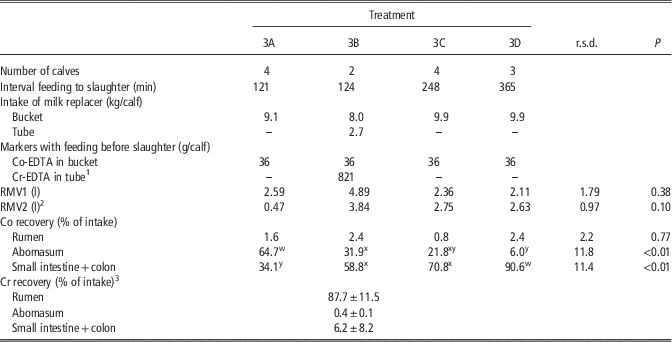
RMV1=ruminal milk volume estimated from the first measurement of abomasum volume by ultrasonography; RMV2=ruminal milk volume estimated from the kinetics of abomasum volume
wxyWithin each row means with different subscripts differ (P<0.05).
1 Solution of Cr-EDTA at 5 mg Cr/g.
2 Data from two calves on treatment 3A and one calf on treatments 3B and 3D were missing; see text for details.
3 Values are means±s.d. for two calves.
From feeding to slaughter, kinetics of abomasal sizes were determined by ultrasonography, with three measurements during the 1st hour after feeding and then once per hour until slaughter. After transportation (∼5 min), calves were euthanized by an i.v. injection of Na-pentobarbital and lifted by the forelegs (Suárez et al., Reference Suárez, Van Reenen, Stockhofe, Dijkstra and Gerrits2007). The digestive tract was divided into three compartments (forestomachs, abomasum and small intestine plus colon) that where closed using collars before removing the digestive tract from the body. The content of each compartment was collected quantitatively, weighed, homogenized, sampled and stored for laboratory analyses. Because three calves (two from treatment 3B and one from treatment 3D) refused to drink their milk replacer, measurements were conducted on 13 calves (mean BW: 237.7±24.1 kg; two to four calves per treatment; Table 3).
Chemical analyses
The density of each liquid milk replacer was measured and, for calculation of AMV, assumed to be similar in the abomasum. Plasma acetaminophen concentration was measured by colorimetry (kit K8002, Cambridge Life Sciences, Ely, Cambs, UK). The concentration of 3-O-MG, d-X and l-R in urine was determined by gas chromatography employing flame ionization for detection and d-glucoheptose as an internal standard (Jansen et al., Reference Jansen, Muskiet, Schierbeek, Berger and van der Slik1986). The dry matter in the digestive contents was determined according to standard methods (AOAC, 1990). The Cr and Co concentrations in the contents from each gastrointestinal compartment were measured by atomic spectroscopy after acid hydrolysis (Williams et al., Reference Williams, David and Lismaa1962).
Calculations
The AMV in the shape of an ellipsoid was calculated from the height, width and length of the abomasum as: height×width×length×π/6 (Wittek et al., Reference Wittek, Constable, Marshall and Crochik2005). Two calculations were used for estimating RMV. First, RMV was determined (RMV1) by the difference between the volume of milk replacer provided through the bucket and the first measurement of AMV after feeding (on average 16 and 12 min after feeding for Experiments 2 and 3, respectively). For tube-fed calves, the volume of milk replacer provided via the tube was added to RMV1. Second, the kinetics of AMV were fitted by a compartmental modeling to determine which proportion of the milk replacer provided via the bucket entered the rumen because of leakage during drinking. The model consisted of two compartments, representing rumen and abomasum. The model assumed that the rumen compartment was filled at feeding with all the milk replacer provided via the tube and a proportion (x) of the milk replacer provided via the bucket because of leakage during drinking. The rumen compartment then emptied into the abomasum at a constant fractional rate. The abomasum compartment was filled with a proportion (1−x) of milk replacer provided via the bucket that reached directly the abomasum through the esophageal groove plus the liquid originating from rumen emptying. The liquid in the abomasum then emptied at a constant fractional rate. Ordinary differential equations were solved using the package deSolve in the R software (Soetaert et al., Reference Soetaert, Petzoldt and Setzer2010) and parameters of the model (x: proportion of the milk replacer provided via the bucket that entered in the rumen owing to leakage during drinking and constant fractional emptying rates from the rumen and the abomasum) were estimated for each calf to minimize the sum of squared differences between actual and predicted AMV (Nelder and Mead, Reference Nelder and Mead1965). Volumes of the contents of the rumen and abomasum before feeding were based on volumes measured at slaughter in Experiment 3 and equaled 9300 and 100 ml, respectively for Experiment 2 and 10 000 and 100 ml, respectively, for Experiment 3. The RMV was then calculated (RMV2) as the sum of the milk replacer provided via the tube and the proportion of milk replacer provided via the bucket that leaked into the rumen (x). In Experiment 3, the AMV at slaughter (AMVs) was calculated as the last measurement of volume by ultrasonography before slaughter (AMV1) or by extrapolating the kinetics of AMV to the time of slaughter (AMV2). Because of insufficient number of successful measurements, parameters of the model could not be estimated on two and four calves in Experiments 2 and 3, respectively. In Experiment 3, abomasal volume at slaughter (AMV3) was also calculated from Co recovery in the abomasum, assuming that the concentration of Co in the milk replacer remained constant after feeding.
In Experiments 1 and 2, the increase in plasma acetaminophen concentration after feeding was calculated assuming that the baseline equaled the plasma acetaminophen concentration measured at 30 min before feeding. The urinary recovery of 3-O-MG, d-X and l-R was calculated as the proportion of monosaccharide intake that was excreted in urine during the 24-h collection period after feeding.
Statistics
Experiment 1
For each calf, kinetics of plasma acetaminophen concentration in time after feeding were described by a Michaelis–Menten model (Lopez et al., Reference Lopez, France, Gerrits, Dhanoa, Humphries and Dijkstra2000) using PROC NLIN of SAS (2004) with a scale parameter (a). The model estimated the maximal acetaminophen concentration (C max), the time at which C max was obtained (T max), the ratio between C max and T max and AUC until 420 min after feeding (AUC420):
 $${\rm Acetaminophen}\,{\rm concentration}={{C_{{\max }} {\times}T_{{\max }} } \over {a {\minus}1}}{\times}{{a {\times}{\rm time}^{{a {\minus}1}} } \over {{{T_{{\max }} ^{a} } \over {a {\minus}1}}{\plus}{\rm time}^{a } }}$$
The m.s. predictive error equaled 21% of the mean acetaminophen concentration. Parameters of the blood acetaminophen concentration response curve were analyzed for a treatment effect using PROC GLM of SAS (2004).
Experiment 2
Kinetics of plasma acetaminophen concentrations in time were analyzed using the model described for Experiment 1. The m.s. predictive error equaled 24% of the mean acetaminophen concentration. The AUC was calculated for 100, 420 and 600 min after feeding (AUC100, AUC420 and AUC600, respectively).
Data from kinetics of plasma acetaminophen concentration, RMV1, RMV2 and monosaccharide recoveries were analyzed for a treatment effect using PROC GLM of SAS (2004). In addition, a principal component analysis was performed using the package FactoMineR (Husson et al., Reference Husson, Josse and Lê2008), and including the data on kinetics of plasma acetaminophen concentration and monosaccharide recoveries, considering RMV1 and RMV2 as supplementary quantitative variables. A linear relationship between RMV1 or RMV2 and kinetic parameters of blood acetaminophen concentration and monosaccharide recoveries was tested using PROC GLM of SAS (2004).
Results
Experiment 1
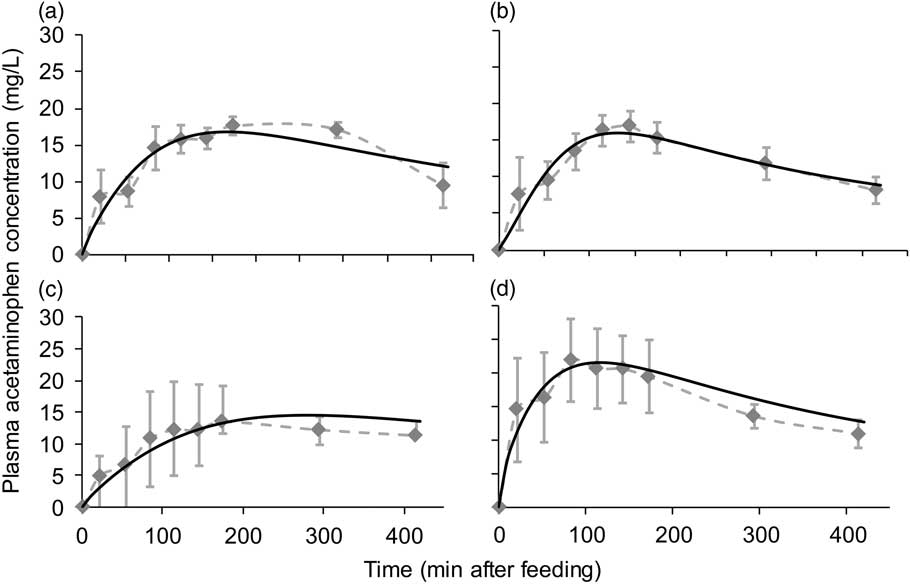
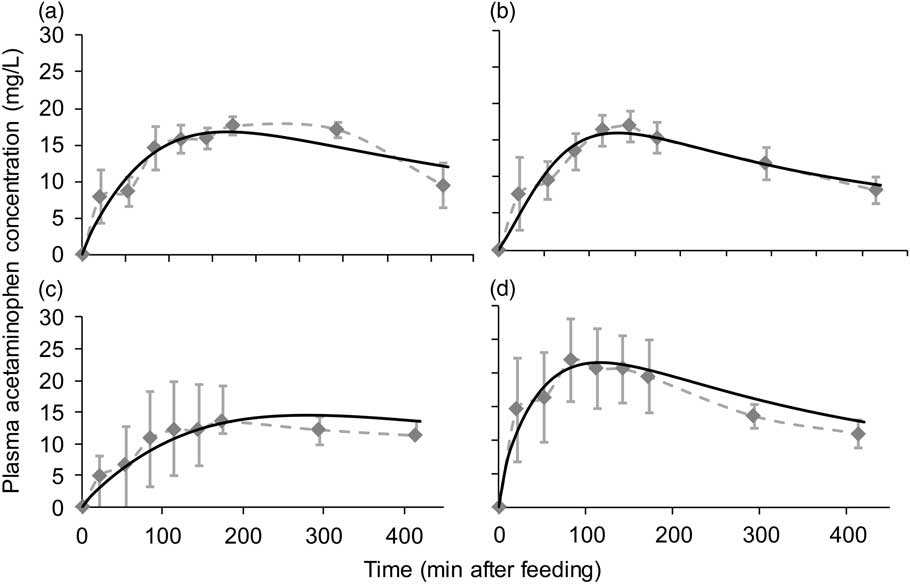
The increase in plasma acetaminophen concentration after acetaminophen intake is shown in Figure 1. The C max tended to be the lowest when acetaminophen was partly or totally fed with tube milk (treatments 1B and 1C; 15.3 mg/l on average) and the highest when acetaminophen was fed with bucket milk (21.5 mg/l; P=0.08; Table 1). Time to reach C max was affected by treatment (P<0.01) and was lowest when all acetaminophen was fed with half of the milk via the bucket (116 min; treatment 1D) and highest when all acetaminophen was fed with half of the milk via the tube (280 min; treatment 1C). The ratio between C max and T max is indicative for the slope of the ascending phase of the kinetics and gives indication of the rate of acetaminophen appearance. This ratio was higher (P=0.03) for treatment 1D than for the other treatments (0.23 v. 0.10 mg/l per minute on average for treatments 1A, 1B and 1C). The AUC420 increased (P=0.02) from 4.85 g/l on average for treatments 1B and 1C (all or half of the acetaminophen with half of the milk fed via the tube) to 6.67 g/l for treatment 1D (all the acetaminophen with half of the milk fed via the bucket).
Effect of route of administration (bucket v. intraruminal tube) of acetaminophen and milk replacer on kinetics of plasma acetaminophen concentration (Experiment 1). 1A: milk replacer and acetaminophen were provided via bucket; 1B: milk replacer and acetaminophen were equally provided via bucket and via tube; 1C: milk replacer was equally provided via bucket and via tube, acetaminophen was provided via tube; 1D: milk replacer was equally provided via bucket and via tube, acetaminophen was provided via bucket. Dotted line: mean measured plasma acetaminophen concentration per treatment (n=4 for treatment 1A and n=6 for treatments 1B, 1C and 1D). Solid line: predicted plasma acetaminophen concentration by the model of Lopez et al. (Reference Lopez, France, Gerrits, Dhanoa, Humphries and Dijkstra2000) using mean parameters per treatments (see Table 1 for details).
Experiment 2
Estimated RMV1 (from the first ultrasonography measurement of abomasal volume) increased from 1.87 to 5.31 l (P<0.01; treatments 2A and 2B, respectively; Table 2), whereas estimated RMV2 (from mathematical modeling of the kinetics of abomasal volume after feeding) increased from 1.37 to 6.62 l (P<0.01; treatments 2A and 2B, respectively) when ruminal drinking was simulated by tube feeding. The modified Michaelis–Menten equation used to model the increase in plasma acetaminophen concentration after feeding indicated a decrease in C max when RMV increased (P=0.05), but the T max and the ratio C max/T max did not differ between treatments. The AUC did not differ between treatments from 0 to 100 min after feeding but it was 18% lower in treatment 2B than in treatment 2A (P<0.01) when the integral duration equaled 420 or 600 min. The average 24-h recoveries of non-metabolizable monosaccharides (3-O-MG, d-X and l-R) did not exceed 25% of intake. The 24-h recoveries of 3-O-MG and d-X were not affected by treatment, whereas the 24-h recovery of l-R decreased when ruminal drinking was simulated by tube feeding (7.9% v. 13.8%, respectively; P=0.01).
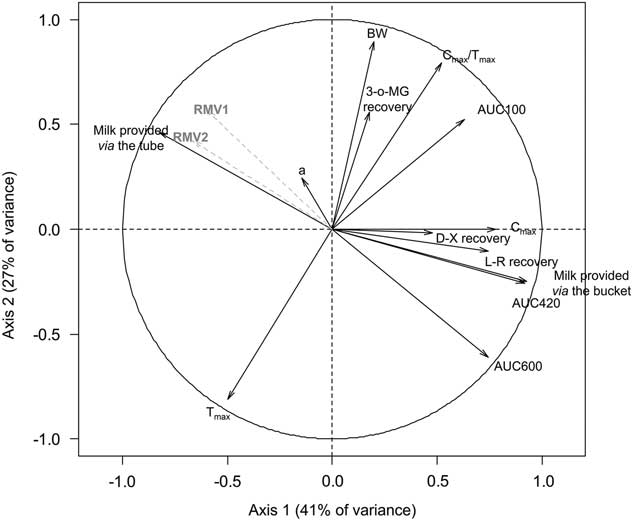
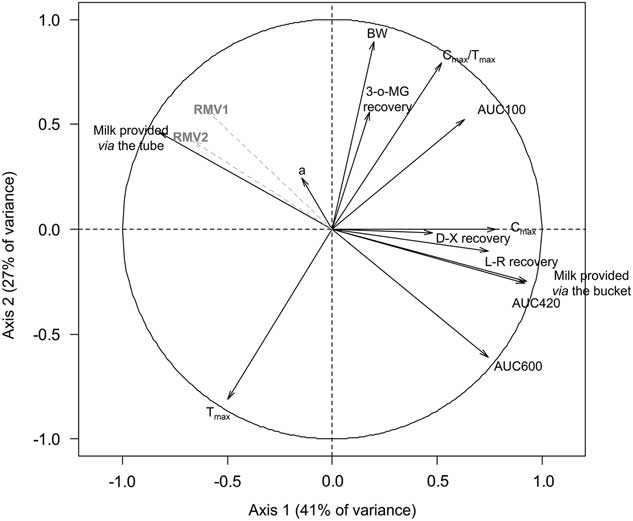
Data from individual calves in Experiment 2 were also included in a principal component analysis (Figure 2), in which the first and the second principal components of the analysis explained 41% and 27% of total variation, respectively. In accordance with the experimental design, the first axis of the analysis was positively correlated with the volume of milk provided via the bucket (R=0.93) and negatively correlated with the volume of milk provided via the tube (R=−0.83). In addition, the first axis was correlated (P<0.05) with AUC420 (R=0.92), C max (R=0.78), l-R recovery (R=0.75), AUC600 (R=0.75) and RMV2 (R=−0.67). Furthermore, the first axis tended to be correlated with RMV1 (R=−0.60; P=0.07). The second axis was correlated (P<0.05) with BW (R=0.89), the ratio C max/T max (R=0.79) and T max (R=−0.81). The results of the principal component analysis were used to select possible candidates for predicting RMV1 and RMV2. The slopes of the relationships between RMV1 or RMV2 and AUC420, AUC600 or l-R recovery were all negative (Table 4), whereas the slopes of the relationship between RMV1 or RMV2 and C max did not significantly differ from 0 (data not shown). Based on the residual standard deviation, the correlation of RMV1 was better than the correlation of RMV2, irrespective of the predictor. The best predictor for RMV1 or RMV2 was AUC600, which resulted in the lowest residual standard deviation (1.83 and 1.88 l for prediction of RMV1 and RMV2, respectively).
Principal component analysis between BW, volume of milk replacer provided via the bucket or the tube, estimated ruminal milk volume (RMV1 and RMV2; see text for details), 3-O-methylglucose (3-O-MG), d-xylose (d-X) and l-rhamnose (l-R) recoveries in urine and kinetics of blood acetaminophen concentration in milk-fed calves. a=scale parameter; C max=maximal plasma acetaminophen concentration; T max=time to reach C max; AUC100 to 600=area under the curve of plasma acetaminophen concentration between 0 and 100 to 600 min after feeding; Experiment 2.
Linear relationships between parameters of the plasma acetaminophen response curve and l-rhamnose recovery in urine with ruminal milk volume in milk-fed calves (Experiment 2; eight calves)

RMV1=ruminal milk volume estimated from the first measurement of abomasum volume by ultrasonography (l); RMV2=ruminal milk volume estimated from the kinetics of abomasum volume (l); AUC420 to 600=area under the curve of plasma acetaminophen concentration between 0 and 420 or 600 min after feeding (mg/l).
1 The intercept and slope of each equation were tested for their difference with 0: † P<0.10; *P<0.05; **P<0.01.
Experiment 3
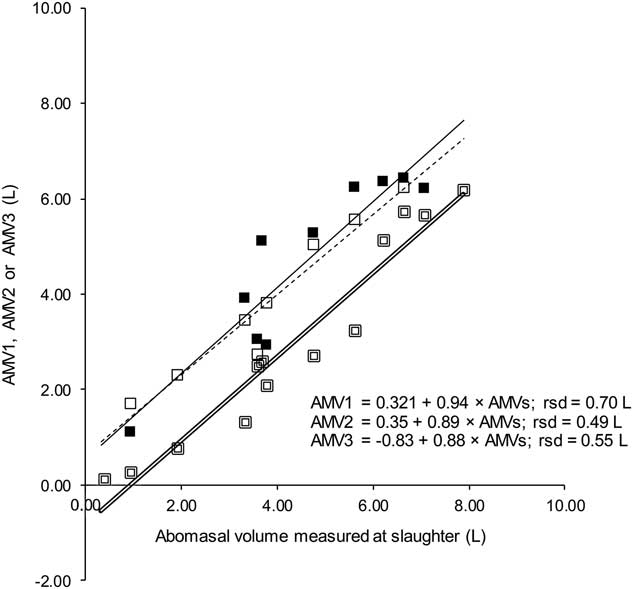
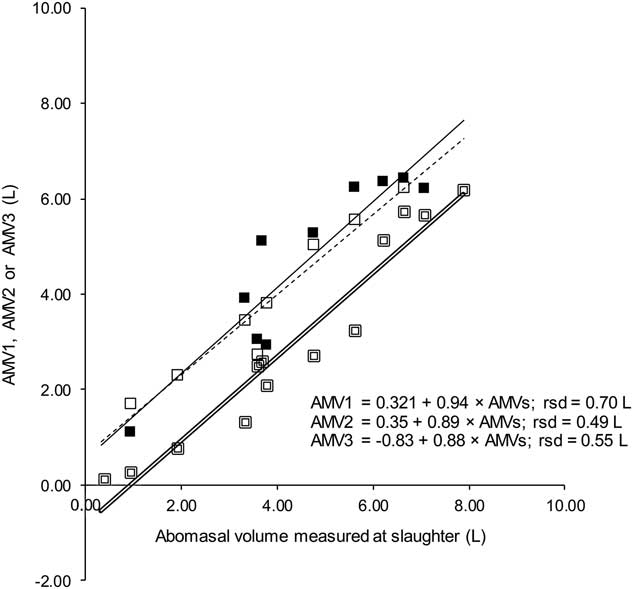
The volume of milk that entered the rumen did not differ between treatments and averaged 2762 ml when calculated from the first ultrasonography measurement (RMV1) and 2337 ml when calculated from extrapolation of mathematical modeling of the kinetics of AMV (RMV2; Table 3). When Co-EDTA was added to the milk offered to the calves via the bucket during the last meal before slaughter, Co recovery in the abomasum was highest at 121 min after feeding (treatment 3A; 64.7% of intake; Table 3) and lowest at 365 min after feeding (treatment 3D; 6.0% of intake; P<0.01). In the rumen, Co recovery did not differ between treatments and showed large variations. In the small intestine and colon, the Co recovery increased from 34.1% (treatment 3A) to 90.6% (treatment 3D). In two calves, Cr recovery was measured after administrating Cr-EDTA into the rumen (treatment 3B). At slaughter (124 min after feeding), 87.7% of Cr intake was recovered in the rumen, and 0.4% and 6.2% of Cr intake was recovered in the abomasum and the small intestine plus colon, respectively (Table 3). The AMV estimated from ultrasonography measurements (AMV1 and AMV2) were regressed against abomasal volume measured at slaughter (AMVs, Figure 3). The intercept and the slope of the linear relationships between AMV1 or AMV2 and AMVs did not significantly differ from zero and unity, respectively. However, the intercept of the linear relationship between AMV3 and AMVs was significantly lower than zero (P=0.03) and the slope of the relationship tended to differ from unity (P=0.10). The residual standard deviation for the relationships between AMVs and AMV1, AMV2 or AMV3 equaled 608, 442 or 551 ml, respectively.
Relationship between abomasal milk volume estimated from ultrasonography (AMV1: ■ and AMV2: □; eight calves) or from indigestible marker recovery (AMV3: – 13 calves; see text for details) and abomasal milk volume measured at slaughter (AMVs; Experiment 3) in milk-fed calves. Solid line: linear relationship between AMV1 and AMVs. Dotted line: linear relationship between AMV2 and AMVs. Double line: linear relationship between AMV3 and AMVs: the intercept differed from zero (P=0.03) and slope tended to differ from unity (P=0.10).
Discussion
The aim of this study was to propose a method to quantify RMV in calves, which is defined as the volume of milk that enters the rumen because of leakage of milk during drinking or because of backflow of milk from the abomasum. In veal calves that received large amounts of milk, individual values may account for more than 25% of intake in subclinical cases (Suárez et al., Reference Suárez, Van Reenen, Stockhofe, Dijkstra and Gerrits2007; Berends et al., Reference Berends, Van Reenen, Stockhofe-Zurwieden and Gerrits2012), which induces reduced growth performances and ruminal and metabolic acidosis in clinical cases (Gentile et al., Reference Gentile, Sconza, Lorenz, Rademacher, Famigli-Bergamini and Klee2004; Herrli-Gygi et al., Reference Herrli-Gygi, Hammon, Zbinden, Steiner and Blum2006). Identification of clinical ruminal drinkers can be achieved through the occurrence of reduced appetite and clay-like feces (Breukink et al., Reference Breukink, Wensing, van Weeren-Keverlink, van Bruinessen-Kapsenberg and de Visser1988) but the latter indicators do not give any information regarding the amount of milk that enters the rumen. Nevertheless, both in clinical and subclinical cases, nutrients from milk are subject to ruminal fermentation and are metabolized in and absorbed from the rumen instead of being absorbed from the intestinal lumen, which decreases utilization of nutrients for growth (Herrli-Gygi et al., Reference Herrli-Gygi, Hammon, Zbinden, Steiner and Blum2006). Accordingly, the effects of ruminal drinking on metabolism of calves can vary depending on the proportion of ruminal milk, which was highly variable in our study (Tables 2 and 3). A repeatable and non-invasive quantification of RMV is then required to explain variation between animals in metabolic studies, or to validate methods to reduce ruminal drinking.
Ultrasonography as a tool to quantify RMV
In this paper, we propose to calculate RMV as the difference between milk intake and volume of milk that is recovered in the abomasum after drinking. This method allows calculating the leakage of milk during drinking but does not account for the backflow of milk from the abomasum after feeding, at least with RMV1. Nevertheless, no evidence of backflow has been reported in calves (Guilhermet et al., Reference Guilhermet, Mathieu and Toullec1975) and the occurrence of milk in the rumen can be largely attributed to malfunction of the esophageal groove. Ultrasonography offers the opportunity to measure AMV, assuming that the filled abomasum takes the shape of an ellipsoid (Wittek et al., Reference Wittek, Constable, Marshall and Crochik2005). A good estimation of milk leakage during drinking then requires the measurement of AMV shortly after feeding (<3 min post-prandial; Wittek et al., Reference Wittek, Constable, Marshall and Crochik2005) because 30% of ingested liquid may have already be emptied from the abomasum during the first 30 min after feeding (measured as duodenal appearance of liquid 30 min after feeding; Toullec et al., Reference Toullec, Thivend and Mathieu1971). This appears difficult to realize because ultrasonography needs physical restriction of the calf and local application of an ultrasonography gel, which cannot be performed before or during drinking because this may affect the behavior of the calf, cause stress and increase the amount of ruminal milk (Herrli-Gygi et al., Reference Herrli-Gygi, Steiner, Doherr, Blum, Kirchhofer and Zanolari2008). Therefore, we propose to measure the kinetics of AMV after feeding and to predict changes in AMV during and just after drinking by mathematical modeling. Mathematical models were previously proposed to describe AMV kinetics in calves (Wittek et al., Reference Wittek, Constable, Marshall and Crochik2005), but they assumed that AMV does not increase after feeding, whereas ruminal drinking can lead to an increase in AMV after feeding, when the ruminal milk empties into the abomasum. We used a two-compartment mathematical model for describing the kinetic patterns of AMV and for extrapolating this to AMV at feeding or at slaughter. The comparison of extrapolated abomasal volume (AMV2) to abomasal volume measured at slaughter (AMVs) indicates that the use of the mathematical model improves the prediction of AMVs by reducing the prediction error from 0.70 to 0.49 l (Figure 3). Moreover, AMVs was calculated by weighing the abomasum contents and assuming that its density equals the density of ingested milk. Nevertheless, abomasal volume calculated from indigestible marker recovery (AMV3) was always lower than AMVs (Figure 3), which may be explained by dilution of milk in the abomasum with abomasal secretions (Toullec et al., Reference Toullec, Thivend and Mathieu1971). To account for this dilution, pre-prandial AMV in the mathematical model was fixed at 100 ml because this value was in line with AMV measured in the third experiment at 6 h after feeding and in accordance with previously reported data (from 20 to 137 ml; Wittek et al., Reference Wittek, Constable, Marshall and Crochik2005), but which might be underestimated when calves receive large amounts of solid feed, that increase the flow of digesta from the rumen to the abomasum. Nevertheless, the relationship between measured AMVs and predicted AMV2 indicates that the use of ultrasonography and mathematical modeling of kinetics of AMV gives a reliable estimate of AMV to calculate RMV. Using this technique, RMV averaged 16 (from 0% to 33%) and 21% (from 0% to 39%) of intake for bucket-fed calves in Experiments 2 and 3, respectively, which was in the lower range of values previously reported (more than 25%; Suárez et al., Reference Suárez, Van Reenen, Stockhofe, Dijkstra and Gerrits2007; Berends et al., Reference Berends, Van Reenen, Stockhofe-Zurwieden and Gerrits2012).
Acetaminophen and non-metabolizable monosaccharides to quantify RMV
In this study, we also considered the use of metabolic tracers (acetaminophen and non-metabolizable monosaccharides) as potential candidates for quantifying RMV. In these methods it is assumed that the transient retention of milk in the rumen increases the delay between intake and intestinal absorption of nutrients. In addition, it is assumed that metabolism of monosaccharides by microbes of the rumen decreases their recovery in urine. From the principal component analysis, AUC420, AUC600 and l-R recovery were identified as the best predictors for RMV. The negative slope of the predictive linear relationships (Table 4) confirms that an increase in AUC420, AUC600 or l-R recovery is associated with a decrease in RMV, which agrees with our hypothesis. Nevertheless, the residual standard deviation of the predictive mathematical relationships, which was higher than 1.8 l (Table 4), was similar to the average RMV in case of natural ruminal drinking (i.e. values measured in calves from treatment 2A; Table 2). In addition, T max in calves that received acetaminophen via the intraruminal tube (treatment 1C; 280 min after feeding) was higher than T max in calves that were partly or totally bucket fed, but the values were in accordance with bibliographic data (Schaer et al., Reference Schaer, Herrli-Gygi, Kosmeas, Boschung and Steiner2005; Herrli-Gygi et al., Reference Herrli-Gygi, Steiner, Doherr, Blum, Kirchhofer and Zanolari2008). However, T max of bucket-fed calves did not differ from T max of calves where milk and acetaminophen were equally spread between bucket feeding and tube feeding. This may indicate limitations in the sensitivity of the acetaminophen test, possibly caused by absorption of acetaminophen from gastric compartments or by natural occurrence of ruminal drinking in bucket-fed calves (20% of milk intake, from calves on treatment 2A in Experiment 2). Moreover, plasma acetaminophen concentrations at the end of the measurements (420 and 600 min after feeding in Experiments 1 and 2, respectively) had not returned to pre-prandial levels (Figure 1), suggesting that predictive relationships may be further improved by increasing the time span of blood sampling. Nevertheless, our study confirms the potential of using blood parameters related to acetaminophen absorption (T max, ratio C max/T max and AUC) to identify ruminal drinking in calves (Schaer et al., Reference Schaer, Herrli-Gygi, Kosmeas, Boschung and Steiner2005; Herrli-Gygi et al., Reference Herrli-Gygi, Steiner, Doherr, Blum, Kirchhofer and Zanolari2008).
Non-metabolizable monosaccharides were used in Experiment 2 to quantify RMV, assuming that they are quantitatively and totally recovered in 24-h urine, when not subjected to fermentation in the rumen. Nevertheless, we found low recoveries of monosaccharides in urine (<25% of intake; Table 2). These values were lower than recovery of d-X in urine from veal calves during the first 6 post-prandial hours only (26% of intake; Lallès et al., Reference Lallès, Toullec, Pardal and Sissons1995). These recoveries question the completeness of digestive absorption and urinary excretion of monosaccharides (Bjarnason et al., Reference Bjarnason, Macpherson and Hollander1995). In addition, dehydration associated with ruminal drinking (Herrli-Gygi et al., Reference Herrli-Gygi, Steiner, Doherr, Blum, Kirchhofer and Zanolari2008) may decrease the volume of urine, inducing irregular emptying of the bladder. An increase in time of urine collection or the use of a urinary catheter in the bladder may increase the accuracy of predictive relationships between urinary recoveries of non-metabolizable monosaccharides and RMV. In our study, urinary recovery of actively absorbed monosaccharides (3-O-MG and d-X) was not affected by the intraruminal infusion of tracers, whereas urinary recovery of passively absorbed l-R was decreased when it was introduced into the rumen. These results suggest that absorption of 3-O-MG and d-X through the ruminal wall may occur (Aschenbach et al., Reference Aschenbach, Bhatia, Pfannkuche and Gäbel2000) whereas l-R could be more sensitive to ruminal degradation.
Estimates of RMV in heavy calves
In the third experiment, estimates of Co recovery in the rumen contents when Co-EDTA was added as an indigestible marker to the milk fed through the bucket, varied between 0% to 6.1% of intake (mean: 1.8% of intake; Table 3). These values were lower than those previously reported for veal calves that received large amounts of solid feed (from 13% to 25% of intake; Suárez et al., Reference Suárez, Van Reenen, Stockhofe, Dijkstra and Gerrits2007; Berends et al., Reference Berends, Van Reenen, Stockhofe-Zurwieden and Gerrits2012). In our study, calves receiving Co were slaughtered more than 2 h after feeding allowing liquid to leave the rumen. This indicates that milk leakage while drinking might have been higher. Indeed, results from the two calves that were tube fed with Cr as an indigestible marker indicate that only 88% of the milk introduced into the rumen via the tube remained in the rumen 2 h after administration, which corresponds to a rumen emptying rate of liquids of 6.2%/h. Using this passage rate of milk from the rumen and assuming that it is constant after feeding, RMV at the time of feeding would vary between 0% and 9% of intake (2% on average). Nevertheless, it should be noted that this value for emptying rate of milk from the rumen was obtained with only two calves in particular feeding conditions because of tube feeding. This value is lower than emptying rates reported for dairy cows (from 6.4% to 20.6%/h; Seo et al., Reference Seo, Lanzas, Tedeschi and Fox2007), whereas no indication for rumen emptying and rumen motility has been previously reported for veal calves. Consequently, the utilization of Co recovery in the rumen at slaughter would underestimate RMV. Calculated from ultrasonography measurements, RMV in Experiments 2 and 3 were higher (20% of intake on average).
Conclusions
Plasma acetaminophen kinetics and recovery of non-metabolizable monosaccharides in urine were weakly associated with ruminal drinking, but these techniques cannot be used to quantify RMV. Ultrasonography allowed accurate measurements of changes in AMV in response to feeding in veal calves. Leakage of milk into the rumen can then be estimated by subtracting the change in AMV from total milk intake. The accuracy of the AMV measurement, and thus the estimated RMV, was improved when kinetics of abomasal volume after feeding were extrapolated to the time of slaughter by mathematical modeling. With this technique, the volume of milk that leaked into the rumen during feeding averaged 20% in heavy veal calves. The recovery of an indigestible marker in milk measured in the rumen at slaughter gave a quantitative estimate of RMV (2% in Experiment 3), but improper measurement of emptying rate of fluid from the rumen may lead to underestimation. In conclusion, measuring changes in AMV by ultrasonography in response to feeding was the most promising indirect method to quantify RMV in veal calves.
Acknowledgments
The authors thank Laurie Poussier, Laure Hygonnet, Sven Alferink and the staff members of the experimental facilities at Wageningen University and VanDrie Group for their assistance. The authors acknowledge Walter Grünberg (Department of Farm Animal Health, Utrecht University) and Norbert Stockhofe (Central Veterinary Institute, Lelystad) for their help in designing the experiments. The experiments were done during the stay of E. Labussière at Wageningen University and Research Center, which was founded by a scholarship from the Wageningen Institute of Animal Sciences (WIAS).