Despite economic decentralization, political authority in China remains highly centralized. Leaders in Beijing use political incentives to achieve local compliance with their ruling strategy and specific policies. The core of political centralization lies in the Chinese Communist Party's (CCP) monopoly of authority over the management of political and economic elites at all government levels. The personnel system determines the distribution of power in this one-party state, and scholars argue that it serves as an effective mechanism to align local leaders' incentives with the preferences of top Party leaders.Footnote 1
What determines political promotion is a fundamental question in Chinese politics, the answer to which improves our understanding of the distribution of power and the behaviour of political elites. In the Qing Dynasty (1644–1912), the amount of revenue collected and turned over to the central authorities was an important determinant of the career advancement of local leaders.Footnote 2 In contemporary China, qualitative evidence derived from case studies at the county level or below suggests that recruitment to the Party is driven primarily by informal politics.Footnote 3 Large-N statistical analysis that mostly focuses on provincial leaders and above indicates that economic and fiscal performance enhances the promotional prospects of local leaders.Footnote 4 On the other hand, using sophisticated econometric methods, scholars find that factional ties, rather than work performance, determine the political fates of leaders at the provincial level and above.Footnote 5
Not much attention has been given to municipal leaders until recently.Footnote 6 As the highest level of local authority not under the direct control of central authorities, municipal governments have substantial autonomy and authority in spending, policymaking and implementation, and they are crucial players in urban governance. Existing research shows that mayors under the leadership of Jiang Zemin 江泽民 were rewarded with political advancement for extraordinary economic performance, but not demoted for poor economic performance.Footnote 7 This article focuses on city leaders under the Hu–Wen administration, a period when the Party sought to strike more of a balance between economic growth and development in social policy areas, especially those policy areas that have little short-term positive effect on economic growth, such as education and health. This analysis investigates the criteria by which municipal leaders are evaluated and promoted, and presents the structure of political incentives at the municipal level. If the personnel institution is a political incentive mechanism that reflects Party preferences and transmits priorities from higher levels to local agents, we should see an adaptation in local personnel institutions as the centre's priorities shift. In addition, I propose examining Party leaders and government executives separately. Divisions of labour and “mechanical” differences (in promotion possibilities) between mayors and city Party secretaries can lead to the Party rewarding them according to different criteria. This analysis finds that the political incentive structure is indeed different for Party leaders and government executives at the municipal level.
I present three findings. First, local elites adapt local personnel management institutions to reflect Beijing's new attention to social policy areas. Second, different political incentives operate for municipal Party leaders and mayors: for municipal Party secretaries, personal connections with provincial leaders and better economic performance (of the province where the city is located) enhance their promotional prospects; for mayors, age, city status, and performance in social policy areas are determinants of their political advancement. Third, the political incentives to develop social policy areas vary across geographic regions: more political incentives are instituted in places with an already higher social welfare level.
My research draws on content analyses, qualitative interviews and large-N statistical analysis. I collected and analysed 69 local evaluation regulations for CCP and government officials, whom I call cadres in this paper.Footnote 8 Between 2011 and 2013, I conducted semi-structured interviews with 51 cadres and 43 other informants. The statistical analysis uses systematic data on municipal Party secretaries and mayors between 2003 and 2010, which I compiled from an online archive and which contains city leaders' biographical information and career histories.
This article begins with a brief discussion of Beijing's change in priorities. It continues with an analysis of the personnel institutions that shape the political incentive structure, paying particular attention to recent changes to formal cadre evaluation rules. It then further explores the political incentive structure by systematically investigating the determinants of political promotion for municipal Party secretaries and mayors. It closes with a discussion of the results and conclusion.
Priority Change in Beijing
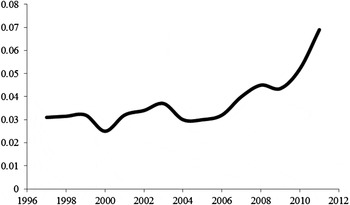
Departing from the emphasis on all-out economic growth that characterized the Jiang era, the Hu–Wen leadership focused its policy priorities on creating a balance between economic development and improving social policy areas. This shift in the Party's priority was signalled by President Hu Jintao's 胡锦涛 “Scientific development theory.” The main components of this guiding Party ideology include sustainable development, social welfare expansion and the creation of a “people-oriented” harmonious society. For the first time since the 1980s, social welfare (minsheng 民生) was upgraded to a goal as important as economic growth. In this article, social welfare is understood, in a broad sense, to cover a range of social policy areas such as, for example, education, healthcare, pensions and subsidized housing. In addition, the Party set a target to achieve a “well-off society” by 2020. The criteria for a “well-off society” include not only economic targets but also a large number of social targets.Footnote 9 Beijing's new focus on social policy areas is not just empty rhetoric. For example, as shown in Figure 1, in the last decade, government expenditure on education and healthcare has risen. In addition, the central government has embarked on a series of reforms to mitigate deepening social tensions, including the establishment of a free nine-year compulsory education system and health insurance schemes to cover 95 per cent of the total population and 98 per cent of eligible rural residents.
Ratio of Central Government Spending on Social Policies to Total Central Government Spending

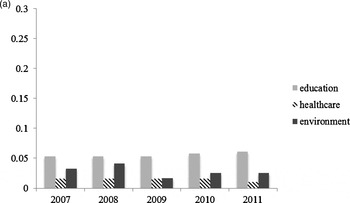
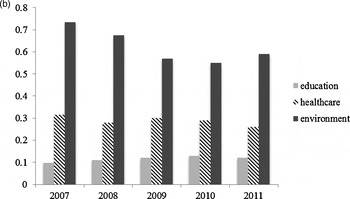
Despite political centralization, post-1994 China can justifiably be classed as one of the most fiscally decentralized countries in the world, with local authorities spending 70 per cent of all government expenditures.Footnote 10 As shown in Figure 2, over the past two decades, spending on some social policy areas remains decentralized and rests mainly at subnational government levels. In order to correct local governance failures in some social policy arenas such as environmental degradation, the CCP has revised its cadre management system.
Ratio of Central Government Spending on Social Policies to Total Government Spending on Social Policies: Education, Healthcare and the Environment

Ratio of Central Transfers to Total Government Spending on Social Policies: Education, Healthcare and the Environment

Personnel Reforms for Better Governance
Through the nomenklatura, or cadre management system, the CCP exercises ultimate authority over the appointment, promotion, transfer and dismissal of cadres.Footnote 11 Based on the system in the Soviet Union, the nomenklatura is a list of politically important positions controlled by the Party. By directing the allocation of rewards, including political advancement, the personnel institution serves as a political incentive mechanism and transmits priorities from the top down. Since the end of the Mao era, the CCP has prioritized economic development over political campaigns, and the cadre management system has likewise undergone a gradual institutionalization. The cadre evaluation system (ganbu kaohe zhi 干部考核制) is no longer based on a subjective evaluation of political loyalty but is now determined by quantifiable indicators of actual work achievements.Footnote 12
By early 2000, the CCP had formalized the management of cadres, including cadre evaluation, in all Party and government organs at all levels.Footnote 13 Party standing committees, the 11 to 13 most powerful leaders at each administrative level, hold the ultimate authority over the management of leaders one level down. Party organization departments are in charge of appraising Party secretaries and government executives. In addition to some age, education and work experience requirements, the appointment, promotion, transfer and dismissal of local leaders is based, in principle at least, on their evaluated performance along five dimensions: virtue (de 德), competence (neng 能), diligence (qin 勤), achievements (ji 绩), and absence of venality (lian 廉), with an emphasis on actual work achievements. The evaluation is carried out by the assessment group in five main ways. First, there is a “democratic” appraisal meeting (minzhu ceping 民主测评), where leading cadres from other Party and state institutions, such as the local Party congress and court, the immediate subordinate Party branch and government, gather to rate local leaders' work performance on a scale from excellent to poor along the above five dimensions. Second, one-on-one talks are held with co-workers (gebie tanhua 个别谈话). Third, a survey of popular opinion (minyi diaocha 民意调查) is gathered from representatives of the local Party congress, local people's congress and local people's political consultative conference, and ordinary citizens regarding their satisfaction with local leaders' work style, responsibility fulfilment and public image. Fourth, the cadres are appraised by their superiors (shangji pingjia 上级评价), and fifth, an assessment of actual work achievements (shiji fenxi 实绩分析) is conducted, which is primarily based on scores reflecting the meeting of concrete targets.Footnote 14 The last method is also termed the target responsibility system (TRS), where weight is assigned to performance targets, and local leaders are rewarded or punished based on the fulfilment of the targets set down in the performance contracts agreed with their superiors.Footnote 15 The TRS has been gradually adopted by county- and township-level governments since the mid-1980s. Governments at the municipal level and above started implementing the TRS after 2005.
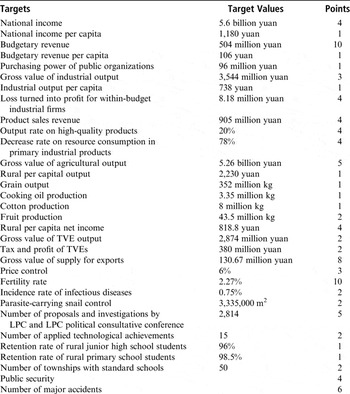
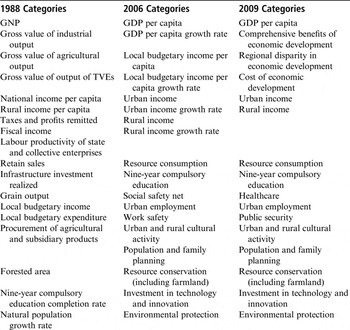
Performance targets are divided into three categories according to their importance: soft targets, hard targets and imperative targets (yipiao foujue zhibiao 一票否决指标). Failure to meet imperative targets cancels out all achievements in meeting other targets and downgrades local leaders to the “incompetent” category.Footnote 16 Well-established imperative targets include population planning and social order. The violation of birth quotas or occurrences of large-scale protests often results in penalties such as the loss of bonuses, fines or demotions. The target indicators, target values and points are determined by local leaders under the guidelines passed down from higher levels. Although little is known about the process of such decision making, existing research finds a general bias towards economic performance: many more points are assigned to economic development targets relative to other targets, such as social welfare.Footnote 17 For example, as shown in Table 1, in 1991 over half of the total points available in the assessments of leaders in city A were assigned to economic-related targets. Local leaders at the same administrative level are ranked on the basis of the final evaluation results. Top-ranking leaders are rewarded with financial bonuses, official praise and promotions; low-ranking leaders are punished with official disgrace, budget reductions or demotions. Officials have gone so far as to commit crimes in order to avoid a low ranking during cadre evaluation.Footnote 18
Target Performance Evaluation Form for Leaders of City A in 1991

Source:
Internal municipal government document provided to author during fieldwork.
Notes:
Please refer to Zhongguo tongji 1985 for why the value of national income is always lower than the gross value of agricultural and industrial output. Fertility rate is defined as the annual ratio of birth population to total population. For public security and major accidents, the data reflected in the score for 1991 are not available.
As part of the endeavour to institutionalize the cadre management system in the mid-1980s, the TRS is seen as an effective and flexible instrument to ensure that the political orientation of local leaders responds to the changing needs of the CCP.Footnote 19 An official from the Central Organization Department described the role of the cadre evaluation rules: “The result of the cadre evaluation is not the sole criterion in cadre promotion. Yet, cadre evaluation rules are very important because they play a role of signalling and orienting. They convey information about what higher-level authorities value.”Footnote 20
It is accepted that the TRS strengthens state capacity to monitor and control local agents.Footnote 21 At the same time, the use of the TRS to encourage economic growth since the mid-1980s has created an overwhelming focus on the economy at the local level. Based on the evaluation of township-level leaders, scholars have found that the long-term bias towards economic development in the TRS produces and prolongs a neglect of some politically significant issues at the subnational level, such as work safety issues, which poses increasing challenges for top leaders in Beijing.
The adaptation of cadre evaluation rules
Mirroring the shift in priorities under the Hu–Wen leadership, post-2006 cadre evaluation metrics have become less oriented towards economic growth. Since 2004, Party organization departments have, in several provinces, initiated cadre evaluation that mirrors the new Party ideology.Footnote 22 In 2006, for the first time, the Party promulgated special regulations for the evaluation of above-county leaders in order to reflect the “scientific development” theory better. As shown in Table 2, the new national guidelines (for the performance targets of local leaders under the TRS) incorporate more welfare-related indicators than previous guidelines. They also formalize the method and process of evaluation of local leaders at the county level and above, and emphasize a stronger linkage between evaluation results and political leaders' actual career advancement.Footnote 23 Local authorities are encouraged to make specific requirements in target indicators, formulas and scoring schemes, and to use evaluation results for cadres one level down.
National Guidelines for Performance Targets for Local Party and State Leaders

Source:
Whiting Reference Whiting2006, 103; Central Organization Department Reference Department2006; Central Organization Department Reference Department2009b.
Note:
Each 1988 category was assessed for both level and growth rate. The 1988 guideline was applied to the evaluation of leading cadres at the county level, while the 2006 and 2009 guidelines were applied to the evaluation of leading cadres at and above the county level.
Drawing upon available local regulations collected in the field and through archival research, my sample contains post-2006 evaluation rules from 19 provinces (out of 31 provincial units).Footnote 24 Specifically, it includes 69 evaluation regulations: ten for township leaders in ten counties, 46 for county leaders in 41 municipalities, and 13 for municipal leaders in 11 provinces. These 69 regulations constitute an admittedly limited sample of the universe of cadre evaluation rules. Still, in view of the non-transparent nature of elite politics in China, they provide as strong an empirical foundation for analysing the cadre management institution of local leaders as can be expected and a basis for generating hypotheses. This analysis also represents the first endeavour to collect and investigate a relatively large number of cadre evaluation regulations in the study of Chinese politics.
Local cadre evaluation has become more incentivizing. To enhance TRS effectiveness in shaping local leaders' political orientation, national regulations encourage: (1) actual work achievements to account for a larger proportion in the assessment results, and (2) career advancement to be more clearly and closely pegged to assessment results. Evaluation results combine at least three components: democratic appraisal, public opinion survey, and evaluation scores for performance targets. How different components of cadre evaluation were aggregated to generate final assessment results used to be vague. The actual importance of work achievements in the cadre evaluation, and especially the fulfilment of (or failure to fulfil) non-imperative targets, used to be essentially unregulated, which left it open for manipulation. Local cadre evaluation can become a mere formality under these circumstances. Only if actual work achievements are heavily weighted in evaluation results that are also closely pegged to career advancement is it reasonable to argue that the fulfilment of objective performance targets (instead of informal politics such as faction affiliation) is an important factor in career advancement.
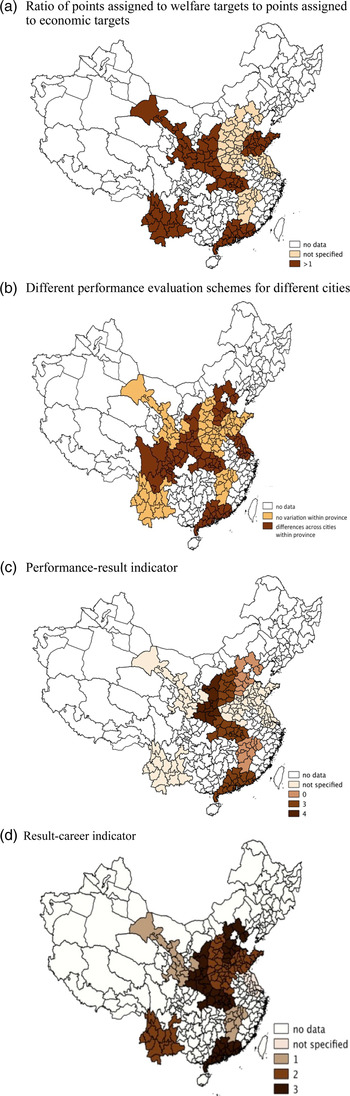
Since 2006, some localities have specified the weight of work achievements in evaluation results and the linkage between evaluation results and career advancement. Based on a content analysis of local regulations, I developed two indicators to measure the weight of performance evaluation in assessment results (performance-result) and the linkage between assessment results and career development (result-career). For the performance-result indicator, the higher the score, the more weight is assigned to performance evaluation results in final assessment. For the result-career indicator, the higher the score, the more closely is career advancement pegged to final assessment results. A more detailed description of these two indicators is presented in Appendix B. For each province, the higher the score on each indicator, the more effective the TRS is in motivating subordinate city leaders. Figures 3c and 3d map the performance-result and result-career indicators, respectively.
Content Analysis Results of (Provincial-level) Evaluation Rules for City Leaders

Local cadre evaluation has become more welfare-oriented. Post-2006 cadre evaluation rules for local leaders have become more welfare-oriented in three ways: (1) several social indicators have become imperative targets; (2) the weight of social welfare targets in performance evaluation is rising and, in many places, even exceeds the weight of targets related to economic development; and (3) local governments have led the way in rewarding leaders who realize achievements in social policy.
In addition to well-established imperative targets, environmental protection, workplace safety (anquan shengchan 安全生产) and resource conservation (jieneng jianpai 节能减排) have been newly upgraded to “must-meet” targets. The weight assigned to social policy targets in the TRS used to be lower than 30 per cent.Footnote 25 Out of 31 post-2006 local regulations that specify the weight of performance targets in my sample, almost half assigned more weight to social policy targets than to targets related to economic development. For the 11 provincial-level evaluation regulations in my sample, as shown in Figure 3a, six (Shandong, Shaanxi, Gansu, Hubei, Guangdong and Yunnan) have assigned more points to social policy targets than to economic targets.
In addition, some localities apply different performance evaluation schemes to different zones in order to adapt to local needs (see Figure 3b). For example, Guangdong province divides subordinate municipalities into four zoning categories: metropolitan development, optimized development, prioritized development and ecological development. The content and weight of performance targets vary across zones. For example, environmental indicators carry more weight than any other targets in the ecological development zone, while social policy indicators have the least weight in the prioritized development zone.Footnote 26 The greater discretion and encouragement of differentiation in the TRS lend legitimacy to assigning more importance to social policy indicators in localities that value social welfare advancement.Footnote 27
Some provinces have created awards for welfare development in the evaluation of government performance. For example, in Jiangxi province, the top two municipalities in the construction of a “harmonious society” receive an annual financial reward as high as US$250,000, and the top three counties in environmental protection receive an annual financial reward totalling US$100,000.Footnote 28 Part of the financial reward can go to the local leaders' year-end bonuses.
The key finding of the content analysis of cadre evaluation rules is that formal evaluation rules in some localities under the Hu–Wen administration have become more welfare-oriented than before. In places with such a change, welfare enhancement is viewed as an important determinant of political advancement:
Performance in social policy areas affects the legitimacy of CCP rule. I am highly confident that higher-level authorities appreciate (shangshi 赏识) local leaders who focus on welfare improvement.Footnote 29
Political promotion is not solely based on economic performance. The TRS now gives more weight to non-economic performance targets. In our locality, lots of local leaders were promoted because of reforms in social policy areas.Footnote 30
The change in evaluation criteria matters in governance. In Shaanxi, the new cadre evaluation rules effectively incentivize social policy innovation. In its new cadre evaluation rules, extra bonus points are assigned to pioneering practices that are recognized by higher authorities.Footnote 31 Owing to Beijing's new focus on welfare issues, local initiatives in social policy areas are increasingly valued by the centre and can more easily than before garner extra bonus points in cadre evaluation. For example, the-then county Party secretaries of Zichang 子长 and Zhidan 志丹 both noted that their main motive for embarking on health policy innovation was because the reform counted as a political achievement (zhengji 政绩) and could improve their evaluation results and therefore promotional prospects.Footnote 32 Similarly, the key motivation underlying local innovation in the compulsory education programme in Shaanxi is the fact that leaders whose jurisdiction is labelled as “education-advanced” are promoted faster.Footnote 33
Content analysis of formal cadre evaluation rules provides a snapshot of the political incentive structure. However, compared to formal rules on paper, the actual allocation of political rewards shapes leaders' incentives, and thus behaviour, more. The determinants of political advancement constitute the de facto political incentive structure for local leaders. The following section uses statistical analysis to uncover systematically the factors that affect the political advancement of city leaders.
The Allocation of Political Rewards
Existing statistical analyses on the political advancement of elites find that better economic and fiscal performance enhances provincial leaders' promotional prospects.Footnote 34 Another body of literature argues that informal politics, such as factional links, is more influential in determining the political fate of elites at the provincial level or above than actual work performance.Footnote 35 At the county and township levels, nepotism and informal cadre networks are found to dominate the recruitment of officials.Footnote 36 Reform of the selection of township leaders, such as professionalism and wider public consultation, is still at an early phase.Footnote 37 How much the Chinese personnel system is based upon merit and how that degree of meritocracy varies across different local government levels remains unclear.
In addition, my field research finds that officials in different provinces vary in their perception of the importance of economic development relative to social welfare enhancements when determining the promotional prospects of local leaders during the Hu–Wen administration. At one end of the spectrum, welfare enhancement is viewed as irrelevant to political promotion.Footnote 38 At the other end, officials view social welfare enhancement as just as important as economic development.Footnote 39 A third view treats welfare enhancement as relevant but as less important than the economy.Footnote 40 Below, I discuss (and test) the effect of economic performance, performance in social policy areas, and factional affiliation on the promotional prospects of city leaders.
Data and methods
The following analysis explores the political fate of municipal Party secretaries and mayors between 2003 and 2010. Cities in Tibet, ethnic autonomous prefecture-level cities, and ethnic prefecture-level districts (diqu 地区, meng 盟) are excluded from the sample because of a lack of consistent and systematic data. Beijing, Shanghai, Tianjin and Chongqing are not included in the sample owing to their special status and the consequent different dynamics of elite politics in these regions. For those holding Party secretary or mayoral positions between 2003 and 2010, I observed 725 instances of mayor turnover and 578 instances of Party secretary turnover between June 2003 and April 2013, a period that spans the Hu–Wen leadership. Cases where leaders were removed from office because of corruption, health problems or death are excluded from the sample. I treat these occasions as “abnormal” causes of local leadership turnover.Footnote 41
The observation in this statistical analysis is leader-tenure.Footnote 42 Provinces that contain fewer than 15 observations are deleted from the sample because they exhibit insufficient variation of the dependent variable to compute province-specific effects.Footnote 43 This generates a mayor sample of 667 observations (mayor-tenure) from 273 municipalities in 22 provinces, and a Party secretary sample of 554 observations (municipal Party secretary-tenure) from 268 municipalities in 21 provinces. I collected leaders' biographical and career history data from officials' curricula vitae published in Baidu baike 百度百科, a Chinese online archive. Other data are collected from Chinese statistical yearbooks.
In Chinese politics, most literature on elite politics groups Party leaders together with government executives. However, it is more than plausible that there are different dynamics underlying these two types of leadership. First, Party leaders are in charge of Party priorities and sustaining Party rule, whereas government executives make economic and social policies and undertake direct daily governance. Given this, the Party may assess and promote Party leaders and government executives by different (de facto) criteria. Focusing mainly on provincial elites and above in 1989 and 1994, Xiaowei Zang finds that educational requirements are higher for recruitment into the government system than into the Party, whereas Party seniority is more important when recruiting to the Party system than when recruiting into the government.Footnote 44 Second, formally at least, the appointment of these two types of leadership involves different players and follows different procedures. Different from Party leaders who are nominated and appointed by the Party, government executives are formally appointed and approved by congresses that have nominal public representation. It is possible that government executives are held more accountable to the public than are Party leaders. For these reasons and lacking a strong theory to bundle the two sorts of leaders together (as most studies do), I divide my sample into two subsamples and run regressions separately for city Party secretaries and mayors.
In my sample, the average tenure length for municipal Party secretaries and mayors is 3.9 and 3.5 years, respectively. To avoid transitory personnel arrangements, the dependent variable is defined as the political outcome two years after the completion of tenure as municipal Party secretary or mayor, instead of the immediate political outcome.Footnote 45 For both the municipal Party secretary and mayor sample, the dependent variable is dichotomous, with “1” indicating a promotion after completion of tenure, and “0” for all other conditions, including a transfer to a position of equivalent bureaucratic rank, exit or demotion.Footnote 46 Promotion, here, refers to the following political outcomes: (1) a move to a position of higher bureaucratic rank than that of municipal Party secretary or mayor; and (2) appointment to a more important position despite a bureaucratic rank equivalent to municipal Party secretary or mayor. The coding scheme is described in Appendix B. In my sample, 61 per cent of municipal Party secretary turnovers and 66 per cent of mayor turnovers are owing to promotion.
Explanatory variables of key interest are proxies for leaders' work achievements in welfare development during their tenures as municipal Party secretary or mayor. I use the growth rate of two variables during leaders' tenures as proxy measures: teacher–student ratio in secondary and primary schools, and the number of licenced doctors per hundred persons. I choose these variables for two reasons. First, the growth rates of these two variables are readily available data that reflect Beijing's post-2006 attention to welfare issue areas. Systematic data on other welfare criteria in the evaluation rules, such as the gross enrolment rate of senior high schools and the coverage rate of social insurance, are neither available nor consistent. More importantly, however, I use the growth of the doctor–population ratio and teacher–student ratio because these exact measures are specified criteria in local target performance evaluations.Footnote 47 That is, local leaders are evaluated based on their performance on precisely these two dimensions. The municipal figures for the growth of doctor–population ratio and teacher–student ratio are aggregated from district and county data. County and district governments report these data to the municipal-level authorities. A provincial office for cadre evaluation (kaoheban 考核办) under the provincial Party committee is in charge of verifying the authenticity of municipal-level data in the TRS. To be sure, the municipal leaders studied here have every incentive to try to game the data to improve career prospects. Yet, this is not easy to achieve. Not least of all, it requires the collusion of members of the provincial organization department, provincial evaluation office, municipal leaders and relevant local government departments, including health, education and statistical bureaus. Given the increasing monitoring capacity of the Chinese state and merit-based personnel system, there is no strong basis for presuming that the ability to game the statistical data explains city leaders' prospects for promotion. I also combined these two growth variables to form a single welfare growth variable. Given the change in the Party's priorities, I expect the coefficients for these welfare measures to be positive.
Another two important explanatory variables include a proxy for economic performance (growth rate of GDP per capita during leaders' tenure) and a proxy for personal connections with superiors. Here, personal connections with superiors are measured using Victor Shih's method.Footnote 48 The personal connection variable is a binary measure with “1” meaning the municipal leader shares a birthplace, college or previous workplace with the provincial Party secretary or governor.
I also include a set of control variables. “Vice-provincial” cities and provincial capital cities are more important in the Chinese political hierarchy, which is likely to increase their leaders' odds of promotion. Thereby, I create a dichotomous measure (important city) to capture the political attributes of municipality. A quadratic form of municipal overall wealth (GDP per capita) during one's tenure as municipal Party secretary or mayor is also included to control for possible effects of municipal attributes on promotion probability. Additionally, evidence shows that younger, more educated, male Han Chinese who are earlier in their tenure have better odds of political advancement.Footnote 49 Therefore, I add individual attributes. Turnover year dummies and provincial dummies are included in the models of mayors. A description of all measures is reported in Appendix A.
I use a hierarchical logit model for municipal Party secretaries and a simple logit model for mayors because the test statistics show that there are meaningful variations in political promotion across provinces for municipal Party secretaries but not for mayors.Footnote 50 This justifies adding provincial-level variables to the municipal Party secretary model but not to the mayor model. For the municipal Party secretary sample, I include some provincial-level attributes: average size (quadratic form) and growth rate of GDP per capita between 2003 and 2010.
Empirical results
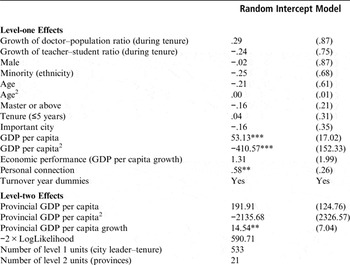
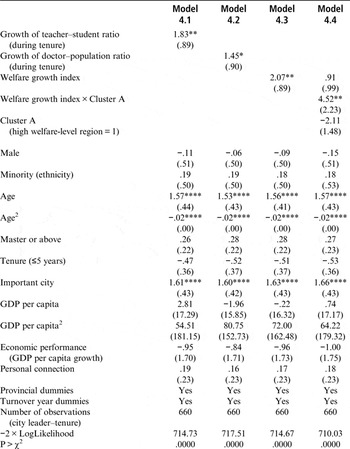
Results are presented in Tables 3 and 4. To what extent is the cadre management institution merit-based? For municipal Party secretaries, there is little evidence that supports the strong agency model in which cadres are rewarded on the basis of their contribution to either local economic or social progress. None of the proxy measures of work achievements during their tenures as city Party secretaries are statistically significant. Instead, personal connections with provincial leaders seem more helpful in political advancement. For mayors, neither work achievements in local economic growth nor personal connections with superiors are statistically significant factors in their political life; instead, performance in social policy areas, measured as the growth of the teacher–student ratio and doctor–population ratio, is positively associated with their political advancement. Municipal leaders can make relevant policies, such as increasing salaries or creating special benefits, to attract or hire more doctors and teachers, or allocate more funds to lower-level governments to do so. A 10 per cent increase in the growth rate of doctor–population ratio or teacher–student ratio moderately enhances the probability of promotion by around 5 per cent. As shown in Appendix A.1, in my sample, the greatest increase in the growth rate of doctor–population ratio and in teacher–student ratio during a leader's tenure is 82 per cent and 60 per cent, respectively, which can, in turn, greatly enhance the probability of promotion by around 40 per cent and 30 per cent. This is a plausible finding, given the change in Party priority and the subsequent adaptation of personnel institutions.
Promotion of City Party Secretaries

Source:
Author's dataset. See Appendix A.
Notes:
*p < .10; **p < .05; ***p < .01. Standard errors in parentheses. All coefficients in the random intercept models are FLM estimates. For random intercept models, using level 1 variables that are centred around their group means and grand-centred level 2 variables does not change substantive findings. Thus, I report results using non-centred variables.
Promotion of Mayors, Logit Model

Source:
Author's dataset. See Appendix A.
Notes:
*p < .10; **p < .05; ***p < .01. **** p < .001. Robust standard errors in parentheses.
Consistent with the finding that local cadre evaluation rules vary a great deal, there is strong evidence of contextual variation in the political management of municipal political leaders. As shown in Table 3, for municipal Party secretaries, all else being equal, those in provinces with faster economic growth have a better chance of promotion. In addition, after controlling for provincial-level attributes, the municipal-level overall wealth has an inverted U-shaped relationship with the municipal Party secretaries' promotion probability: those serving in middle-level wealthy cities are more likely to be promoted than those in economically well-off or laggard cities. For mayors, serving in “vice-provincial” cities or provincial capital cities increases the probability of promotion by 27 per cent. Such a substantial increase in promotional prospects is probably derived from the political and economic primacy of these cities. Political centralization does not necessarily imply that the political management of the Party is uniform across localities. Other scholarly findings show that some provinces are politically more important and thus get preferential treatment.Footnote 51 This analysis suggests that political importance is also unequal among (even ordinary) cities.
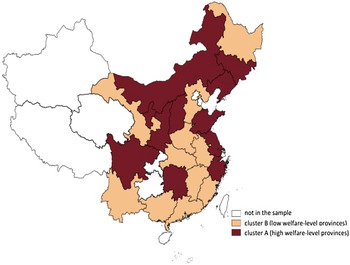
Following up on variation in perceptions expressed by interview subjects, I test whether the positive effects of welfare advancement on political advancement vary across regions. A simple intuition is to explore whether more political incentives to develop welfare are instituted in places with an already higher welfare level or a lower one. Therefore, as shown in Figure 4, I divide the provincial units in my sample into two clusters. Cluster-A provinces are the top 11 provinces in a welfare indicator and perform better in terms of welfare than cluster-B provinces in 2003.Footnote 52 Put simply, cluster A represents places with an already higher welfare level, whereas cluster B represents welfare laggards in 2003.Footnote 53 To explore whether the effects of welfare performance on political advancement vary across these two clusters, I create an interaction term between the welfare growth variable and the indicator variable, with “1” meaning cities locating in cluster A. Owing to the multi-collinearity problem, the coefficient for the welfare growth variable in model 4.4 is not statistically significant, yet the coefficient sign remains positive. Furthermore, the coefficient for the interaction term is positive and statistically significant, indicating that, on average, the contributing effect of welfare performance on a mayor's promotion is greater in cluster-A cities than in cluster-B cities.
Two Clusters of Provinces

Lastly, echoing previous studies on elite promotion, better educated mayors have a moderately higher probability of promotion. In addition, there is an age threshold (around 46 years old), beyond which age decreases a mayor's likelihood of political advancement.Footnote 54 Tenure length, on the other hand, does not seem to have a statistically significant effect on the promotional prospects of city leaders.
Robustness
For city Party secretaries, using a simple logit model with provincial dummies gives a similar result. In the random intercept model for city Party secretaries, adding other provincial attributes, such as provincial-level budgetary revenue, budgetary revenue growth rate and natural population growth rate, does not change the substantive finding. In all models, revenue size, the growth rate of budgetary revenue and absolute values of welfare measures (such as doctor–population and teacher–student ratios) are not included owing to a high correlation with GDP per capita. However, adding them does not change the substantive finding. Using other welfare measures, such as the growth rate of the hospital bed–population ratio or student–population ratio, gives similar results.
For clustering, I test the variation in effects of welfare advancement on political promotion across western, middle and coastal areas by adding interaction terms between district dummies and the welfare growth variable into the models. None of these interaction terms is statistically significant. I also tried other cut-off points (instead of five years) for tenure length. No tenure length is found to correlate statistically significantly with the promotional prospects of local leaders.
Discussion and Conclusion
The statistical analysis shows that the structure of political incentives varies across different types of leadership. Personal connections with political bosses and better economic performance (of the province where the city is located) enhance the promotional prospects of city Party secretaries. By contrast, age, city status and performance in social policy areas are determinants of mayors' political advancement. The CCP does indeed reward achievements in certain welfare issue areas, but it does so selectively. City mayors, and not municipal Party secretaries, are the beneficiaries of work achievements in social policy. This seems to correspond with the division of labour between Party secretaries and government executives. Municipal Party secretaries are mainly in charge of political life and maintaining Party rule, whereas mayors are held accountable for daily governance. If higher authorities choose to reward or punish local leaders for their performance in social policy areas, then we would expect government executives to be the most likely targets. Previous research finds that mayors in the Jiang era were not punished for poor economic performance and were rewarded (with external promotion) only when they realized extraordinary achievements in economic growth.Footnote 55 Under the Hu–Wen leadership, economic performance remains relatively unimportant in the political life of mayors. What has changed is the increasing importance of social policy development as the Party promotes its dual priorities. Another study shows that performance in tackling environmental pollution is a determinant of mayors' promotions during the Hu–Wen administration.Footnote 56 Further evidence shows that having different political incentive structures for city Party leaders and government executives has implications for city leaders' spending behaviour.Footnote 57
This analysis also reveals local variation in managing municipal leaders. Other things being equal, mayors in “vice-provincial” cities or provincial capitals and municipal Party secretaries in middle-level wealthy cities are more likely to be promoted. The majority of municipal leaders are “local”: in my sample, the figures for the proportion of leaders that were transferred (to the municipal leading position) from other provinces or from central-level positions were 1.8 per cent and 2.3 per cent for municipal Party secretaries, and 1.5 per cent and 0.8 per cent for mayors, respectively. Therefore, it is not the case that better people are allocated to better cities or provinces in the first place. Local leaders serving in different places are treated differently in this single-party system: some places are endowed with a higher likelihood of political advancement and thus faster elite upward mobility than other places. Whereas it is relatively easier to understand that the preferential treatment of leaders of “vice-provincial” cities or provincial capitals is because of these cities' political and economic primacy, the finding that better political endowments are instituted in mid-level wealthy cities and economically faster developing provinces is puzzling and needs further investigation. Moreover, the statistical findings suggest that the structure of political incentives varies across regions: welfare advancement is more important for the promotion of mayors in localities that already enjoy a relatively high welfare level. The explanation for this requires further exploration and will enhance our understanding of unbalanced development in China.
As the Party's priorities change, the personnel institution that incentivizes local leaders adapts to reflect the change. Yet, if policy programmes are available, why bother resorting to institutional mechanisms to promote welfare advancement? The benefit of changing personnel institutions is to promote spontaneous local trial-and-error in social policy areas when the centre lacks information on which welfare issue areas should be reformed and how welfare reforms should be carried out.Footnote 58 It is important to note that the Party ultimately controls the institutionalization of local welfare development. The Party has the flexibility to adjust or even reverse the process by changing the cadre evaluation rules when necessary. The main message from this analysis is that this one-party state is strong: as the Party makes shifts in its ruling priorities, it has the tools to ensure that local governments comply with these shifts; moreover, the Party tailors its design of political incentives to reflect the division of labour.
Appendices
A Description of Variables
A.1 Descriptive Statistics

A.2 Measurement of independent variables
Level 1 variables
Demographics: age in years, dummy variable denoting male leaders, dummy variable denoting non-Han Chinese, dummy variable denoting that the highest education level upon turnover is equivalent to a PhD degree or a master degree;
Tenure: dummy variable denoting that the length of tenure up to the year of turnover is less than six years;
Important city: dummy variable denoting that the city a mayor or municipal Party secretary served is a vice-provincial city or provincial capital city;
GDP per capita (million yuan): average GDP per capita of the city during a mayor or municipal Party secretary's term;
Economic performance: average growth rate of GDP per capita of the city during a mayor or municipal Party secretary's term;
Personal connection: dummy variable denoting whether the municipal leader shared his or her birthplace, went to the same college, or worked in the same work unit or work organization, such as the youth league, with the provincial Party secretary or governor;
Growth of doctor–population ratio: the average growth rate of doctors per 100 people during a mayor or municipal Party secretary's term;
Growth of teacher–student ratio: the average growth rate of teacher–student ratio in primary, regular junior high, and regular senior high school during a mayor or municipal Party secretary's term;
Welfare growth index: the sum of growth of the doctor–population ratio and teacher–student ratio;
Cluster A: dummy variable denoting that the city is located in cluster A.
Level 2 variables
Provincial GDP per capita (million yuan): average provincial-level GDP per capita between 2003 and 2010;
Provincial GDP per capita growth: average growth rate of provincial-level GDP per capita between 2003 and 2010
B Coding
B.1 Coding of municipal cadre evaluation rules
The result-career indicator is the sum of the “reward” and “penalty” indexes. The “reward” index is a sum of two categorical variables: “bonus” and “promotion.” “Bonus” is coded “0” if the regulations only stipulate praise and reward without giving any specifics, and “1” if the regulations specify a concrete amount of financial bonus if the leader is evaluated to be excellent. “Promotion” is coded “0” if there is no stipulation about political rewards, “1” if the leader should be promoted with priority (youxian ti bo, zhongyong 优先提拔, 重用), and “2” if it is stipulated that the assessment results account for a certain percentage of the democratic recommendation score, which is the basis for nomination for local leading positions, and the leader is to be promoted with priority, if evaluated to be excellent. The “penalty” variable is coded “0” if there is no stipulation on punishment, “1” for discretionary demotion or removal (zhuoqing jinxing zuzhi tiaozheng 酌情进行组织调整), “2” for definite demotion or removal, and “3” for a definite demotion with a financial penalty, when the evaluation of a city leader or city leading group (lingdao banzi 领导班子) is graded as incompetent or somewhat competent for two or three years consecutively. Thus, the result-career indicator is a seven-level categorical variable, ranging from zero to six.
The performance-result indicator is a six-level categorical variable, which is coded “0” if there is no stipulation on the specific proportion of performance evaluation score in the final assessment result, “1” if the performance evaluation score accounts for less or equal to 20 per cent of the final assessment result, “2” if the proportion is larger than 20 per cent but less or equal to 40 per cent, “3” if the proportion is larger than 40 per cent but less or equal to 60 per cent, “4” if the proportion is larger than 60 per cent but less or equal to 80 per cent, and “5” if the proportion is larger than 80 per cent.
B.2 Coding of political promotion of city leaders
For coding, I consulted an official who has worked at the municipal CCP committee's general office (shiwei bangongshi 市委办公室) for over ten years. For leaders who hold multiple concurrent positions, I coded the one with the highest rank.
Political promotion. (1) The bureaucratic rank that is higher than the city-level rank, the rank of municipal city Party secretary and mayor, includes vice-ministerial level rank and above. In my sample, positions of a higher bureaucratic rank than the city-level rank include, but are not limited to, the following: chief economist at the Ministry of Agriculture (nongyebu zongjingjishi 农业部总经济师), vice-president of the Central Party School, vice-bureau head of the Central Party Organization Department, vice-head of the National Industry and Information Technology Ministry, vice-provincial Party secretary, (vice) governor, member of the standing committee of a provincial Party committee, assistant to a governor (shizhang zuli 市长助理), (vice) director of a provincial people's congress, (vice) chairman of a provincial people's political consultative conference, and head of a provincial court.
(2) The political rank of city Party secretaries and mayors in 15 “vice-provincial” municipalities is one-half a bureaucratic rank higher than those in ordinary cities. Thus, a move from the leading position in an ordinary city to that of a “vice-provincial” municipality is considered a promotion.
(3) Appointment to a more important position with an identical bureaucratic rank includes a move to the position of director of a provincial development and reform committee, the head of a provincial financial bureau, or the secretary general of a provincial Party committee. According to the official I consulted, these positions are generally acknowledged, in Chinese officialdom, to be very important or considered to be holding positions for future higher level leaders. In addition, although mayors have an identical bureaucratic rank as municipal Party secretaries, more power is vested in Party secretaries. Thus, for a mayor of an ordinary municipality, a move to the municipal Party secretary position of another ordinary municipality is also considered as promotion. Provincial capital cities, even those that are not given “vice-provincial” municipality status, are politically and economically more important to a province than ordinary municipalities. Therefore, a move from a leading position in an ordinary city to the leading position in a provincial capital city is considered to be a promotion.
Transfer. Transfer refers to a move to a rank equivalent to that of city Party secretaries and mayors.
Demotion. Demotion refers to a move to a lower rank or a move to a politically less important position despite a bureaucratic rank identical to that of municipal Party secretary or mayor, such as the head of a municipal people's congress or chair of a municipal people's political consultative conference. These positions are often filled by officials who are close to retirement age.
C Clustering
Two Sample T-Test of Cluster A and Cluster B Provinces