Introduction
The role of biogeographic and ecological processes in determining taxonomic, genetic and functional group diversity and distribution patterns has a long history of study (Mayr, Reference Mayr1942; Gobin & Warwick, Reference Gobin and Warwick2006; Frey, Reference Frey2010; Dray et al., Reference Dray, Pélissier, Couteron, Fortin, Legendre, Peres-Neto, Bellier, Bivand, Blanchet and De Cáceres2012). Diversity is typically approached using two components: inventory (e.g. species richness) and variation such as species turnover and compositional change (Noss, Reference Noss1990). Species diversity and distribution patterns are scale-dependent (Andrew & Mapstone, Reference Andrew and Mapstone1987), with different spatial patterns emerging when using the two components. Benthic diversity and assemblage variation are determined by the interaction of abiotic and biotic factors (Rex et al., Reference Rex, Stuart, Hessler, Allen, Sanders and Wilson1993; Ingels & Vanreusel, Reference Ingels and Vanreusel2013), with the ecological factors determining diversity and patterns that vary with scale (Gering & Crist, Reference Gering and Crist2002). For example, small-scale variations in deep sea fauna depend on oxygen availability, nutrient distribution, and interactions between organisms or between organisms and their environment (Eckman & Thistle, Reference Eckman and Thistle1988; Snelgrove et al., Reference Snelgrove, Grassle and Petrecca1992; Schaff & Levin, Reference Schaff and Levin1994). In contrast, larger-scale faunal patterns have been assumed to depend on broader-scale physical parameters (e.g. bottom currents and hydrodynamic regimes) and nutritional input from the euphotic zone and near margins (Thistle & Sherman, Reference Thistle and Sherman1985; Vanreusel et al., Reference Vanreusel, Vincx, Bett and Rice1995; Galéron et al., Reference Galéron, Sibuet, Mahaut and Dinet2000). Therefore, a prerequisite step is to identify at which spatial scale factors of importance operate to regulate community characteristics based on broad-scale comparisons (Ingels & Vanreusel, Reference Ingels and Vanreusel2013).
Hierarchical sampling designs are an appropriate method to evaluate the contribution of each spatial scale to species assemblage structure and diversity that is useful in assessing broad-scale patterns (Murphy et al., Reference Murphy, Tolhurst, Chapman and Underwood2009). To date, many studies have investigated the variation of biotic indices using hierarchical sampling approaches for coastal and deep-sea ecosystems (Hewitt et al., Reference Hewitt, Thrush, Halliday and Duffy2005; Fonseca et al., Reference Fonseca, Soltwedel, Vanreusel and Lindegarth2010; Muniz et al., Reference Muniz, Hutton, Kandratavicius, Lanfranconi, Brugnoli, Venturini and Giménez2012; Ingels & Vanreusel, Reference Ingels and Vanreusel2013; Brauko et al., Reference Brauko, de Souza, Muniz, de Camargo and da Cunha Lana2015). For example, there have been broad-scale studies of recruitment (Jenkins et al., Reference Jenkins, Aberg, Cervin, Coleman, Delany, Della Santina, Hawkin, LaCroix, Myers, Lindegarth, Power, Roberts and Hartnoll2000), experimentation on a large-scale geographic comparison on rocky shores (Jenkins et al., Reference Jenkins, Coleman, Della Santina, Hawkins, Burrows and Hartnoll2005; Coleman et al., Reference Coleman, Underwood, Benedetti-Cecchi, Åberg, Arenas, Arrontes, Castro, Hartnoll, Jenkins and Paula2006), variation in deep sea nematode assemblages over multiple scales in Arctic deep seas (Fonseca et al., Reference Fonseca, Soltwedel, Vanreusel and Lindegarth2010) and spatial scale variation in determining structural and functional characteristics of deep infaunal assemblages (Ingels & Vanreusel, Reference Ingels and Vanreusel2013). With multi-scale approaches, species assemblage variations can be examined across hierarchical spatial scales and estimates of variance used to compare the variability of species assemblages across these scales (Underwood, Reference Underwood1997; Kelaher et al., Reference Kelaher, Chapman and Underwood2001, Reference Kelaher, Castilla and Seed2004).
Macroalgae are important providers of habitat for marine macrofaunal (Bracken et al., Reference Bracken, Gonzalez-Dorantes and Stachowicz2007; Liuzzi & López Gappa, Reference Liuzzi and López Gappa2011) and meiofaunal invertebrates (Bell & Coen, Reference Bell and Coen1982; Da Rocha et al., Reference Da Rocha, Venekey, Bezerra and Souza2006). Turf-forming algae that trap sediments can be particularly important for both macrofauna (Huff & Jarett, Reference Huff and Jarett2007) and meiofauna (De Oliveira et al., Reference De Oliveira, Derycke, Da Rocha, Barbosa, Decraemer and Dos Santos2016). Most studies on nematodes living in macroalgae have investigated the relationship between nematode assemblages and macroalgal morphological complexity (Gestoso et al., Reference Gestoso, Olabarria and Troncoso2010; De Oliveira et al., Reference De Oliveira, Derycke, Da Rocha, Barbosa, Decraemer and Dos Santos2016; Veiga et al., Reference Veiga, Sousa-Pinto and Rubal2016). Nematode density and diversity can be dependent on the morphology of macroalgae (Gibbons, Reference Gibbons1988; Gee and Warwick, Reference Gee and Warwick1994a, Reference Gee and Warwick1994b; Pérez-García et al., Reference Pérez-García, Ruiz-Abierno and Armenteros2015), and modified by a set of abiotic and biotic factors (Gibbons, Reference Gibbons1988; Giere, Reference Giere2009). To date however, no study has investigated the relationship between nematode assemblages and macroalgae at different spatial scales to quantify geographic patterns of species diversity. Our study seeks to address this gap using a cosmopolitan taxon of habitat-forming algae, Corallina spp. in Korea and the British Isles.
Species-pooling by similar functional groups can show different relationships between assemblages, unlike taxonomic classification (Schratzberger et al., Reference Schratzberger, Warr and Rogers2007; Armenteros et al., Reference Armenteros, Ruiz-Abierno, Fernández-Garcés, Pérez-García, Díaz-Asencio, Vincx and Decraemer2009). Traditional taxonomic approaches, based on nematode diversity and community structure from species abundance data, do not take account of diversity in biological and/or functional traits (Schratzberger et al., Reference Schratzberger, Warr and Rogers2007). Several previous studies have, however, revealed that comparisons between taxonomic and functional diversity can be useful for inferring ecosystem functioning and the effect of environmental variables and human activity (Bremner et al., Reference Bremner, Rogers and Frid2003). Therefore, we also adopted a biological traits approach.
We implemented a broad-scale hierarchical approach to specifically investigate differences in the genus richness and compositional patterns of nematodes living within the cosmopolitan habitat-forming algae Corallina spp. across five different spatial scales and explore the factors affecting variation at each scale. Corallina officinalis was long considered to be a single cosmopolitan species, because of its similar morphology worldwide; but molecular methods have now shown it to comprise several species (Walker et al., Reference Walker, Brodie, Russell, Irvine and Orfanidis2009). Specifically, we compared nematode assemblages in Corallina turves along the coasts of the English Channel and South Korea using a nested design. On both coasts, there are gradations from oceanic to neritic conditions: from west to east in the English Channel and from east to west in Korea; but current patterns are more complex on the Korean coast.
Our specific objectives were: (1) to compare nematode density, genus richness, assemblage composition and biological traits (feeding type and life history strategies) living in Corallina spp. across multiple spatial scales; (2) to determine the relationship between abiotic factors and nematode assemblages associated with Corallina spp. at five different spatial scales along the environmental gradients along each coastline (i.e. oceanic influence and tidal range).
Materials and methods
Sampling strategy
In order to compare nematode assemblages in algal turves on the south coasts of Britain with Korea, a hierarchical experimental design was used. Each set of samples was collected following a fully nested hierarchical design across five spatial scales: country (British Isles and South Korea), regions (three coastal stretches at least 50 km apart), shore (two shores about 1 km long and at least 10 km apart for each habitat), patch (three patches at least 10 m apart) and sample (three replicate samples of 5 × 5 cm quadrat at least 10 cm apart). Two rocky shores in three regions at the low intertidal level (between 1.4 and 2 m above chart datum) dominated by turves of Corallina spp. were selected for sampling. Sampling locations with similar environmental conditions were chosen: moderately exposed to wave action, with at least 80% turf of Corallina spp. and gently sloping, seaward-facing bedrock.
Study areas and sample collection
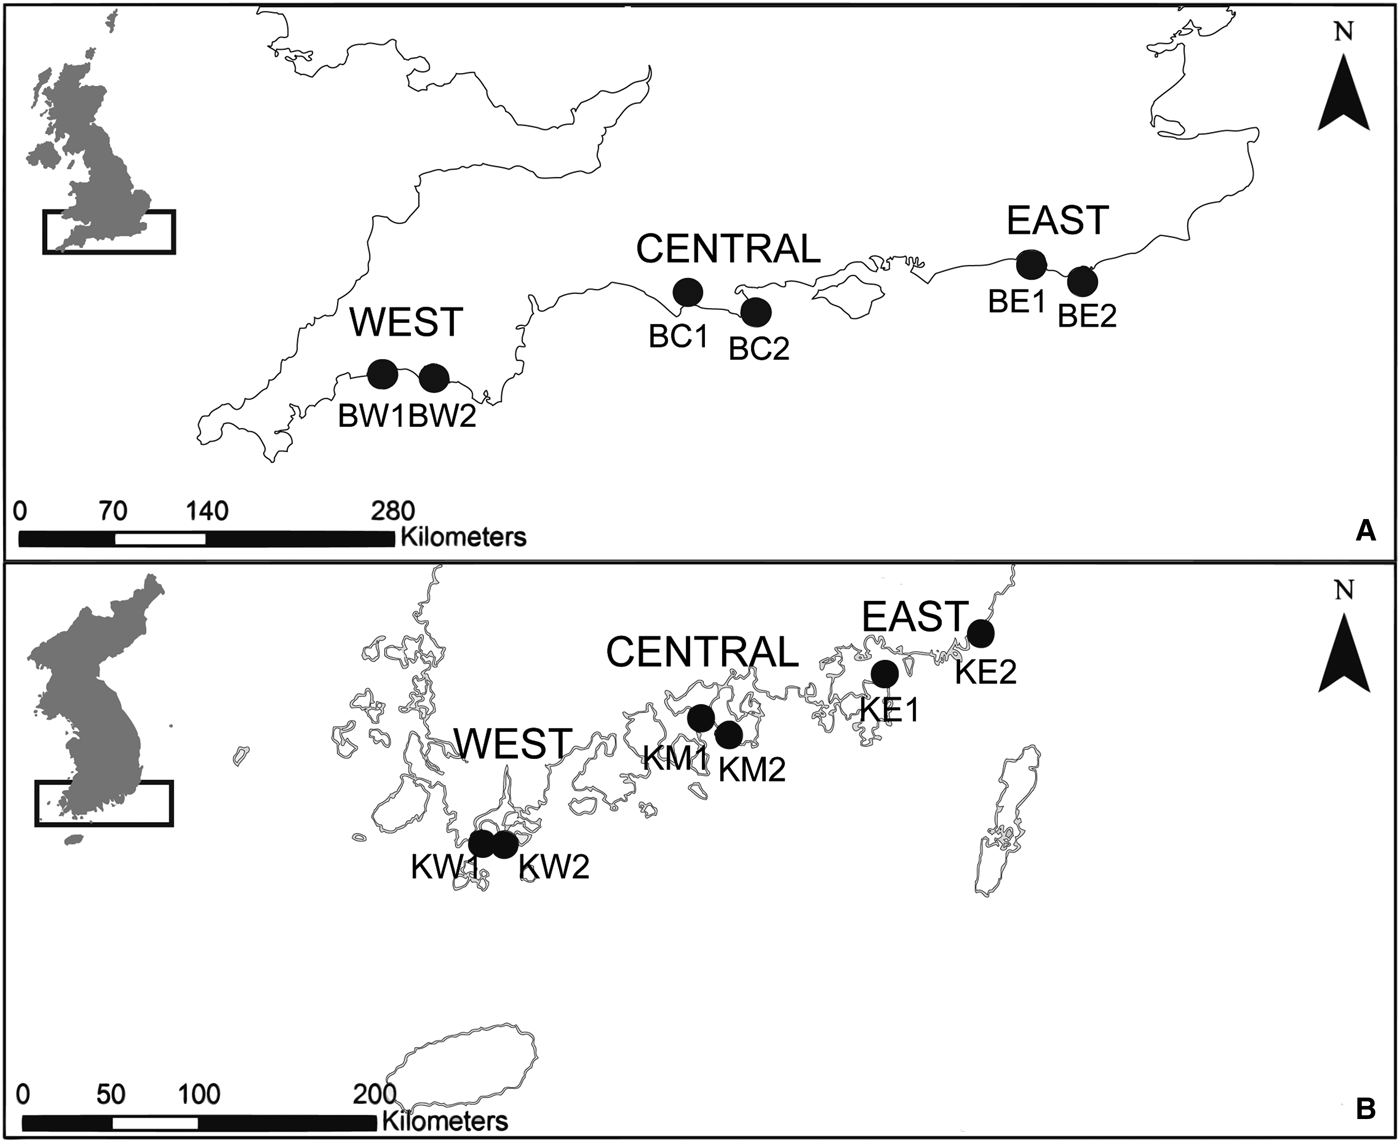
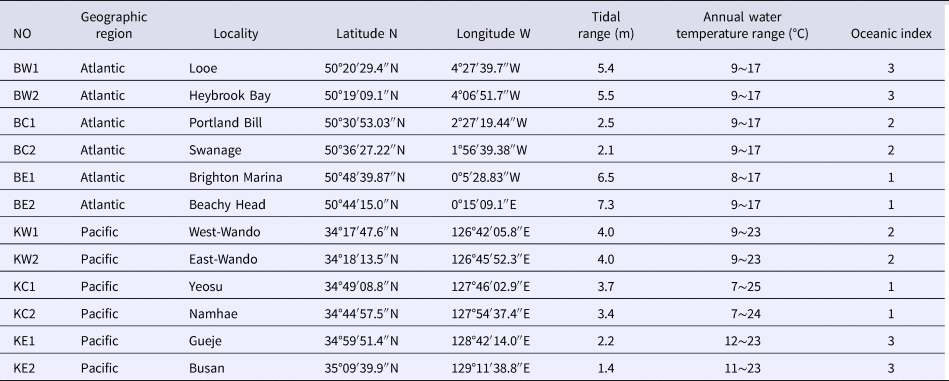
Nematode samples were collected in Britain in June and South Korea in July in 2014 (Figure 1). To enable spatial comparisons two shores in each of three regions were surveyed on the south coasts of each country (Table 1): in Britain in the western English Channel Looe (BW1) and Heybrook Bay (BW2); in the central English Channel Swanage (BC1), Portland Bill (BC2); and in the eastern English Channel Brighton (BE1), Beachy Head (BE2). In South Korea, West-Wando (KW1) and East-Wando (KW2) in the west, Yeosu (KC1) and Namhae (KC2) in the centre, and Gueje (KE1) and Busan (KE2) in the east were sampled. On each shore, three replicate patches were surveyed by randomly collecting at least five replicates (5 × 5 cm) of Corallina spp. for morphological identification. Each replicate sample was completely removed from the substrata by scraping, carefully placed into a labelled plastic bag and immediately moved into an icebox to preserve for further processing in the laboratory. Broad-scale environmental data (July SST and tidal range from The Centre for Environment, Fisheries and Aquaculture Science (Cefas) in Britain and from the National Oceanographic Research Institute in South Korea) were combined with sample-specific data (sediment load and algal dry weight) to explore abiotic and biotic factors influencing assemblage abundance and composition. An Oceanic Index based on ranking proximity to the open ocean (Pingree & Griffiths, Reference Pingree and Griffiths1980; Huh, Reference Huh1982) was used in order to investigate how water type (i.e. oceanic or neritic) affected nematode assemblages: a value of 3 indicates a strong oceanic influence, 2 indicates moderate oceanic influence and 1 a highly neritic area with minimal oceanic influence.
The sampling locations in Britain: BW1: Looe; BW2: Heybrook Bay; BC1: Portland Bill; BC2: Swanage; BE1: Brighton; BE2: Beachy Head; KW1: west-Wando; KW2: east-Wando; KC1: Yeosu; KC2: Namhae; KE1: Gueje; and KE2: Busan in South Korea.

Environmental context of sampling locations on the south coasts of Britain and South Korea

Sample analysis
In the laboratory, three replicates of Corallina spp. were processed for morphological identification of nematode species. Each sample was washed with filtered tap water and was decanted through a series of nested sieves of 1-mm to remove the larger fragments of algae and sediments; this was followed by 63 and 38 µm mesh to prevent missing fractions of the sample. Each Corallina spp. sample was rinsed and decanted three more times to ensure that all the epifauna had been removed; all extracted epifauna were preserved in 4% buffered formaldehyde solution. After washing, the Corallina pieces were oven-dried at 60°C for 48 h and were separated into Corallina and sediments in order to measure their respective dry weights.
After extraction, all nematodes were picked out and counted under a stereo-microscope (Leica M125). When nematodes were too numerous to count all of them, sub-samples were taken using a Folsom plankton splitter (McEwen et al., Reference McEwen, Johnson and Folsom1954). The first 100 nematodes were randomly chosen and mounted in anhydrous glycerine on hole-slides (Shirayama et al., Reference Shirayama, Kaku and Higgins1993), enabling better microscopic observation of meiofaunal specimens on both sides. Nematodes were identified to genus level under a light microscope (Olympus BX53). The pictorial keys of Platt & Warwick (Reference Platt and Warwick1983) and the Handbook of Zoology (Schmidt-Rhaesa, Reference Schmidt-Rhaesa2014) were used for identification, with the World Register of Marine Species (WoRMS) for naming the specimens (WoRMS Editorial Board, 2019).
Each nematode individual was classified according to four different feeding types, based on their morphological and presumed functional features of the buccal cavity (Wieser, Reference Wieser1953). Wieser (Reference Wieser1953) classified free-living nematodes into four feeding types: selective deposit feeders (1A), non-selective deposit feeders (1B), epigrowth feeders (2A) and predators/omnivores (2B).
An alternative trait-based classification with potential functional relevance can be provided by the tail shape of nematodes, that is linked to mobility, habitat preference and lifestyle (Thistle et al., Reference Thistle, Lambshead and Sherman1995). The diversity of tail shapes together with the feature of buccal morphology has proven to be an effective tool to discriminate between nematode assemblages (Thistle et al., Reference Thistle, Lambshead and Sherman1995). Nematodes were classified into four tail shape groups: 1. short/round tail type with blunt end; 2. clavate-conico-cylindrical tail type, initially conical with an extension to the tip; 3. conical tail type, with a pointed tip and tail length less than five body widths; 4. long tail type, with a tail longer than five body widths (Thistle & Sherman, Reference Thistle and Sherman1985).
The life history strategies of nematodes have been described by Bongers et al. (Reference Bongers, Alkemade and Yeates1991; Bongers, Reference Bongers1999) who proposed a scale (c-p score) to classify nematodes genera based on their ability to colonize newly available habitat. The scale ranges from a score of 1 for nematodes with an extreme ability to (re) colonize to a maximum of 5 for nematodes which have a low colonization potential, linked to comparatively low fertility and slow development. Scale 5 nematodes require a stable environment to thrive and are called persisters in the scheme of Bongers (Reference Bongers1999).
A biological traits matrix was assembled by following the above approaches to assess the functional structure of nematode communities at all spatial scales (Schratzberger et al., Reference Schratzberger, Warr and Rogers2007). The three trait categories described above were used: feeding type (four groups), life history strategies (five) and tail shape (four), yielding a total of 80 possible trait combinations, of which 41 were observed in our dataset. A matrix of biological traits was created by assigning each nematode taxon to each trait category. The biological trait matrix was then combined with relative species abundance to give abundance-weighted traits matrices for each spatial scale (Appendix 2).
Data analysis
Nematode assemblage structure was determined by using the relative abundance of nematode genera, and genera richness. Structural diversity was described by expected number of genera for a normalized sample size of 50 individuals (EG(50)), based on the formula by Sanders (Reference Sanders1968) which was corrected by Hill (Reference Hill1973). Multivariate data analysis was conducted in the software Primer 6.0.2 (Clarke & Gorley, Reference Clarke and Gorley2006) with permutational multivariate analysis of variance (PERMANOVA) add-on (Anderson et al., Reference Anderson, Gorley and Clarke2008). The data for the abundance of each nematode genus in each replicate sample in each patch, shore and region were standardized by their total abundance and square-root transformed. The means of the transformed abundance for each patch, shore and region were used to construct a Bray–Curtis similarity matrix; this was then subjected to group averaged hierarchical cluster analysis and non-metric multidimensional scaling (nMDS) ordination. The samples were subjected to fully nested PERMANOVA with Monte Carlo tests to ascertain whether the species compositions of the nematode assemblages differed among patches within shores within regions within country and between countries. The countries (British Isles and Korea) were fixed factors, with regions, shores and patches as random factors. Monte Carlo routines were used when the results were based on fewer than 100 permutations. Estimates of components of variation were made in a PERMANOVA test to identify variability of nematode composition at each spatial scale. PERMDISP routines were used to test the PERMANOVA assumption on the homogeneity of multivariate dispersion and identify the nature of the effect of each spatial scale. When PERMANOVA detected significant differences among the groups, similarity percentages (SIMPER) were used to determine the genera that typified those groups and the species that distinguished each group from each of the other groups.
Spearman correlation tests were used to assess the relationship between environmental variables (SST, tidal range and sediment retention) and nematode density and taxa richness. BIOENV methods with the Best test were used to identify the subset of environmental variables that produced the best correlation with nematode genera community similarities using Spearman's correlation between similarity matrices. A RELATE test measured how well the patterns observed in the dataset based on genus composition matched those seen in the dataset based on biological traits by calculating a Spearman rank correlation coefficient.
Differences in environmental parameters were tested by a one-way Analysis of Variance (ANOVA). The data were checked with diagnostic graphics to ensure they fulfilled parametric assumptions. When needed, the data were log (χ + 1) transformed and Bartlett's test was used to check the assumption of homoscedasticity.
Results
Abiotic context
Table 1 summarizes geographic and environmental information. Sea-surface temperature in July (SST) and tidal range were significantly different among shores (df = 6, P < 0.001), in regions (df = 4, P < 0.001) and between countries (df = 1, P < 0.001). It was warmer in South Korean waters than in the English Channel. In South Korea the warmest shore was Yeosu (23.7°C). In the English Channel, most shores were around 16°C (Looe, Beachy Head, Heybrook Bay and Swanage). Tidal range was greater in Britain than South Korea, but with considerable regional variation. In the English Channel the smallest tidal range was in the central region with a greater tidal range in the western and eastern regions. In South Korea, the gradient of tidal range was higher from the western (4 m) to the eastern region (1.4 m). The amount of sediment retention in Corallina turf was significantly different among patches and among shores (P < 0.001), but not among regions and countries. It was greatest at Heybrook Bay in Britain and East-Wando in Korea.
Density and diversity of nematode assemblages across all geographic scales
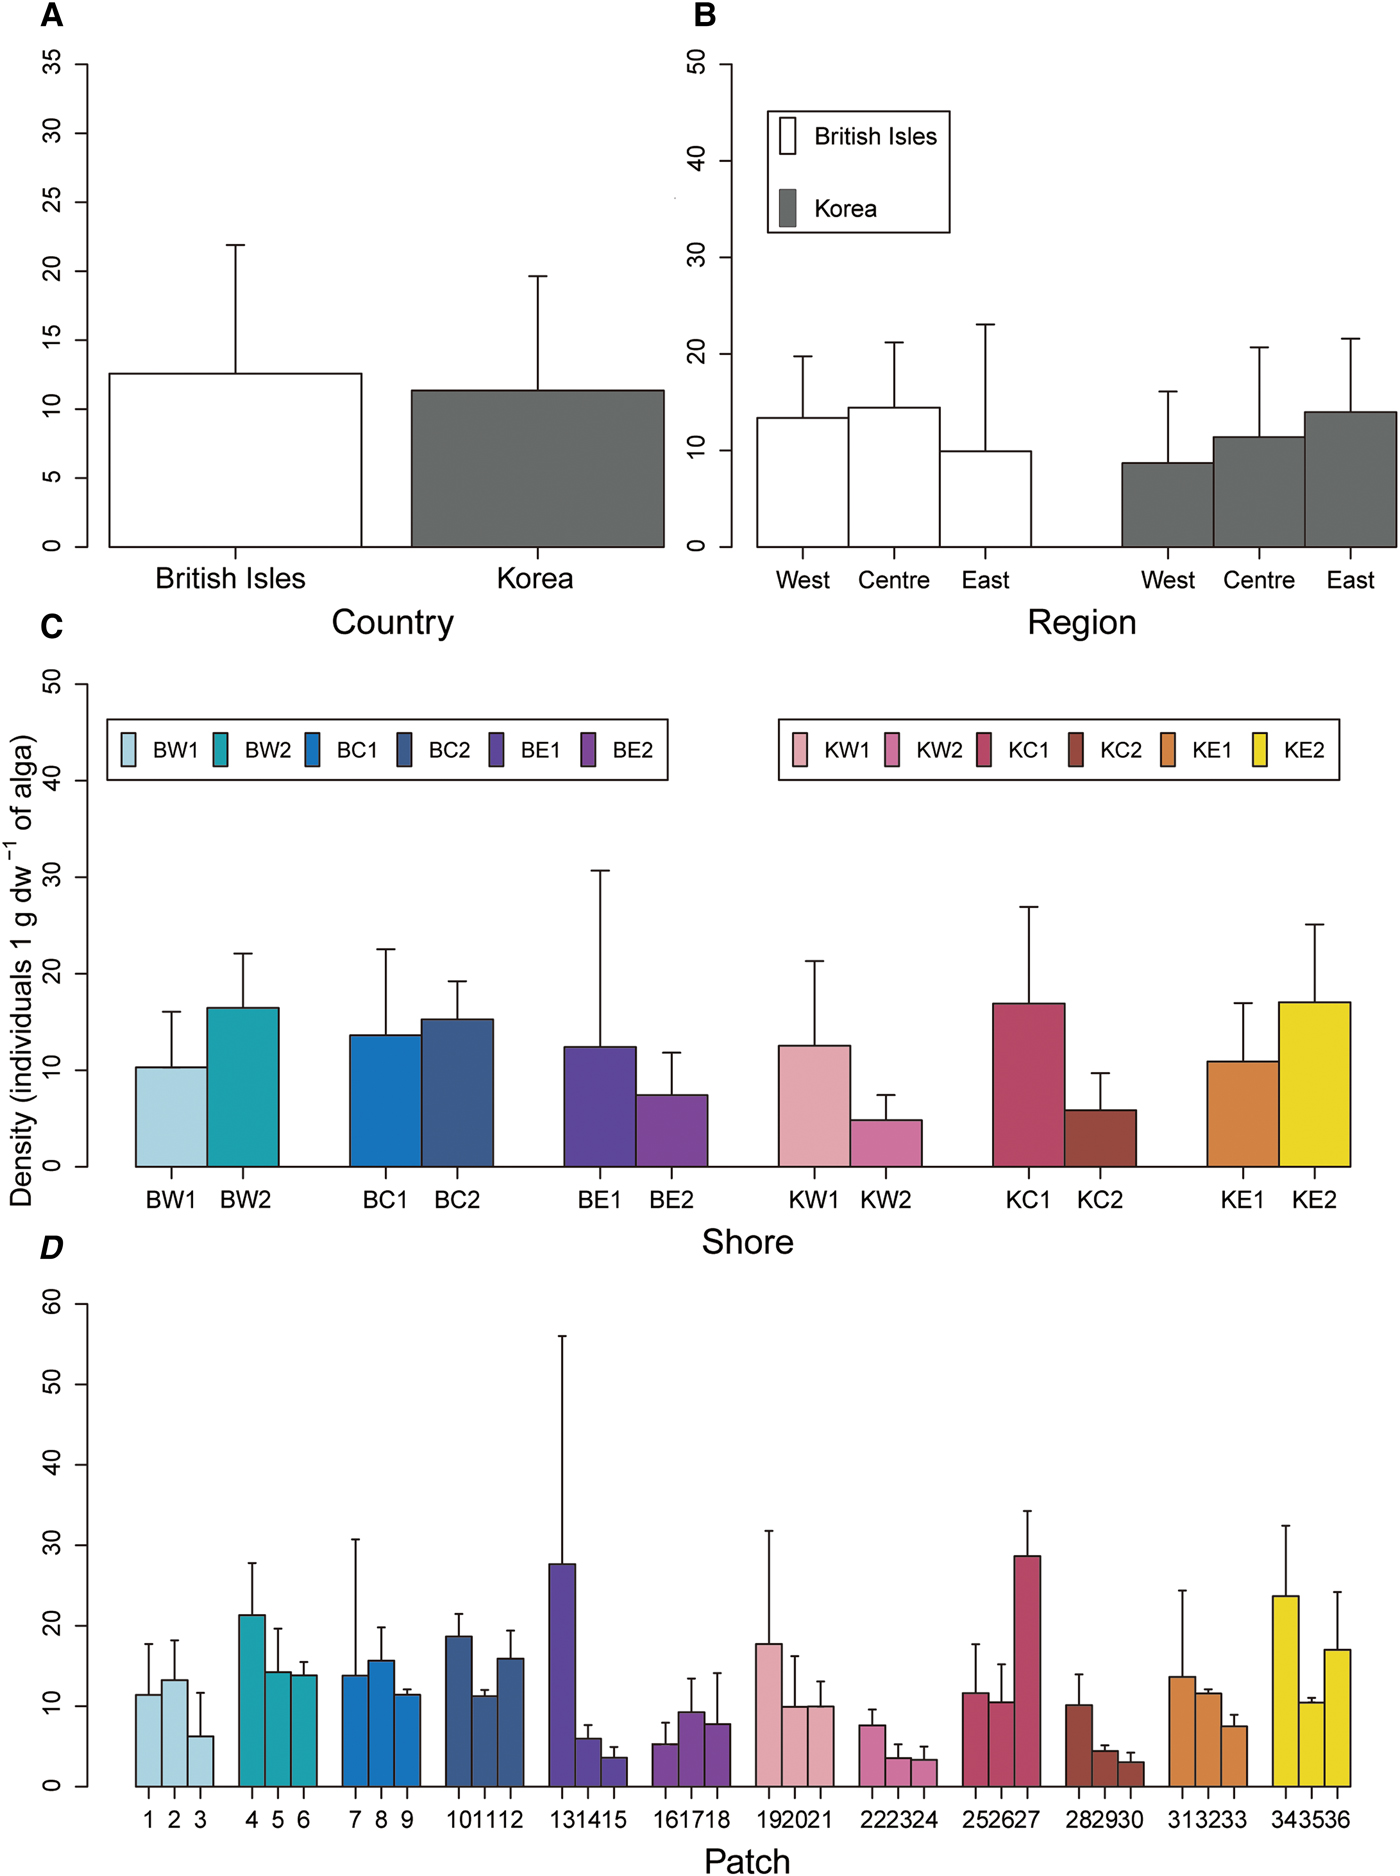
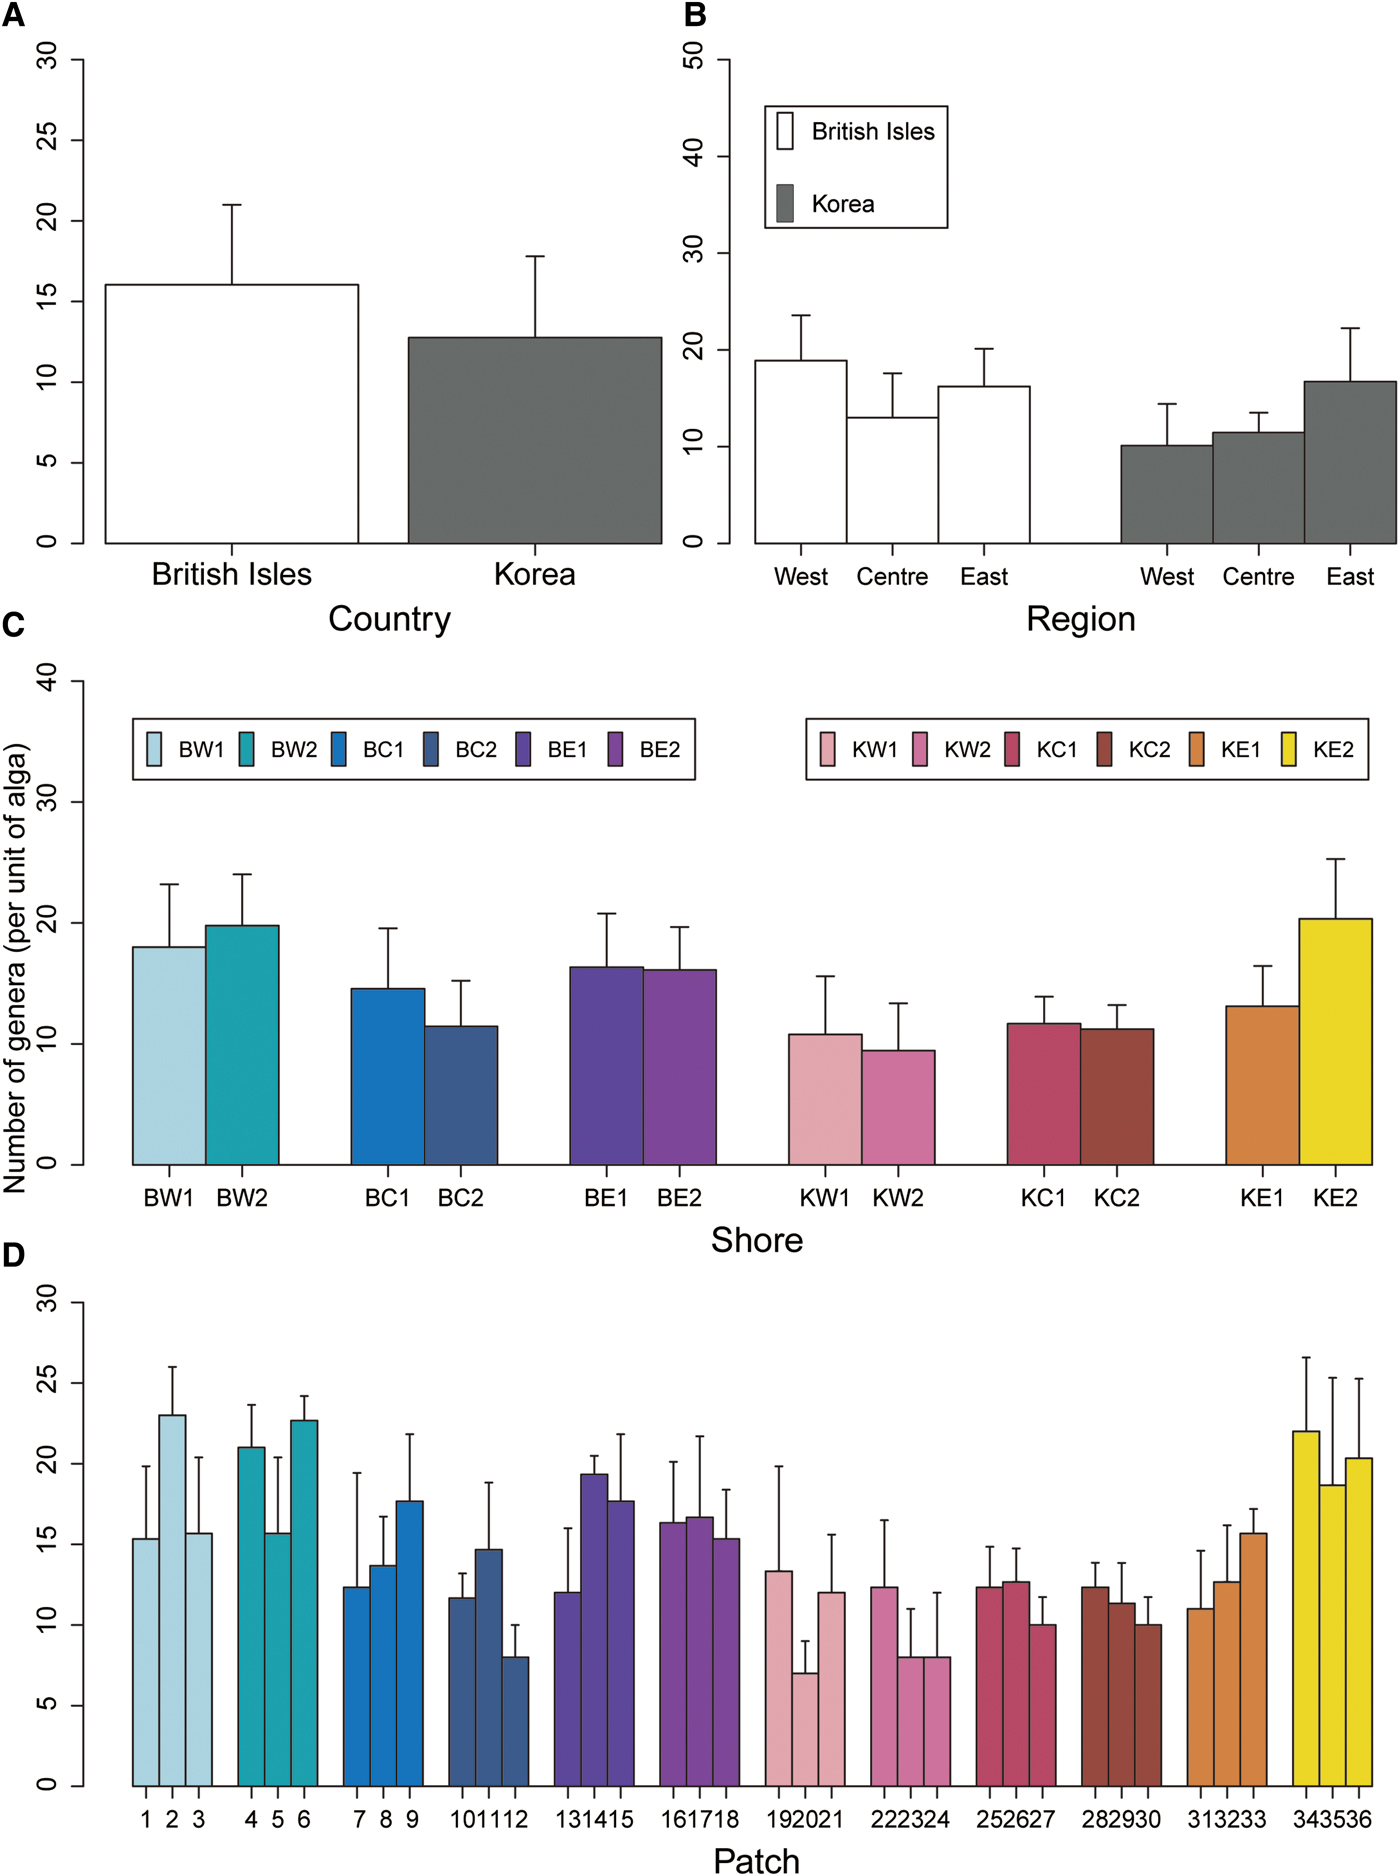
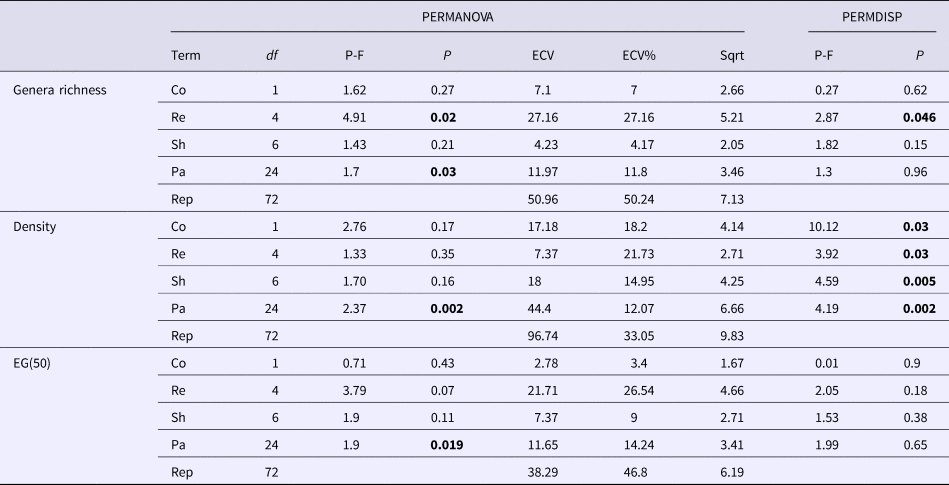
The density of nematodes living in Corallina spp. turves only differed at patch level (df = 24, P < 0.05), but not at other spatial scales (Figure 2 and Table 2). PERMDISP test, however, indicated significant heterogeneity of variances in nematode densities within patches (df = 35, P < 0.005), shores (df = 11, P < 0.05), regions (df = 5, P < 0.05) and countries (df = 1, P < 0.05) (Table 2). The number of genera were significantly different among patches (df = 24, P < 0.05) and among regions (df = 4, P < 0.05), but not between shores and countries (Figure 3 and Table 2). A significant PERMDISP for the factor region suggests that the effect of region may have been due to heterogeneity of variances, rather than by a real factor effect (Table 2). The Estimated Genus number (EG(50)) was only significantly different among patches (df = 24, P < 0.05), but not at other spatial scales (Table 2). The PERMDISP test showed no significant dispersal effect within each spatial scale (Table 2). The density in Busan was the highest across all shores in both countries. Namhae had the lowest density in all geographic regions. In terms of number of genera, Busan was the most diverse shore across all geographic regions. In contrast, Yeosu was the least diverse among the shores. The average range of nematode density per gram of plant material in patches was between 5–30. The average range of the number of genera in patches was 26–60.
Mean density of nematode assemblages with standard deviation at all spatial scales: (A) Country level, (B) Region level, (C) Shore level, (D) Patch level. BW1: Looe; BW2: Heybrook Bay; BC1: Portland Bill; BC2: Swanage; BE1: Brighton; BE2: Beachy Head; KW1: west-Wando; KW2: east-Wando; KC1: Yeosu; KC2: Namhae; KE1: Gueje; KE2: Busan.

Mean number of genera in nematode assemblages with standard deviation in all spatial scales: (A) Country level, (B) Region level, (C) Shore level, (D) Patch level. BW1: Looe; BW2: Heybrook Bay; BC1: Portland Bill; BC2: Swanage; BE1: Brighton; BE2: Beachy Head; KW1: west-Wando; KW2: east-Wando; KC1: Yeosu; KC2: Namhae; KE1: Gueje; KE2: Busan.

Nested PERMANOVA and PERMDISP results for genera density, richness and the estimated genus number

Co, Country; Re, Region; Sh, Shore; Pa, Patch; Rep, Replication; df, degree of freedom; P-F, Pseudo-F; ECV, Estimate Components of Variation; ECV%, percentage of ECV; Sqrt, square root of ECV.
Bold values: P < 0.05.
Comparisons of species compositions across all geographic scales
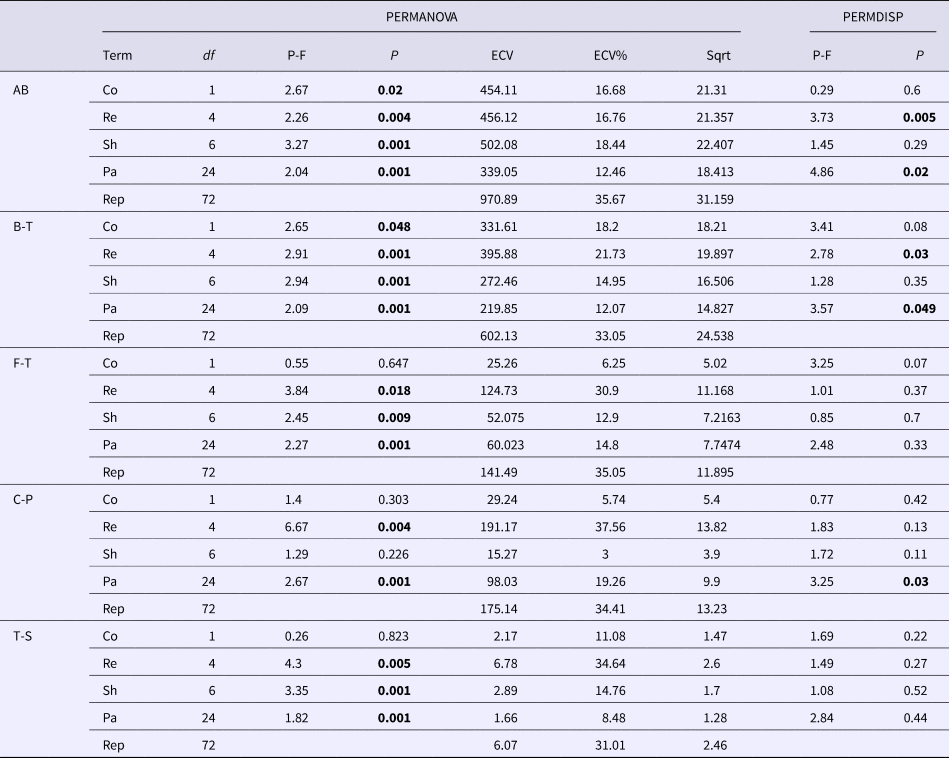
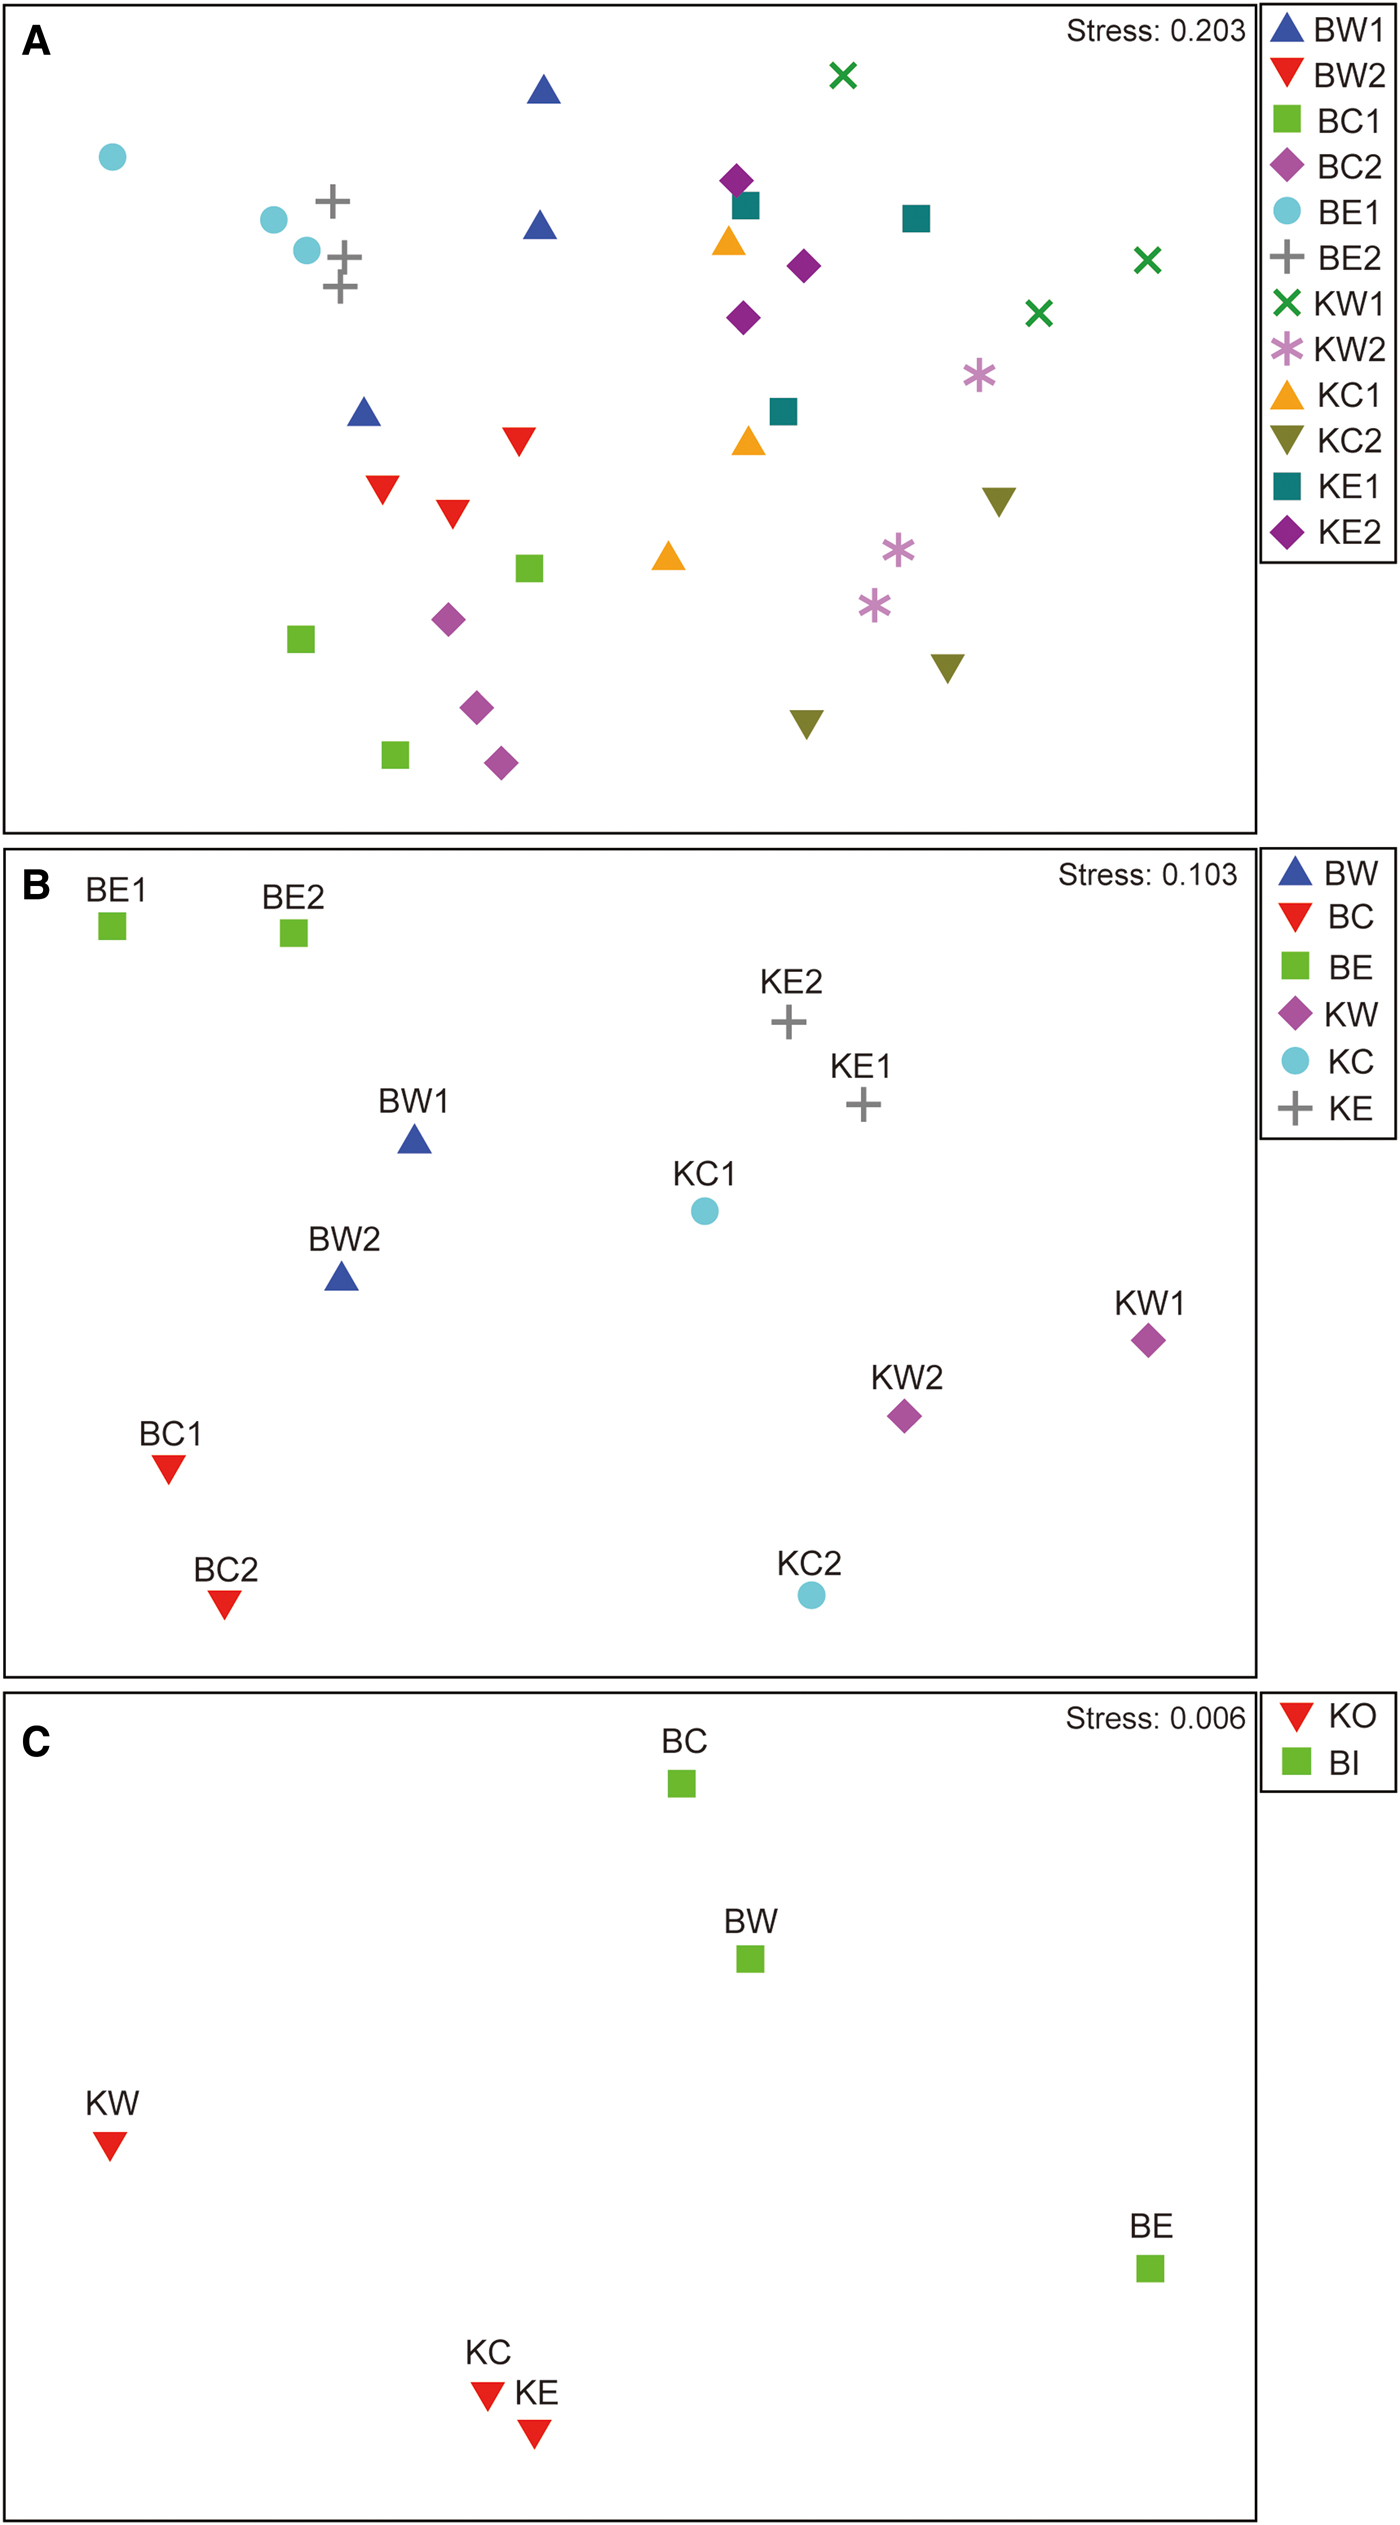
Nested PERMANOVA with Monte Carlo tests demonstrated that composition of genera differed significantly between countries (P < 0.05), regions (P < 0.05), shores (P < 0.001) and patches (P < 0.001) (Table 3). PERMDISP test showed a significant dispersion effect within patches (df = 35, P < 0.05), and regions (df = 6, P < 0.005), but not at the other spatial scales, suggesting that the differences among patches and regions may have been caused by heterogeneous variances rather than by a real factor effect. The Estimates of Component Variation in PERMANOVA indicated that among shore variation in nematode assemblage composition was greater than the other three spatial scales (Table 2). The nMDS showed clear differences at all spatial scales (Figure 4), and particularly between countries and among regions in the British Isles. In contrast, no clear differences were apparent among regions in South Korea.
Nested PERMANOVA and PERMDISP results for the different measurements

Co, Country; Re, Region; Sh, Shore; Pa, Patch; Rep, Replication; df, degree of freedom; P-F, Pseudo-F; ECV, Estimate Components of Variation; ECV%, percentage of ECV; Sqrt, square root of ECV; AB, genera abundance; B-T, biological traits; F-T, feeding type; C-P, life history strategies; T-S, tail shape.
Bold values: P < 0.05.
Non-parametric multi-dimensional scaling (nMDS) ordination based on the standardized abundance of nematode genera at three spatial scales: (A) Patch, (B) Shore, (C) Region. BW1: Looe; BW2: Heybrook Bay; BC1: Portland Bill; BC2: Swanage; BE1: Brighton; BE2: Beachy Head; KW1: west-Wando; KW2: east-Wando; KC1: Yeosu; KC2: Namhae; KE1: Gueje; KE2: Busan.

In total, 8532 individuals were identified as belonging to 128 genera along the south coast of Britain and South Korea combined, in June and July in 2014. The top five ranked taxa together accounted for 53% of total nematode abundance: Enoplus (18%), Euchromadora (13%), Crenopharynx (10%), Cyatholaimus (7%), Chromadora (5%). Over 100 taxa each contributed less than 1% to total abundance. The most widely distributed nematode genus in both countries was Enoplus, followed by Cyatholaimus and Euchromadora. The SIMPER test also indicated that Enoplus and Euchromadora contributed the most to the dissimilarity between countries (Appendix 1). Several nematode species and genera were common in particular geographic locations: Phanoderma wieseri, Phanoderma segmentum and Desmodora were the most abundant taxa in Britain; whereas Chromadora and Retrotheristus were dominant in South Korea. Some rare nematode species appeared to be unique to particular locations: Gomphionema sp. (Heybrook Bay), Hypodontolaimus sp. and Prochromadorella sp. (Beachy Head), Morlaixia sp. and Ditlevsenella sp. (Busan), Ascolaimus sp. (Geoje) and Diplolaimelloides sp. (Namhae).
Biological traits across all geographic scales
The dominant feeding-type was epigrowth feeders (43%), followed by predators/omnivores (33%), selective deposit feeders (13%) and then non-selective deposit feeders (11%) (Figure 5). Similar feeding type compositions were present in both countries, but a PERMANOVA test showed clear differences among regions (P < 0.05), among shores (P < 0.05) and among patches (P < 0.05) (Table 3). The PERMDISP test showed no dispersion effects at each spatial scale, indicating that real differences occurred in nematode feeding-type composition at the levels of within region, within shore and within patch (Table 3).
Trophic composition of nematode assemblages based on average percentages at all spatial scales. The feeding types are defined after Wieser (Reference Wieser1953). (A) Country level, (B) Region level, (C) Shore level, (D) Patch level. 1A, selective deposit feeders; 1B, non-selective deposit feeders; 2A = epigrowth feeders; 2B, predators/omnivores. BW1: Looe; BW2: Heybrook Bay; BC1: Portland Bill; BC2: Swanage; BE1: Brighton; BE2: Beachy Head; KW1: west-Wando; KW2: east-Wando; KC1: Yeosu; KC2: Namhae; KE1: Gueje; KE2: Busan.

The c-p score was calculated for each spatial scale, but did not differ at the country and at the shore level. Significant differences were, however, found among patches (df = 24, P < 0.005) and regions (df = 4, P < 0.005) (Table 3). Nematode species with a c-p value of 3 (indicating a moderate length of life and investment in reproduction) formed the most dominant component (35%) across both countries. PERMDISP test only found significant heterogeneity of variances at the patch level (df = 35, P < 0.05) (Table 3).
The most dominant tail shape was conical (34%) followed by short/round (28%), conicocylindrical (24%) and long tail types (13%). A PERMANOVA test based on tail shape showed significant differences among patches (P < 0.001), shores (P < 0.001) and regions (P < 0.05), but not between countries. PERMDISP was not significant at any of the spatial scales (Table 3).
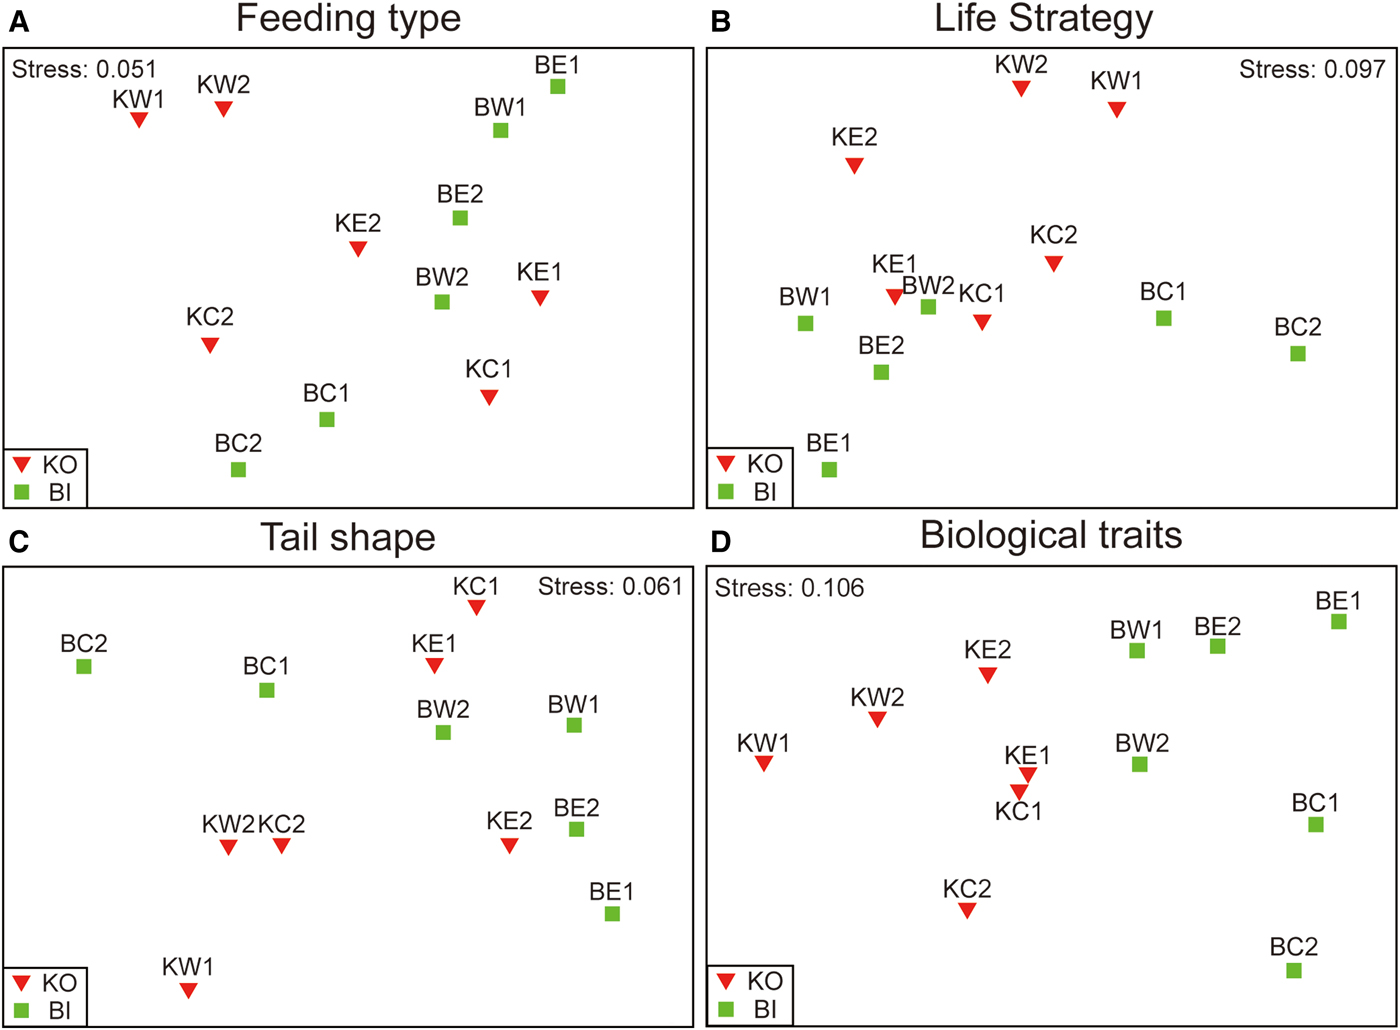
The nMDS plot based on the feeding type, life history strategy and tail shape showed clear differences between shores and among regions (Figure 6). This biological trait-based nMDS plot showed a similar pattern to the nMDS plot based on taxonomic abundance data indicating a clear difference between countries (Figure 6). A PERMANOVA test also showed significant differences in biological traits at all spatial scales; significant PERMDISP values nevertheless call for a cautionary interpretation of the differences at the patch (df = 35, P < 0.05) and regional scales (df = 5, P < 0.05) (Table 3). A RELATE test showed that biological traits composition was strongly correlated with nematode genus composition (R = 0.8, P < 0.001).
Non-parametric multi-dimensional scaling (nMDS) ordination based on the standardized abundance of nematode feeding type (A), life strategy (B), tail shape (C) and biological traits (D) in shore level. BW1: Looe; BW2: Heybrook Bay; BC1: Portland Bill; BC2: Swanage; BE1: Brighton; BE2: Beachy Head; KW1: west-Wando; KW2: east-Wando; KC1: Yeosu; KC2: Namhae; KE1: Gueje; KE2: Busan.

Relationships between abiotic factors and nematode assemblages
Nematode densities were significantly positively correlated with sediment retention (Spearman's R = 0.227, N = 108, P < 0.05) and nematode general richness also showed significant, positive correlations (R = 0.272, N = 108, P < 0.05). A BEST test using similarity matrices derived from relative nematode abundance and biological traits (feeding type, life strategy and tail shape) indicated that nematode assemblage composition was significantly positively correlated with the combination of SST and tidal range (R = 0.401, P < 0.001). The feeding-types composition of nematode were significantly positively correlated with the Oceanic index (R = 0.136, P < 0.001). Predators/omnivores were relatively more abundant on the shores in Oceanic index 3. C-p score was significantly correlated with the combination of SST, tidal range and the amount of sediment retention (R = 0.130, P < 0.001).
Discussion
Commonality in abundant genera across oceans
Our work found similar dominant nematode genera such as Euchromadora, Enoplus, Chromadora and Eurystomina contributing more than 50% to the total nematode abundance in both countries. This suggests that several common nematode taxa occur in macroalgae of similar morphology (i.e. turf-forming or foliaceous species) worldwide. Moreover, the most dominant genera are the widespread taxa on geographic scales (Fonseca et al., Reference Fonseca, Soltwedel, Vanreusel and Lindegarth2010). This is consistent with previous studies on the distribution of free-living nematodes living in macroalgae that found common nematode species on different types of macroalgae, although the dominant species on each alga seemed to vary (Wieser, Reference Wieser1959; Heip et al., Reference Heip, Vincx and Vranken1985; Da Rocha et al., Reference Da Rocha, Venekey, Bezerra and Souza2006; De Oliveira et al., Reference De Oliveira, Derycke, Da Rocha, Barbosa, Decraemer and Dos Santos2016). The density and size of nematodes have been correlated with the morphological shape of macroalgae and the amount of detritus trapped (Heip et al., Reference Heip, Vincx and Vranken1985; De Oliveira et al., Reference De Oliveira, Derycke, Da Rocha, Barbosa, Decraemer and Dos Santos2016); similarly, we found more nematodes and a higher diversity in samples with the most sediment and algal material. In foliaceous algae from exposed coasts, small Chromadoridae were dominant, representing ~70% of total abundance (Da Rocha et al., Reference Da Rocha, Venekey, Bezerra and Souza2006). In contrast, turf-like algae, including Corallina, from exposed coasts had large numbers of Enoploidea (Wieser, Reference Wieser1959). Our data also showed that Enoplus was the most widespread and dominant genus across both countries, which supports the results of previous studies (Heip et al., Reference Heip, Vincx and Vranken1985; Kim et al., Reference Kim, Hawkins, Godbold, Oh, Rho and Hawkins2019). This indicates that a few abundant genera in Corallina spp. were also the most widespread genera across all spatial scales.
Differences at different spatial scales
In our study, nematode density and genus richness, including expected number of genera (EG(50)), were only significantly different at smaller spatial scales (patches) and not on larger scales (regions and countries). This suggests that nematode genus richness at small scales varies due to available resources and/or local environmental conditions and/or local species interactions. The overall density of nematodes at small scales mainly depends on the amount of dominant nematode genera colonizing a patch of habitat. At larger scales, however, the number of nematode taxa was similar in both countries, suggesting a very similar role for Corallina spp. as habitat provider in different oceans.
Despite nematode genus richness being similar within regions and countries, the nematode genus composition was significantly different at all spatial scales. The small-scale heterogeneity was also found in previous studies indicated by aggregation of dominant nematode species (Blome et al., Reference Blome, Schleier and van Bernem1999; Kelaher et al., Reference Kelaher, Chapman and Underwood2001). At shore-level scale, nested PERMANOVA with Monte Carlo test showed the highest Estimated Component Variation among all spatial scales (Table 2). The most dominant genus on each shore was different (SIMPER tests in Appendix 1). This suggests that nematode assemblage composition varied in response to the surrounding local environment such as seawater temperature and sediment retention. Nevertheless, PERMANOVA compares variability between groups at different spatial scales (e.g. between countries, and among regions, patches) and not necessarily similarity. The different effect sizes related to sampling effort at different scales may have affected the result of the analysis.
Relationship with environmental factors
The relationship between environmental factors and intertidal nematode communities has been reported in several previous studies (Heip et al., Reference Heip, Vincx and Vranken1985; Danovaro & Gambi, Reference Danovaro and Gambi2002). The composition and abundance of epiphytic nematode communities were affected by wave exposure, water temperature, changes in nutrient availability and sediment accumulation or the combination of these environmental factors (Gibbons, Reference Gibbons1988; Moens et al., Reference Moens, Braeckman, Derycke, Fonseca, Gallucci, Gingold, Guilini, Ingels, Leduc, Vanaverbeke, Colen, Vanreusel, Vincx and Schmidt-Rhaesa2013).
De Oliveira et al. (Reference De Oliveira, Derycke, Da Rocha, Barbosa, Decraemer and Dos Santos2016) reported that sediment retention in the alga Halimeda opuntia increased nematode richness and was positively correlated with abundances of Euchromadora and Draconema. They showed that sediment accumulation by seaweeds did not, however, lead to higher overall nematode density. By contrast, our results did show a positive correlation between both number of nematode genera and nematode density with the amount of sediment retained by Corallina. Nematode assemblage composition on each shore seemed to be affected by the sediment accumulation by Corallina spp.: for example, the shores on the south-west of South Korea (KW1 and KW2) were characterized by high sediment retention in Corallina spp. leading to dominance by Crenopharynx that is commonly found in sediments.
At the regional and country level, the nMDS plot showed clear differences between regions in both countries, and between countries (Figure 4). Nematode assemblage composition was clearly divided into three regions (west, centre and east) in Britain; while only two regional groupings (west and east) were found in South Korea. This probably reflects the geography and oceanography of both countries. Oceanic water flows from south-west to south-east coasts of Britain, including up the English Channel (Pingree & Griffiths, Reference Pingree and Griffiths1980). The Tsushima Warm Current to the south-east, and the Yellow Sea current from west to east converge on the south coast of South Korea (Huh, Reference Huh1982). These different current systems might cause the differences in regional patterns of nematode composition between each country. At the country level, biogeographic and evolutionary processes might play an important role in the taxonomic variation of nematode composition between biogeographic realms (Witman et al., Reference Witman, Etter and Smith2004). Although the dominant nematode genera were similar, more nematode taxonomic or molecular studies would be needed to investigate biogeographic differences between two countries, preferably working at the species rather than generic level of taxonomic resolution. Moreover, BIOENV tests showed that broader scale factors such as tidal range and sea-surface temperature had the best matches with nematode abundance. This suggests that the variation in nematode genus composition on shores was determined by a combination of environmental factors operating at local, regional and broader geographic scales.
Functional vs taxonomic classification
In terms of biological traits, increasing species richness potentially enhances functional diversity (Petchey & Gaston, Reference Petchey and Gaston2006). To date, many studies have investigated the relationship between functional diversity and taxonomically based species diversity (Walker et al., Reference Walker, Kinzig and Langridge1999; Petchey & Gaston, Reference Petchey and Gaston2002; Mouillot et al., Reference Mouillot, Mason, Dumay and Wilson2005); but only a few studies have used a combined multiple biological traits approach in considering free-living nematode communities (Schratzberger et al., Reference Schratzberger, Warr and Rogers2007; Armenteros et al., Reference Armenteros, Ruiz-Abierno, Fernández-Garcés, Pérez-García, Díaz-Asencio, Vincx and Decraemer2009; Pérez-García et al., Reference Pérez-García, Ruiz-Abierno and Armenteros2015). Armenteros et al. (Reference Armenteros, Ruiz-Abierno, Fernández-Garcés, Pérez-García, Díaz-Asencio, Vincx and Decraemer2009) showed no significant temporal and spatial variation of functional nematode diversity in a semi-enclosed tropical bay in contrast to differences in taxonomic diversity; whilst Schratzberger et al. (Reference Schratzberger, Warr and Rogers2007) found clear spatially related functional differences in nematode communities in the south-western North Sea. Our results also showed significant differences in the combined biological traits matrix at all spatial scales; but this was not clear when considering single functional traits (Table 3).
Comparison of assemblage composition and community structure based on a taxonomic approach seems more powerful than using biological traits (Schratzberger et al., Reference Schratzberger, Warr and Rogers2007; Armenteros et al., Reference Armenteros, Ruiz-Abierno, Fernández-Garcés, Pérez-García, Díaz-Asencio, Vincx and Decraemer2009). Moreover, the three traits considered here (feeding type, c-p score and tail shape) are often not independent of each other, and this may well explain why we have found only half of the theoretically possible trait combinations. For instance, most predators/omnivores from Wieser's (Reference Wieser1953) classification have a c-p score of 4 or 5 and filiform tails are rare in this group; on the other hand, most epigrowth feeders are in c-p group 3. Therefore, there is probably not an equal chance of finding all c-p groups and all tail groups, particularly within predators/omnivores or within epigrowth feeding groups.
Although some limitations of the use of biological traits were apparent, our results indicated that common trait groups appeared across all spatial scales. Two trait groups (epigrowth feeder/c-p value 3/tail conical, and predators/omnivores/c-p value 5/tail round/short) were obviously dominant. They appeared across all spatial scales indicating a few cosmopolitan genera (i.e. Euchromadora and Enoplus). These two trait groups appeared at all spatial scales. Several shores were distinguished from other shores indicating local prevalence of a particular dominant biological trait. For example, feeding type and tail shapes were strongly influenced by the amount of sediment in Corallina spp. (KW1 and KW2). Long lifespan and short/round tail shapes were dominant traits on relatively exposed shores (BC2). This indicates that the role of nematodes in ecosystem functioning changes with the characteristics of the surrounding environment such as sediment retention, wave action and nutrient resources.
Moreover, the two most abundant biological trait combinations include both abundant and rare genera based on taxonomic classification. Our results showed that 21 genera shared the most-dominant combination across all spatial scales. Although the abundant and rare genera can have similar roles, they could have different capabilities to respond to environmental changes and stresses (Hooper et al., Reference Hooper2005; Schratzberger et al., Reference Schratzberger, Warr and Rogers2007). Therefore, different environmental conditions at each spatial scale thus influence the importance of functional complementarity in structuring communities (Hooper et al., Reference Hooper2005; Schratzberger et al., Reference Schratzberger, Warr and Rogers2007).
In our results, taxonomically based nematode genera assemblage data were strongly correlated with biological traits data based on functional categories of nematode assemblages. This might indicate that increasing genus richness probably leads to increased biological trait diversity (Schratzberger et al., Reference Schratzberger, Warr and Rogers2007). Many previous studies have revealed that reduction in biological diversity (i.e. species richness and functional traits) negatively affect ecosystem functioning and services in different environmental scenarios (Isbell et al., Reference Isbell, Calcagno, Hector, Connoly, Harpole, Reich, Scherer-Lorezen, Schmid, Tilman, Van Ruijven, Weigelt, Wilsey, Zavaleta and Loreau2011; Cardinale et al., Reference Cardinale, Duffy, Gonzalez, Hooper, Perrings, Venail, Narwani, Mace, Tilman and Wardle2012; Piot et al., Reference Piot, Nozais and Archambault2013). Identification of which and how many species play a role in communities across different spatial scales is essential for a more integrated and complete understanding of biological influences in ecosystem processes (Horner-Devine et al., Reference Horner-Devine, Carney and Bohannan2004).
Concluding remarks
In our study, both taxonomic and functional assemblage compositions were affected by the environmental characteristics of the shores. A much greater variability occurred at the spatial scales of shores than at larger spatial scales. This indicates that the role of habitat provision by Corallina spp. for nematodes differs with the surrounding environment. Abiotic factors clearly influenced genus composition, abundance and diversity at local, regional and country scales, being influenced by tidal range, SST and sedimentary characteristics. Therefore, both taxonomic and functional composition based on biological traits differed across all spatial scales. Although two dominant trait groups, seen as a few dominant genera, frequently occurred at all spatial scales, feeding type and c-p scores were clearly affected by the amount of sediment in Corallina spp.
Supplementary material
The supplementary material for this article can be found at https://doi.org/10.1017/S0025315419000523
Acknowledgements
We are grateful to Marine Ecology lab members in Pukyoung National University for assistance in field and laboratory work in Korea. We also thank Katrin Bohn for help with fieldwork in the British Isles. We thank the editorial team and referees for their input to improve this paper and their patience.
Financial support
This research was supported by the Marine Biotechnology Program of the Korea Institute of Marine Science and Technology Promotion (KIMST) funded by the Ministry of Oceans and Fisheries (MOF) (No. 20170431) and Ocean and Earth Science, University of Southampton.