Firm dynamics are fundamental features of economic growth and business cycles. How firm entry and exit can mitigate or propagate aggregate shocks in current advanced economies has received extensive attention in the literature. But these dynamics are not known or well studied in historical settings despite the distinctive significance of creative destruction for understanding industrialization. Especially in the periphery, where many countries had become dependent on a small mix of agricultural exports by the late nineteenth century, frictions in capital and labor markets might have distorted firms’ decisions to enter a market, adopt new technologies, expand, or wind up. Such frictions could have differential effects on small enterprises such as partnerships, which characterize most firms in these settings. This paper helps close this empirical deficit by studying the entry and exit dynamics of all multiowner firms in Alexandria and Cairo, Egypt, between 1911 and 1948.
Egypt was a classic example of a price-taking economy in the periphery in the turbulent first half of the twentieth century. It gained nominal independence in 1922, but, like many semi-colonial settings, the government’s ability to make meaningful economic policy was limited. Having been integrated into world markets during the first era of globalization, Egypt remained dependent on cotton exports. But disruptions in cotton prices during the interwar period led to wide fluctuations in the Egyptian economy. This paper takes advantage of these short-term price changes to identify the impact of exogenous aggregate shocks on firm dynamics. How did entry and exit change across the business cycle? Were firms established during expansionary periods systematically different than enterprises established during contractionary spells? What do these dynamics reveal about Egypt’s experience as a late industrializer? I investigate these questions by relying on a new dataset that spans all multiowner firms—more than 11,000 partnerships and corporations—established in Alexandria and Cairo between 1911 and 1948.Footnote 1 In doing so, the paper advances our understanding of creative destruction and firm demography across the business cycle more broadly.
I aggregate firms by market segments (industry-location) and enterprise form. Merging these data with the Industrial and Commercial Census of 1937, I calculate lower bounds on entry and exit rates for each type of ownership. Partnership entry and exit rates were 5 and 4 percent on average, respectively, though significant differences between sectors were present. These figures are comparable to those of continental European and some developing South American economies such as Argentina today, but well below the firm turnover observed in high-growth developing countries (Bartelsman, Scarpetta, and Schivardi Reference Bartelsman, Scarpetta and Schivardi2005). Firm churning—the sum of birth and death rates—increased as Egypt industrialized. By the 1940s, these rates were more in line with those of emerging economies that had entered a stage of industrial take-off. A series of industry-level empirical exercises on business cycles reveal substantial differences in adjustment margins across enterprise forms. Partnerships had procyclical entry but acyclical exit. Corporate entry and exit, however, were both acyclical. Utilizing firm-level data, I show that there was selection across the phases of the business cycle. Expansionary partnership cohorts were smaller, had fewer partners, and died earlier relative to recessionary cohorts. In contrast, corporations established during upturns were not significantly different from those established during downturns.
The new findings highlight important features of firm dynamics and adjustment margins in economic history. Recessions imposed significant barriers to entry on unincorporated enterprises; during downturns, only productive firms could enter. But less-productive incumbents did not necessarily exit. So, the economy adjusted to an exogenous aggregate shock through the extensive margin of entry. My empirical exercises show that severe recessions—such as the collapse of cotton prices in 1920–21, 1926, and the 1930s—led to a permanent decrease of 10 percent in the number of entrants. As a result, Egypt’s dependence on cotton, and the volatility of these cotton markets in the interwar period, had significant growth-dampening effects. Second, my results show that cyclical selection did not occur in the corporate sector due to high legal barriers to entry. Egypt did not have a general law of incorporation; setting up a corporation required an authorization decree from the government. This was a long and costly procedure that led to significant distortions. Having gone through such a laborious process, corporate cohorts did not differ in observable characteristics between one another depending on the cycle. They had been already screened and selected into entry due to high institutional obstacles. These high barriers to incorporation likely introduced further distortions to entry dynamics and muted creative destruction.
The role of cotton price movements in Egypt’s aggregate fluctuations allows me to establish new connections among the literatures on firm dynamics, business cycles, and historical development. First, my results help sort through alternative theories of firm entry that disagree on whether potential entrants are ex ante informed or uninformed (Hopenhayn Reference Hopenhayn1992; Clementi and Palazzo Reference Clementi and Palazzo2016). My new evidence on cyclical selection supports ex ante heterogeneity. Second, my results highlight the “insulation” effect of recessions due to cyclical adjustment costs: less productive firms can be shielded if fewer businesses are created during downturns (Caballero and Hammour Reference Caballero and Hammour1994; Lee and Mukoyama Reference Lee and Mukoyama2015). The new results stress the importance of selection at the entry margin for better understanding adjustments over the business cycle. Third, my findings connect these theories to the experience of late industrializers in history. I show that cyclical adjustment costs muted creative destruction and insulated incumbents; these adjustment costs are more likely to appear in settings with significant capital market frictions and limited access to credit, as they did in interwar Egypt (Rampini Reference Rampini2004; Panza and Karakoç Reference Panza and Karakoç2021). My firm-level investigation also demonstrates how the interwar volatility of international commodity prices affected developing economies, whose dependence on a small mix of exports exposed them to erratic boom-bust cycles (Mendoza Reference Mendoza1995; Kose Reference Kose2002; Blattman, Hwang, and Williamson Reference Blattman, Hwang and Williamson2007; Fernández, Schmitt-Grohé, and Uribe Reference Fernández, Schmitt-Grohé and Uribe2017; Benguria, Saffie, and Urzúa Reference Benguria, Saffie and Urzúa2021; Drechsel and Tenreyro Reference Drechsel and Tenreyro2018; Mitchener and Pina Reference Mitchener and Pina2020, Reference Mitchener and Pina2022). The insulation effect exacerbated the growth-dampening impacts of this price volatility. Contractions in firm entry propagated and transformed temporary price shocks into persistent real declines, which weakened productivity growth. Thus, my findings reveal how firm dynamics—an understudied dimension of growth in economic history—help us better understand the slow pace of Egyptian industrialization during the interwar period (Karakoç, Pamuk, and Panza Reference Karakoç, Pamuk and Panza2017).
My results also highlight costly incorporation as a key institutional distortion. The acyclical corporate turnover in Egypt supports the view that these barriers were significant, consistent with recent findings in another late industrializer (Gregg and Nafziger Reference Gregg and Nafziger2020). A similarly arduous authorization system of incorporation in Imperial Russia prevented many manufacturing establishments from taking advantage of the corporate form, which likely led to large inefficiencies (Gregg Reference Gregg2020). In contrast, Meiji Japan promoted joint-stock organization through legislation and preferential taxes; these enterprises outperformed other businesses during Japan’s early phase of industrial development (Nicholas Reference Nicholas2015; Onji and Tang Reference Onji and Tang2017). So, limited access to the corporate form remains an important dimension of industrialization outside of the West. How legal obstacles affected corporate lifecycles is invaluable for developing a better understanding of industrial development.
FIRM DYNAMICS IN EGYPTIAN HISTORICAL CONTEXT
Several features of the Egyptian economy are important for studying firm entry and exit over the business cycle. Egypt remained a cotton-dependent export economy, operating under what was practically free trade. It had been under British occupation since 1882 and gained semi-independence only after 1923. Under British control, Egypt did not—and could not—pursue antitrade policies (Yousef Reference Yousef2000). Only after the tariff reform of 1930 and the Anglo-Egyptian Treaty of 1936 did the Egyptian government gain some discretion over its tariffs. Even then, it could merely implement a modest tax on the import of cotton manufactures (Tignor Reference Tignor1984; Issawi Reference Issawi1982). Until WWII, cotton continued to make up at least 80 percent of total exports each year, 67 percent of national output, and thus, a key determinant of growth (Yousef Reference Yousef2002; Panza Reference Panza2014). Cotton production financed fiscal revenue through taxes on land. It attracted foreign banks and foreign capital, which used profits from cotton to finance a wide range of enterprises.
The international cotton trade was one of the most developed and organized commodity markets. Prices in New York, Liverpool, Alexandria, and Bombay were all remarkably integrated (Yousef Reference Yousef2000, pp. 306–7). Egypt was a small actor in this market. Its production accounted for 2.9–6.6 percent of world supply and a negligible share of world demand, far outstripping that of the United States and India (Norris Reference Norris1934; Brandis Reference Brandis1953). Although Egypt was the chief producer of long-staple cotton, which had a price premium, its share in Egypt’s cotton output and export was surpassed by other varieties that directly competed with American and Indian cotton, especially after 1928 (Panza and Karakoç Reference Panza and Karakoç2021). The Egyptian long-staple variety Sakel was an expensive alternative, but the medium-staple varieties (e.g., Ashmouni) were easily substitutable for American cotton (Brandis Reference Brandis1953, p. 342). The prices of these varieties were strongly correlated. American Middling’s coefficients of correlation with Sakel and Ashmouni were 0.833 and 0.894, respectively, during the interwar period. Footnote 2 Thus, the reliance on cotton exposed the economy to the volatility of cotton prices, which were significant sources of aggregate fluctuations. My empirical exercises take advantage of this feature of the Egyptian economy and use changes in American Middling prices to identify exogenous turning points in Egypt’s business cycle.
The legal environment is another important historical dimension for investigating firm turnover in Egypt. The underlying commercial code was a close French transplant. It offered companies four enterprise forms. Ordinary (or general) partnerships consisted of two or more partners. All owners had unlimited liability and could potentially participate in management. Limited partnerships could be formed between at least one ordinary and one “special” partner. The special partners were liable only up to the amount they invested but could not have a say in management. The limited partnership with tradable shares (share partnerships, for short) resembled limited partnerships, except that the special partners’ contributions were assigned to shares and could be traded on the market. The corporation comprised at least seven partners (shareholders), all of whom had limited liability and could potentially exercise some degree of control over the company. The corporation’s company capital was also divided into tradeable shares. Footnote 3
There were two key differences between the partnership forms and the corporation. First, partnerships lacked legal personhood and existed at the will of their members. While partners could make provisions to prevent or reduce the impact of an untimely dissolution, these firms could still be broken up by any partner unilaterally. The corporation was much harder to dissolve; winding up usually required a supermajority of share capital. Second, general and limited partnerships could be set up in a matter of days. Founding a corporation, however, required the government’s authorization. It was a costly, time-consuming process that could take many months. It also became significantly more politicized over time, as granting corporate charters was one of the few things over which the government (still not fully independent) could exercise discretion. So, the authorization system was a significant distortion with anticompetitive implications for industries in which the corporate form could be advantageous (Gregg Reference Gregg2020). As a result, corporations might have sluggish, less responsive entry and exit adjustments. It also renders the results a little difficult to interpret since the government’s willingness to grant charters could have varied with the cycle.
Egypt had no corporate or personal income tax before WWII. The government had practically no control over its finances, even after its nominal independence in 1923. Because of capitulations—concessionary agreements signed with European powers in the nineteenth century—Europeans blocked any attempt to implement taxes on incomes, businesses, or imports (Brown Reference Brown1993). The only real source of public revenue was an outdated land tax that the British introduced in the nineteenth century. Egypt gained some fiscal discretion in 1936 when capitulations were abolished, but a lack of political momentum and the outbreak of WWII delayed a necessary tax reform (Tignor Reference Tignor1984). So, unlike other countries—notably, Japan (Onji and Tang Reference Onji and Tang2017)—the tax code could not have informed firms’ entry/exit decisions.
Theories of Firm Dynamics
The canonical theories of firm dynamics stress productivity differences as key determinants of entry/exit decisions. As long as net productivity is higher than some threshold pinned down by adjustment costs, potential entrants will enter, and incumbents will continue. But these models diverge in how they conceptualize firm heterogeneity. According to one view, firms are ex ante homogenous and uninformed about their latent quality. After entry, they learn about their productivity (Jovanovic Reference Jovanovic1982). Equivalently, post-entry productivity dispersion can emerge because of idiosyncratic shocks (Hopenhayn Reference Hopenhayn1992). This framework can generate procyclical entry but not selection. The alternative is a model of ex ante heterogeneous entrants, who receive signals about their latent productivity and enter if their expected discounted profits are greater than entry costs (Clementi and Palazzo Reference Clementi and Palazzo2016). These models can also generate procyclical entry, but distinctively, they predict selection due to a countercyclical productivity threshold of entry. Footnote 4 In the absence of ex ante heterogeneity, a positive aggregate shock will increase the number of entrants because incumbents cannot fully absorb the positive shock. Since there is no selection, entrants are no worse than incumbents. But, in the heterogeneous entrant model, a positive aggregate shock lowers the productivity threshold of entry, thereby inducing lower-quality firms to enter. There will be procyclical entry and a permanent increase in the number of incumbents, but because of selection, entrants have low productivity, and the average entrant is smaller (Decker, McCollum, and Upton Jr. 2022). My empirical exercises support the presence of cyclical selection effects by comparing the frailty of expansionary and recessionary cohorts as well as measuring the net effect on startup size and capital.
The heterogeneous entrant model has important implications for the propagation of cyclical shocks. Which margin—entry or exit—is more important when there is a recession? There are two possible effects (Caballero and Hammour Reference Caballero and Hammour1994). If the exit margin is more responsive, recessions will have a “cleansing” effect as low-productivity firms are outcompeted by more productive entrants. Differences between entrant cohorts will not be persistent. If the entry margin is more responsive than the exit margin, recessions will cause firm creation to decline, thereby shielding low-productivity firms from competitive pressures. In the presence of strong “insulation” effects, countercyclical entrant productivity will transform into persistent productivity differences between cohorts (Moreira Reference Moreira2017; Sterk, Sedláček, and Pugsley Reference Sterk, Sedláček and Pugsley2021; Cavallari, Romano, and Naticchioni Reference Cavallari, Romano and Naticchioni2021). So, the productivity dispersion among firms will be largely due to the presence of boom-bust cycles. Because firm dynamics are generally slow, the effects on aggregate variables will be persistent. Sharp declines in firm creation will stunt recovery (Gourio, Messer, and Siemer Reference Gourio, Messer and Siemer2016). Contraction in firm creation will reduce the extent of efficient churning and creative destruction (Kerr and Nanda Reference Kerr and Nanda2009). And if firm creation slows down for a long period, a “lost generation” of firms can permanently decrease productivity growth (Sedláček Reference Sedláček2020). These effects may be exacerbated in small open economies on the periphery, such as Egypt. Commodity price shocks are volatile, with typically sharp declines and slow recovery. As a result, developing economies tend to experience prolonged and more severe downturns (Rand and Tarp Reference Rand and Tarp2002). So, the nature of firm entry and exit help contextualize the historical challenges these countries faced in promoting development. Ultimately, identifying which margin of adjustment is more important and whether recessions have “insulation” or “cleansing” effects are empirical questions. My analysis investigates these questions by comparing partnership cohorts over the cycle and investigating if exogenous aggregate fluctuations indeed caused persistent effects on firm creation and quality.
DATA
This paper relies on a new, firm-level dataset assembled using registration and deregistration notices for more than 11,000 partnerships and corporations established in Egypt between late 1910 and early 1949. Under the commercial code, a French transplant, all companies were required to register and publish a notice or summary in the courts’ official newspaper for public disclosure. Footnote 5 Firms risked annulment if they did not register partnership agreements or modifications within two weeks of contracting. Footnote 6 Registration notices were published in the official, French-language newspapers of the courts: the monthly Gazette des Tribunaux mixtes d’Égypte (from now on, Gazette) between November 1910 and October 1921, and the triweekly Journal des Tribunaux mixtes d’Égypte (from now on, Journal). The Journal ceased its publication after 31 March 1949, after a legal reform that promulgated a new court system. Examples of establishment, modification, and dissolution notices are in the Online Appendix.
The firm’s establishment notice disclosed the firm’s legal name (which had to include the ordinary partners’ names), business name, legal form, date of formation, names of partners with unlimited liability, sector, capital, and location of legal office (usually only the name of town or city). Footnote 7 I also coded other firm characteristics, such as family ownership or whether the firm had Muslim partners, based on the partners’ names. The Online Appendix describes these details. Then, I matched each entry notice to subsequent modification and dissolution notices. Modification usually involved the addition or removal of a partner or changes made to the company’s capital. The dataset thus covers the lifecycle of each firm, from birth to death, ever established during the period of interest. Some firms had deregistrations but no registrations; these were established before 1 November 1910, which I was able to verify using commercial directories. I include these firms when I explore the rate of change in the aggregate number of dissolved companies but exclude them when I do the survival analysis.
Although the data represent almost the entire population of companies, deregistrations are not always reliable. By law, parties had to announce their firm’s dissolution. The law did not, however, specify how this rule was enforced. There are many examples of firms that dissolved but never deregistered. I imputed missing dissolution dates by tracing firms in the annual volumes of the Egyptian Directory, which published a comprehensive list of all businesses (among other addresses). By cross-checking every enterprise without a dissolution date in the directory, I identified the last year a firm appeared to be in operation. If a firm was listed in the directory in 1930 but not 1931, for example, I assumed it dissolved in 1930. This is consistent with firms that had deregistration notices, whose last appearance in the directory is the year of their deregistration.
The dataset has three important features. First, it covers (almost) all multiowner enterprises. Every company had to register; otherwise, it risked annulment. However, single proprietorships, which likely constituted most businesses, did not have to register. It is challenging to ascertain their significance in the Egyptian economy since they are unobserved. The only information on these firms comes from the Industrial and Commercial Census of 1937, according to which 87 percent of establishments in Alexandria and Cairo were organized as single proprietorships. They accounted for 1.3–2.3 percent of total capital and 16–28 percent of total employment there.Footnote 8
This is not unusual for similar datasets. Other studies on historical business organization, such as Nicholas (Reference Nicholas2015), Onji and Tang (Reference Onji and Tang2017), and Guinnane and Martínez-Rodríguez (Reference Guinnane and Martínez-Rodríguez2018), rely on registered firms and thus miss sole proprietorships. Gregg (Reference Gregg2020) captures all types of ownership but only in manufacturing, whereas Gregg and Nafziger (Reference Gregg and Nafziger2020) study all sectors but only include corporations. Many recent studies on firm dynamics in the United States use the Longitudinal Business Database, which captures nonfarm businesses organized as single proprietorships (or any other type of firm) as long the firm had at least one paid employee. This leaves out most single-ownership enterprises and partnerships. My dataset does not cover sole proprietorships but does include partnerships without any paid employees. So, the selection in my Egyptian dataset is broadly similar to what we find in the literature.
Second, ordinary partnerships were not required to disclose their capital. This is not a concern for the main result on procyclical entry and exit, but the conclusion on the countercyclical capital size of partnerships is subject to sample selection. The results on partnership capital should be taken as suggestive evidence. This also prevents a deeper analysis of overall capital formation, as partnerships accounted for at least half of all capital invested each year.
Third, since the Gazette and Journal only report firm creation and destruction, there is no information on incumbents. But calculating entry and exit rates, as used in Dunne, Roberts, and Samuelson (Reference Dunne, Roberts and Samuelson1988) and the subsequent literature, is possible with certain assumptions. The Industrial and Commercial Census of 1937 reports the number of establishments aggregated by region and industry. Assuming that the number of incumbent firms at the beginning of 1937 was equal to the number of establishments, I trace the number of incumbents each year using net firm flows from my dataset. Most partnerships likely were single-establishment firms. But many corporations might have had multiple establishments. I address this issue by using the statistical yearbook of Egyptian corporations from 1911, which lists all incumbent corporations at the beginning of 1911 (Egypt 1913). Having assembled the best estimates of incumbents each year, I calculate the entry rate in year t as the number of entrants during year t divided by the number of incumbents at the beginning of the same year. The exit rate is calculated similarly by dividing the number of dissolutions in year t by the number of incumbents at the start of year t. For partnerships, these should be taken as close lower bounds since some partnerships could have more than one establishment. My main empirical exercise uses log differences in entrants and exits, as does the recent literature on firm dynamics (Moreira Reference Moreira2017; Tian Reference Tian2018; Cavallari, Romano, and Naticchioni Reference Cavallari, Romano and Naticchioni2021), but I provide additional results using entry and exit rates with the assumption that all partnerships were single-unit establishments.
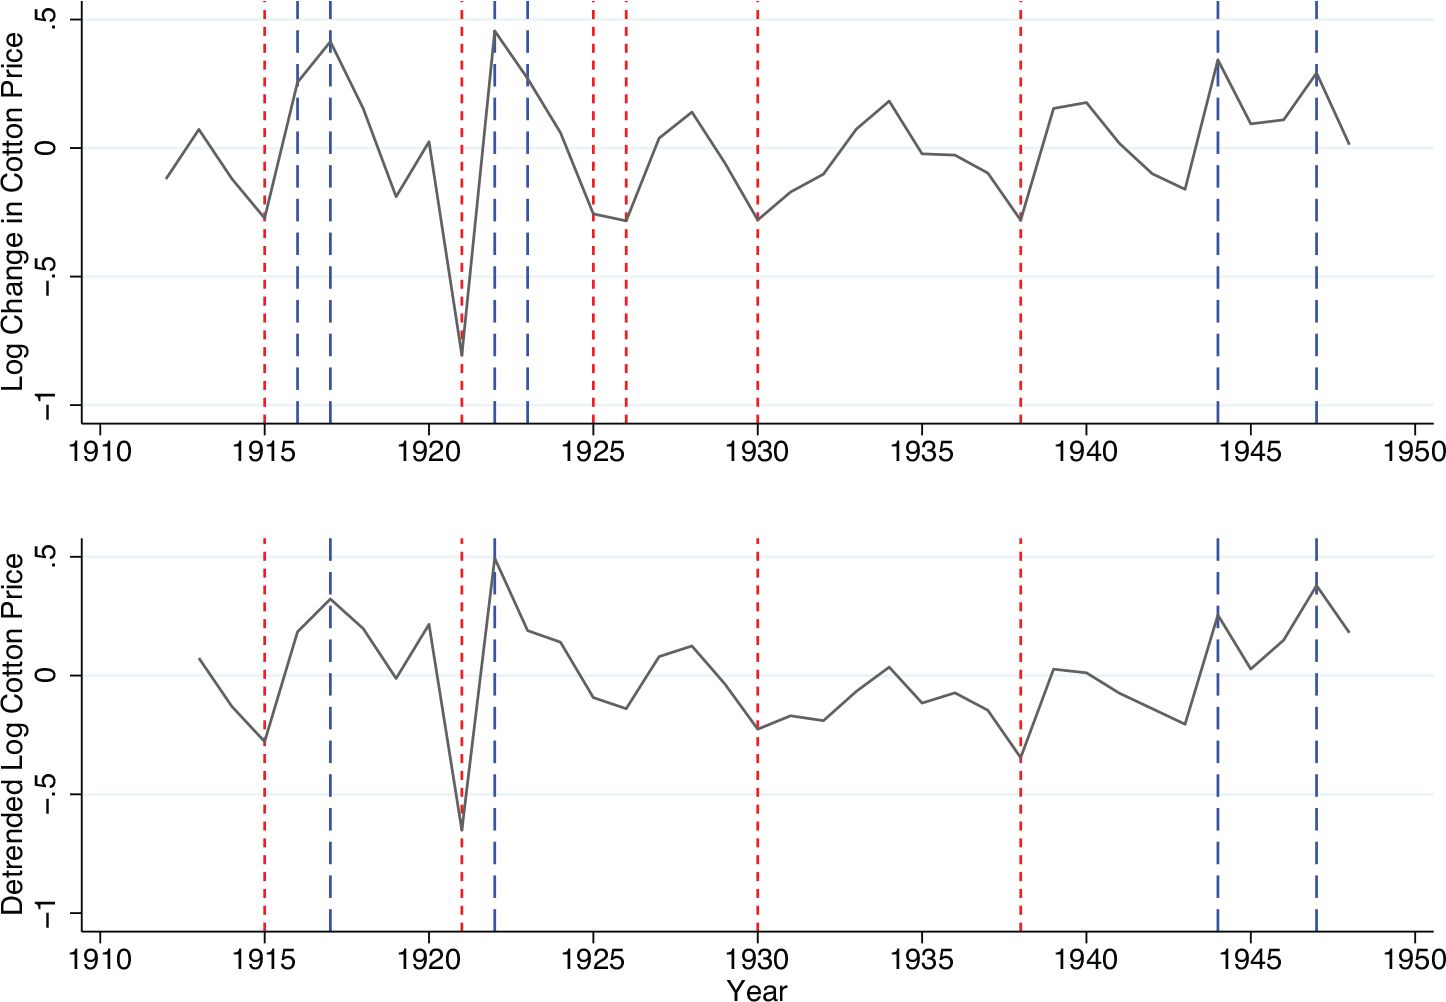
The other critical component of this empirical exercise is the international cotton price, for which I used American Middling in Britain (Mitchell Reference Mitchell1988). Footnote 9 As noted earlier, the prices of different cotton varieties moved closer together. However, to stress the exogeneity of price shocks (and due to Egyptian prices not being available from a single source), this paper’s preferred measure is the price of American Middling. I capture cyclicality in two ways: the demeaned log change in real prices and the residuals from regressing logged cotton prices on their first two lags and a linear time trend. Either procedure removes long-term trends successfully without making model assumptions about the long-run trend. Footnote 10 The two measures capture different aspects of the cycle, though they are highly correlated. Log differences stress year-to-year fluctuations, and the detrended series stresses the level relative to the long-run trend.Footnote 11 Figure 1 shows the log changes in prices and the detrended prices. These graphs also highlight “boom” and “bust” years, when the cotton price experienced a significant fluctuation (more than one standard deviation) relative to the previous year or over trend, thus representing particularly strong upturns or severe downturns. Broadly, both series identify the same years as booms or busts. The years 1921, 1926, and 1930 stand out, which the contemporary literature described as the “three great waves of depression,” caused by precipitous drops in cotton prices and characterized by significant declines in incomes (Crouchley Reference Crouchley1938, pp. 210, 213).
COTTON PRICE CYCLES
Notes: The top graph plots the demeaned log change in cotton prices. The bottom graph plots the residuals from regressing logged cotton prices on its first two lags, a constant term, and a linear trend. Short-dashed lines describe “busts,” where the cycle indicator was lower than negative one standard deviation. Long-dashed lines indicate “booms,” when the cycle indicator was above one standard deviation.
Source: Mitchell (Reference Mitchell1988).

The empirical exercises in this paper do not attempt to provide a complete description of business cycles in Egypt before 1948. Shocks that affected farm yields could well be other sources of aggregate fluctuations. The most important source of agricultural shock used to be variations in the flooding of the Nile. Thanks to extensive infrastructure investments in dams, canals, drainage, and other irrigation projects, flooding was brought firmly under control in the early 1900s. The other important sources of short-term shocks were insect attacks or diseases. The pink bollworm, which appeared in 1913, was especially destructive, but simple heat treatments of cotton seeds at the gin, required by law, provided significant protection. Ashmouni and Zagora, the chief Egyptian varieties by acreage and output, were resistant to cotton wilt, the principal plant disease in the country. Annual fluctuations occurred due to government interventions. Fearing food shortages, the government restricted cotton acreage in 1915 and 1942. The world wars created significant supply shocks, causing acreage and output to vary widely. But acreage reductions in the interwar period were not enforced, and yields increased steadily. Footnote 12 Given the confounding effects that the wars imposed, I performed additional checks by restricting the sample to the interwar period.
Finally, I collected the monthly prices of British consols and Egyptian government bonds—dette unifiée between 1911 and 1943, “National Loan” from 1944 onward—using the Economist as well as the Journal (only for the National Loan) to calculate the yields of both securities. Yields on British consols represent the risk-free rate in this era. The yield spread can be used as a proxy for the cost of capital. The literature has utilized the yield spread to this effect before, notably for colonial Egypt (Hansen Reference Hansen1983).
My analysis distinguishes completely new entries from mergers or takeovers. I coded any firm that went through substantial restructuring as an entrant. These include shuffling at least one-half of its general partners or changing the form from a partnership to a corporation. I was also able to identify if an entrant was the continuation of an older firm by matching partners, sectors, and addresses (which I was able to do with the commercial directory). I then created an “old firm” variable that takes a value of 1 if the entrant takes over the business of a previous firm. Corporate mergers were rare, and most of those occurred after the financial crisis of 1907, before this paper’s period of study. But many partnerships churned through partners (Artunç and Guinnane Reference Artunç and Guinnane2019). About 10 percent of all companies in the dataset were established because of these reorganizations. Footnote 13 I cannot successfully capture the full extent of “complete” exits or “brand-new” entrants if firms transitioned to or from a single proprietorship. Without data on single proprietorships, such transitions are unobservable. Since the breakdown of a partnership with two unlimitedly liable partners resulted in the liquidation of the firm’s assets (which were legally owned by the partners given that partnerships had no legal personhood), the transition to single proprietorships is unlikely. Less than 1 percent of new partnerships in the dataset reported that they were previously sole proprietorships (but firms did not have to report this). Interwar Istanbul might serve as a useful comparison. There, transitions from single proprietorships to partnerships were rare (less than 1 percent of single proprietorships); transitions to single proprietorships were nonexistent (Ağır and Artunç Reference Ağır and Artunç2019).
Summary Statistics on Egyptian Firms
The dataset consists of more than 11,000 distinct partnerships and corporations established between 1911 and 1948 (Table 1). Most company formations took place in Alexandria or Cairo; the omitted category of Mansoura accounted for less than 5 percent. Ordinary and limited partnerships together accounted for more than 93 percent of all firm creation; their share did not vary significantly over time. The small proportion of corporations is partly due to the authorization system of incorporation. Footnote 14 This is in line with the historical evidence on company formation in Western Europe, where partnerships remained the leading enterprise form until the introduction of the private limited liability company. Footnote 15
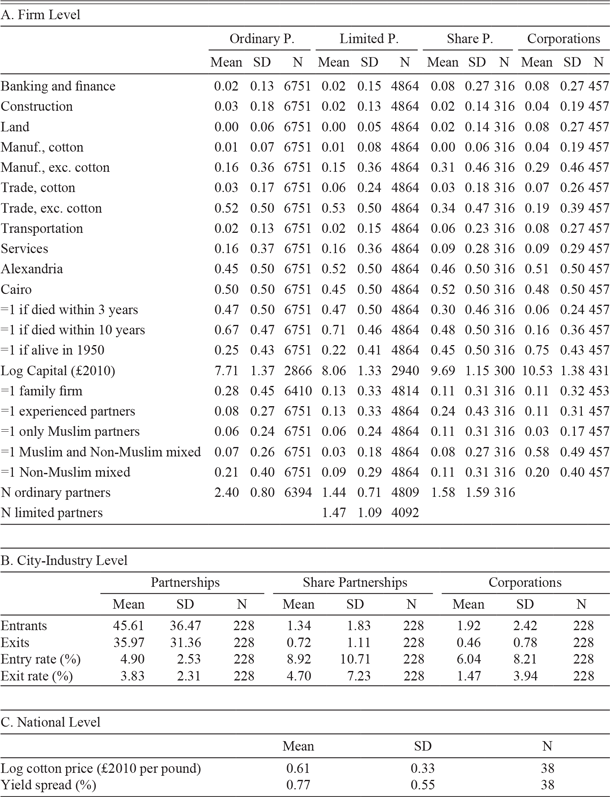
DESCRIPTIVE STATISTICS

Notes: Capital is nominal capitalization at birth, adjusted by using a cost of capital index. Family firms include companies where more than half of members had the same last name or the firm included a family designation in its legal name (e.g., brothers, sons, etc.). “Non-Muslim mixed” indicate firms whose partners were of different non-Muslim ethno-religious backgrounds (e.g., a partnership between a Coptic owner and a Jewish owner). A firm is considered “experienced” if it at least one partner was in business before.
Sources: Gazette des Tribunaux Mixtes, 1911–21; Journal des Tribunaux Mixtes, 1921–49; Egyptian Directory, 1911–50; Statistique des sociétés anonymes par actions, 1911; Industrial and Commercial Census, 1937. See the text for details.
Firm-level statistics reported in Panel A reveal significant differences across enterprise forms. Ordinary and limited partnerships were similar in terms of industry distribution and survival, though limited partnerships had a slightly larger capitalization. Most partnerships dissolve within a few years. Partnerships with tradable shares, and especially with corporations, were much bigger. As expected, corporations also had a much longer duration. Firms participating in sectors with weaker capital requirements, such as small shops or public establishments, made up the majority of general and limited partnerships. The sectoral composition of corporations highlights the form’s advantages in raising capital, with high concentrations in finance, land, manufacturing, transportation (railroads and steamships), and mining. Cotton textiles’ shares in manufacturing and trade were low, so cotton firms do not drive the main results.
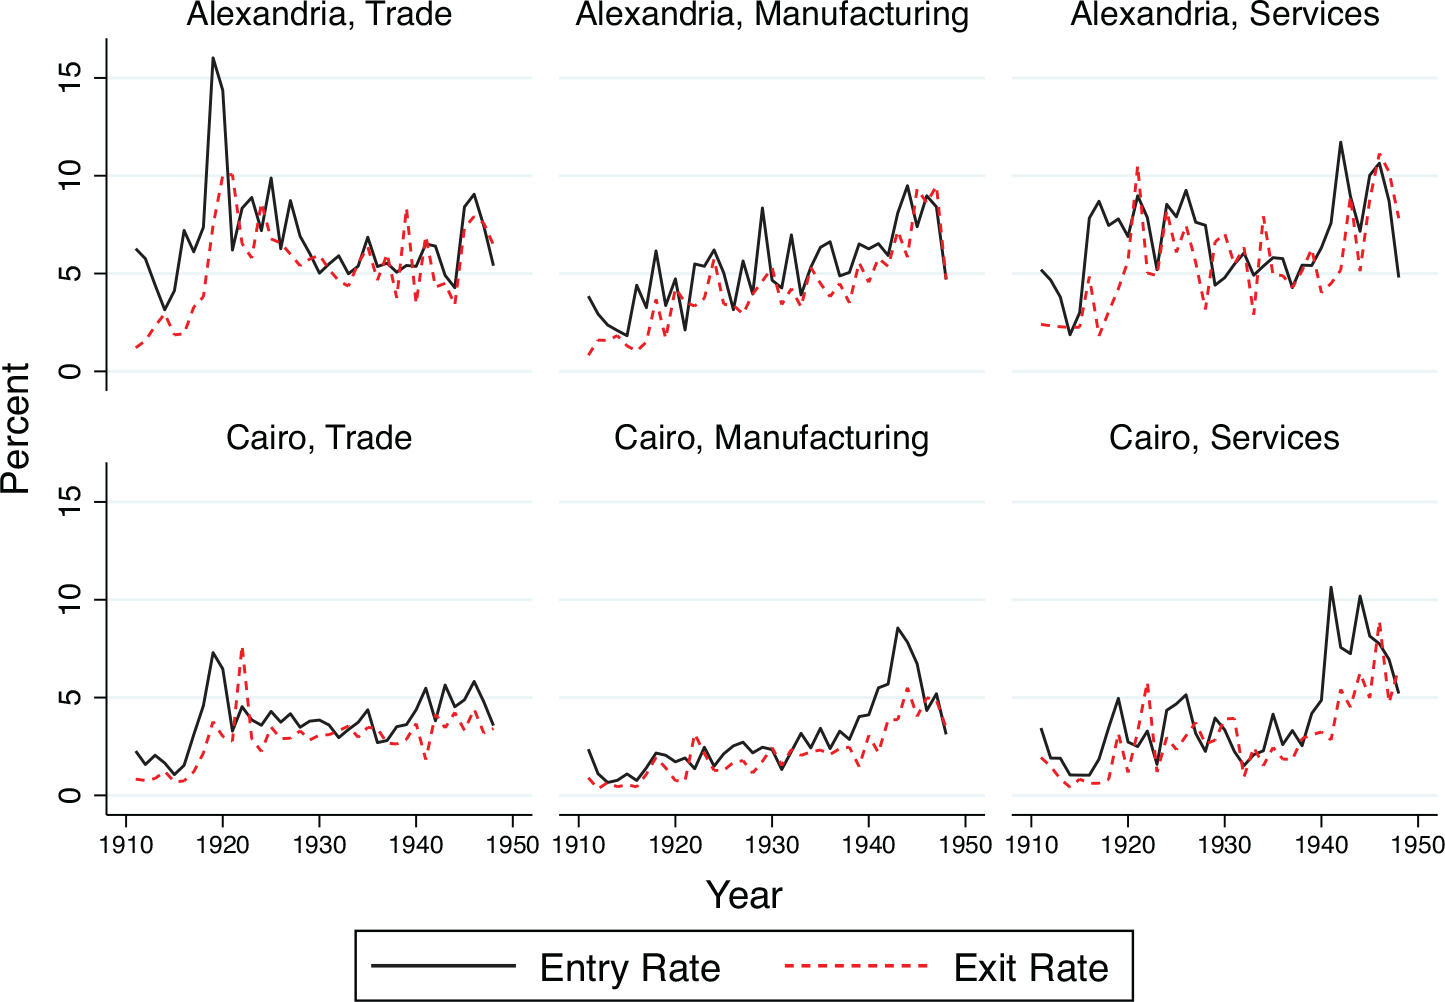
My empirical exercise investigates entry and exit dynamics within each market segment, defined as city-industry and ownership type, following the typical practice in the literature. Footnote 16 This is the unit of observation for the main firm turnover results. Before proceeding, I exclude several firms from the dataset. First, I drop observations before 1911 and after 1948 as the endpoint years are not fully represented in the data. Second, I create broad sectoral categories to make sure that there are no market segments with zero entry or exit, as would have been the case with more finely defined categories. I aggregate firms into three sectors: trade, industry, and services. Trade includes wholesalers and retailers as well as commodity brokers, financial brokers, and banks. This is consistent with the classification in the Industrial and Commercial Census of 1937. The industrial sector spans all manufacturing firms as well as mining, construction, land, public utilities, and transportation (e.g., railroads and steamships). Footnote 17 Services consist of cafés, bars, restaurants, theaters, cinemas, barbershops, etc., as well as other custom services such as tailors, cobblers, and mechanics. Footnote 18 Panel B reports summary statistics of entry and exit within market-segment clusters, and Figure 2 plots entry-exit rates for partnerships in each market segment. The entry/exit graphs for share partnerships and corporations are available in the Online Appendix.
PARTNERSHIP ENTRY AND EXIT RATES BY MARKET SEGMENT
Notes: The figures indicate entry and exit rates of ordinary and limited partnerships in each city-sector pair. The entry rate in year t is defined as the number of new partnerships established in year t divided by the number incumbent partnerships in the beginning of year t (i.e., 1 January of year t). The exit rate in year t is defined as the number of partnerships dissolved in year t divided by the number of incumbent partnerships in the beginning of year t.
Sources: Gazette des Tribunaux Mixtes, 1911–21; Journal des Tribunaux Mixtes, 1921–49; Egyptian Directory, 1911–50; Statistique des sociétés anonymes par actions, 1911; Industrial and Commercial Census, 1937. See the text for details.

A few observations stand out. Most firm creation and destruction occurred through partnerships, but the average entry and exit rates, 4.90 and 3.83 percent, respectively, were low relative to high-growth developing economies today, where entry rates usually exceed 10 percent. Egypt’s historical entry-exit rates were more comparable to the mature economies in continental Europe today and other middle-income developing economies (Bartelsman, Haltiwanger, and Scarpetta Reference Bartelsman, Haltiwanger and Scarpetta2004). Footnote 19 These are somewhat flawed comparisons, however, since historical turnover rates might be significantly lower, especially given the presence of the Great Depression. Firm turnover slowed down, especially in trade, after the cotton market crash in 1921, and did not recover until after the Great Depression. Manufacturing, on the other hand, has steadily grown since the mid-1930s. After the outbreak of WWII, entry rates in manufacturing and services soared to 9–10 percent, which are comparable to those in developing countries today. The evolution of manufacturing highlights Egypt’s industrialization, which was modest in the 1930s and gained momentum during the war due to disruptions in trade and the demand boost generated by foreign troops stationed in Egypt (Karakoç, Pamuk, and Panza Reference Karakoç, Pamuk and Panza2017, pp. 149–50). Within-industry correlations of entry and exit were high (Table 2), suggesting substantial reallocation of capital and labor between firms in each sector. Share partnerships and corporations had lumpy entry and exit, which, along with the small number of incumbents of these types, created swings in turnover. Dynamics of corporate entry and exit highlight barriers to the form. Incorporation was a political process, which contributed to sluggish entry-exit patterns at the outset.
CORRELATIONS OF ENTRY AND EXIT RATES

Notes: The coefficients of correlation for entry and exit rates are calculated for each city-sector pair. Significance levels: *** p < 0.01, ** p < 0.05, * p < 0.10.
Sources: Gazette des Tribunaux Mixtes, 1911–21; Journal des Tribunaux Mixtes, 1921–49; Egyptian Directory, 1911–50; Statistique des sociétés anonymes par actions, 1911; Industrial and Commercial Census, 1937. See the text for details.
MEASURING THE EFFECTS OF AGGREGATE FLUCTUATIONS
Firm Entry and Exit over the Cycle
I start by considering the impact of price fluctuations on entry and exit by estimating the model
 $${y_{i,j,t}} = \alpha + \beta {z_t} + \sum\limits_i {{\gamma _i}{d_i}{z_t}} + \sum\limits_i {{\zeta _i}{d_i}} + \eta {x_t} + {\mu _j} + {u_{i,j,t}},$$
closely following the specification in the firm dynamics literature (Moreira Reference Moreira2017; Gourio, Messer, and Siemer Reference Gourio, Messer and Siemer2016). The dependent variable is the demeaned log change in entrants (or exits) of firms of ownership type i in market segment (city-industry pair) j at time t. The main explanatory variables are z t , which is the cycle indicator (log change in the demeaned cotton price) at time t, and its interactions with the enterprise form dummies d i . x t denotes the spread between the yield on Egyptian bonds and British consols to proxy for the cost of capital. Market-segment fixed effects are denoted by µ j . The error term is u i,j,t . Given the potential for serial autocorrelation of the error term, I calculate Newey-West standard errors with two lags. Footnote 20
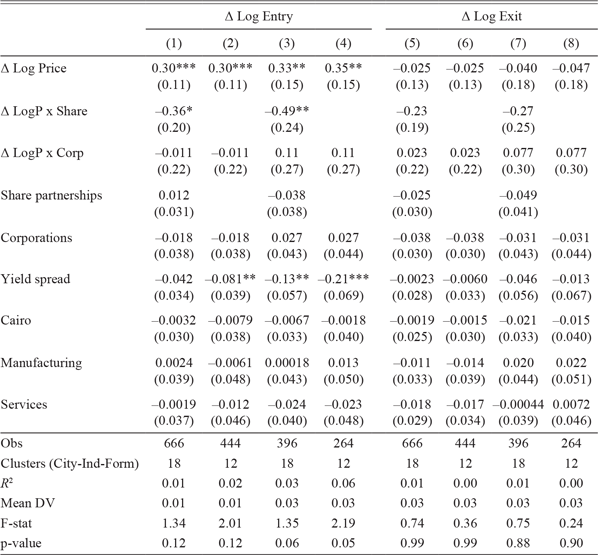
Table 3 reports the results from fixed-effects regressions in different samples. Columns (1) and (4) include the entire sample. Columns (2) and (6) drop share partnerships due to the abundance of observations with zeros in this ownership type. Columns (3) and (7) restrict the sample to the interwar period (1918–39). Columns (4) and (8) repeat the regressions for the interwar period but without share partnerships. The estimates show that partnership entry was procyclical but exits acyclical. A 1-percent increase in cotton prices above its mean was associated with a 0.31 to 0.38 percent increase in the number of entrants. But a shock to prices had no effect on exits. The estimated coefficient for corporations is positive but less precise. In the interwar period, however, the procyclical effect was statistically significant. This could be a result of high barriers to a corporation or a countervailing effect from countercyclical charter authorization. Higher yield spreads were associated with a muted entry, as expected. The results are robust to alternative cycle indicators or using entry/exit rates as covariates, which are presented in the Online Appendix.
FIRM ENTRY AND EXIT OVER THE BUSINESS CYCLE BY LEGAL FORM

Notes: The table reports OLS estimates where the dependent variable is the log change in the number of entries (or exits) between year t and t–1 in a market segment (defined as a city-industry-enterprise form). Δ Log Price is the change in the logged real cotton price between years t and t–1. Columns (2), (4), (6), and (8) exclude share partnerships. Columns (3)–(4) and (7)–(8) restrict the sample to the interwar period (1918–39). All specifications include a constant term. Newey-West standard errors are calculated with two lags and are reported in parentheses. The reported p-value refers to the p-value associated with the test that the coefficients on Δ Log Price and Δ Log Price x Corp add up to zero. Significance levels: *** p < 0.01, ** p < 0.05, * p < 0.10.
Sources: Gazette des Tribunaux Mixtes, 1911–21; Journal des Tribunaux Mixtes, 1921–49; Egyptian Directory, 1911–50; Statistique des sociétés anonymes par actions, 1911; Industrial and Commercial Census, 1937; Economist, 1910–43; Mitchell (Reference Mitchell1988). See the text for details.
To measure how the effects of aggregate fluctuations on firm turnover are propagated, I estimate impulse responses to cotton price shocks over five-year time horizons. Footnote 21 I construct the impulse response using the local projections method of Jordà (Reference Jordà2005) by estimating fixed effects regressions of the form
 $${y_{i,t + k}} = {\beta _k}{z_t} + \textbf{x}_{i,t}^\prime {\gamma _k} + {\mu _i} + {\varepsilon _{i,t,k}}$$
for each lead
 $${k_{0,1, \ldots ,5}}$$
(in years) and each enterprise form, and y
i,t+k
is an outcome variable, measured as the log change in entrants, exits, or the total number of firms, between times t+k and t–1 in city-industry i. The cycle indicator is z
t
, which denotes the log change in the cotton price between t–1 and t; x
t
is a vector of controls, which includes the values of log change in yield spread at t (or t–1 if the outcome is the total number of firms), log changes in entry and exit at t–1 (for all outcome variables), as well as log change in exit (if outcome is entry) or entry (if outcome is exit) at time t; and μi denotes city-industry fixed effects.
Footnote 22
Standard errors are clustered at the city-industry level.
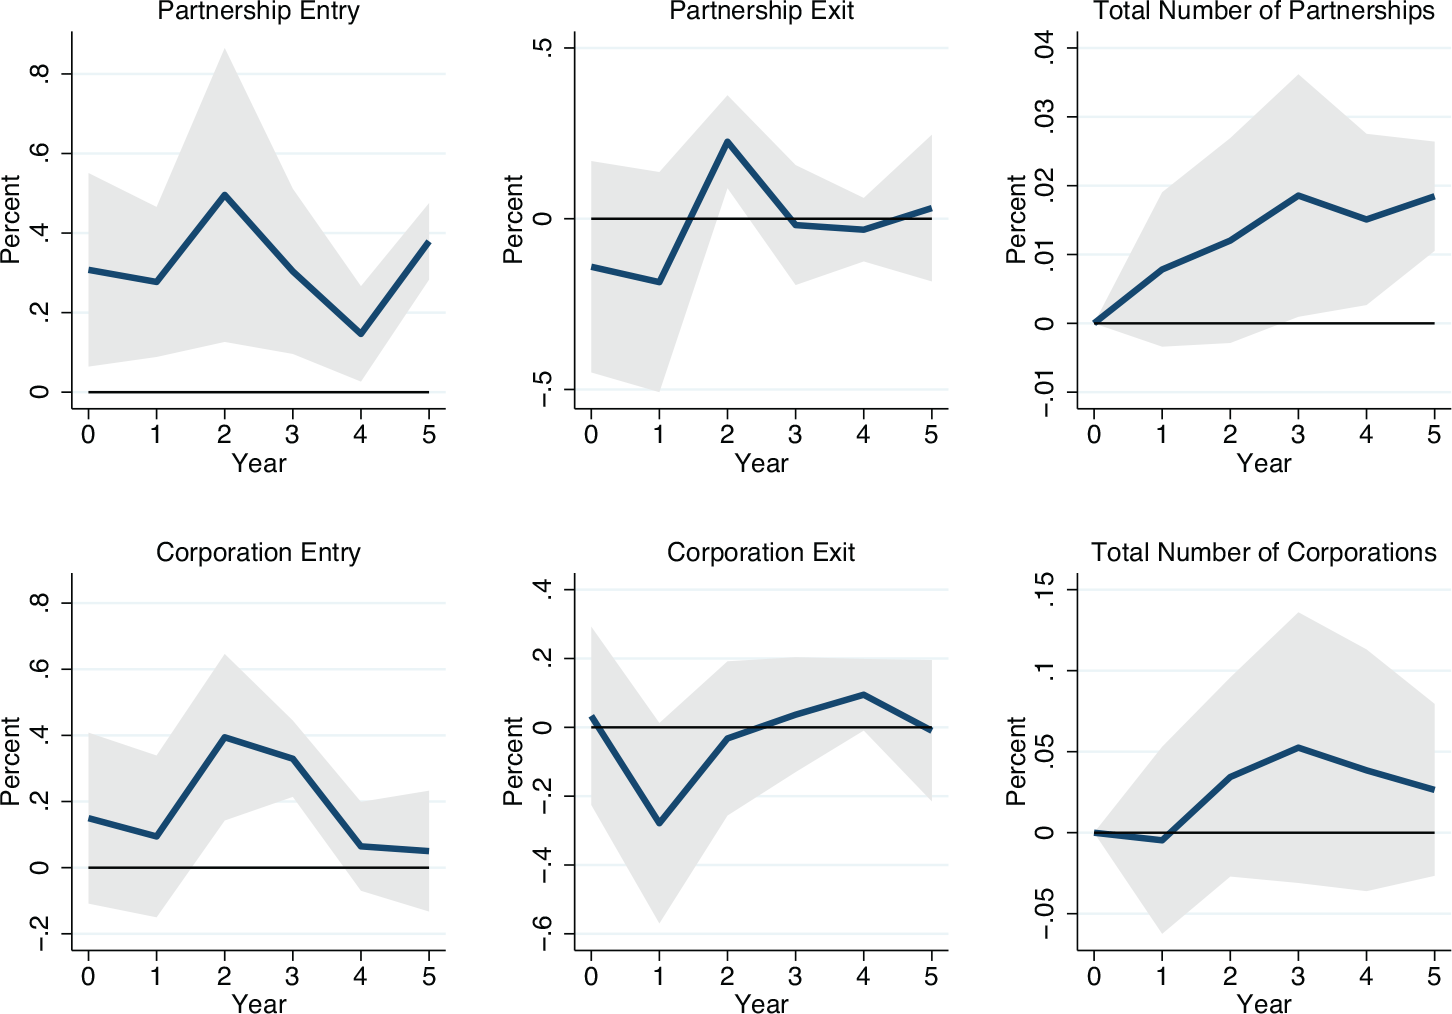
The local projection estimates reveal significant cyclical effects (Figure 3). Positive price shocks boosted partnership creation immediately and permanently. A 1-percent shock to the cotton price raised partnership entry by 0.3 percent that year; in four years, entry remained 0.2 percent higher relative to entry prior to the shock. Positive shocks did not immediately impact exits, but significant effects emerged after year 2. If higher exits were driven by competitive pressure from entrants, exits would have occurred earlier. Instead, the delayed increase in exits was driven by the high frailty of young partnerships, whose death rate peaked at age 2. Expansionary periods selected more partnerships into entry. As most dissolved after two years, the cumulative exit picked up. About 40 percent of these new partnerships have survived. Over five years, the total number of partnerships increased by 0.02 percent in response to a 1-percent price shock. In contrast, corporate dynamics had a weaker response. Consistent with the baseline regressions, entry was acyclical. But there was a delayed response; the number of corporate entrants increased by 0.3 to 0.4 percent two to three years after a 1-percent positive price shock. There was no significant impact on exits or the total number of corporations.
LOCAL PROJECTION ESTIMATES OF RESPONSES TO PRICE SHOCKS—CUMULATIVE EFFECTS
Notes: The graphs plot the cumulative response of entry, exit, and the total number of incumbents by ownership type to a 1-percent increase in the log change of cotton prices. The solid line indicates the local projection OLS estimates; the shaded area describes 90 percent confidence bands.
Sources: Gazette des Tribunaux Mixtes, 1911–21; Journal des Tribunaux Mixtes, 1921–49; Egyptian Directory, 1911–50; Statistique des sociétés anonymes par actions, 1911; Industrial and Commercial Census, 1937; Economist, 1910–43; Mitchell (Reference Mitchell1988). See the text for details.

What do these findings imply in the context of the data? Defining recessionary fluctuations as a one-standard deviation decline in prices, which corresponds to a negative 24 percent shock, a downturn decreased entry by 7.2 percent immediately. This contraction in entrant mass persisted for the first five years. After five years, entry was still 20 percent lower relative to its pre-recession level. Exits did not immediately change. But, in time, as the entrant mass contracted, exits also dropped by 6 percent. The total number of firms permanently decreased by about 0.5 percent. These findings demonstrate that recessions had a predominantly insulating rather than cleansing effect. The responsive margin was entry, which adjusted immediately and significantly to a price shock. Exits were contemporaneously acyclical. In contrast to a cleansing effect, recessions led to a decrease in exits in the medium run due to the smaller entrant cohort. Incumbents were shielded by this contraction in entry. Because so many firms were never formed, the total number of firms decreased permanently. So, a recessionary shock caused a “missing” generation of partnerships through a reduction in births, much like wartime effects on population demographics. Due to legal barriers to incorporations, corporate entry had a delayed, sluggish response to cyclical fluctuations, with no permanent effect on the total number of corporations.
Capital and Size over the Cycle
Having established the significance of the extensive margin of entry and procyclical partnership entry dynamics, I now turn to investigating whether different firms selected into entry over the cycle. Ideally, one would have used employment or output per worker to measure size and productivity, but these data are not available. Regardless, capital and firm survival capture important aspects of firm quality. First, most partnerships had self-employed owners and thus no other employment beyond the partners. Second, any scale increase in these partnerships would have required higher investment, which would then be reflected in the capitalization measure. Third, firm dynamics involve considerable “survival bias” (Jensen, McGuckin, and Stiroh 2001; Agarwal and Gort Reference Agarwal and Gort2002; Bartelsman, Scarpetta, and Schivardi Reference Bartelsman, Scarpetta and Schivardi2005; Bellone et al. Reference Bellone, Musso, Nesta and Quéré2008). As competition selects against persistently bad performers, only the more productive firms relative to other incumbents remain in the market. Footnote 23 Together, these measures capture important aspects of firm quality.
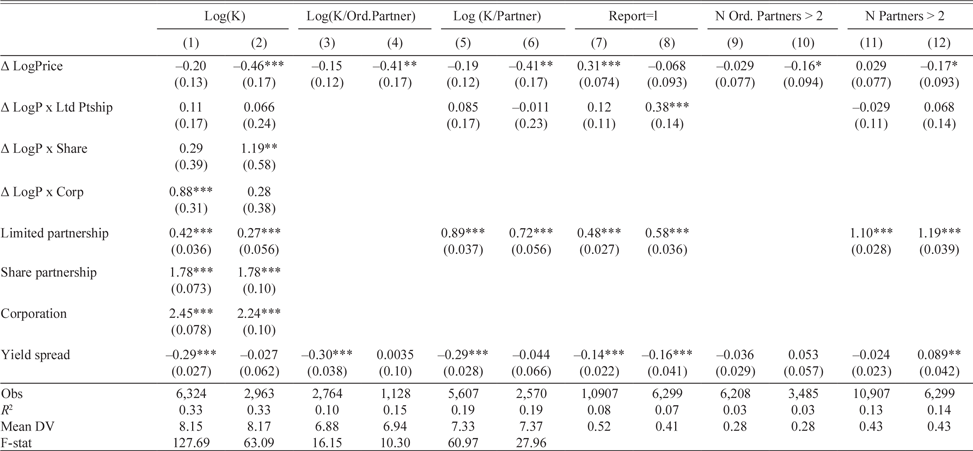
I start by examining the capitalization and size characteristics of new entrants at different points in the business cycle. The cycle can have two countervailing effects on start-up capital. Firms born during economic upturns can have higher startup capital because of a general increase in demand. This channel can operate independently of ex ante firm heterogeneity. In contrast, expansionary periods can cause greater negative selection into entry by lowering the productivity threshold of entry, thereby leading to lower average startup capital. This channel indicates the presence of ex ante firm heterogeneity. Given that the theory can support two alternative views, this is ultimately an empirical question. Though I cannot measure the specific effects of each channel, my empirical exercise can demonstrate net effects. For all firms, I estimate a linear model where the dependent variable is the firm’s capital stock at the time of entry. Then, for ordinary and limited partnerships, I also estimate capital per partner. All regressions include the yield spread at entry, industry dummies, location dummies, and indicators for founder composition: whether the firm included a partner with an elite title, whether the firm had Muslim partners, whether the firm was a family firm, and whether the firm had partners who participated in other companies before. Table 4 reports the results, where even-numbered columns restrict the sample to the interwar period (1918–39). Partnership capitalization was countercyclical in the interwar period, though the effect lost significance at conventional levels when the alternative cycle indicator was used. Overall, a 1-percent increase in the growth rate of cotton prices depressed partnership startup capital by 0.45 percent and average capital per partner by 0.39–0.41 percent. Corporation startup capital was procyclical in the baseline, but it was not robust enough to restrict the sample to the interwar period.
CAPITALIZATION AND SIZE AT ENTRY OVER THE CYCLE

Notes: Columns (1) through (6) report OLS estimates where the dependent variable is logged capital or capital per partner. Columns (7) through (12) report probit estimates where the dependent variable is a dummy variable indicating whether the partnership reported its capitalization, or whether the firm has more than two partners. The reference group is the ordinary partnership. Columns (2), (4), (6), (8), (10), and (12) restrict the sample to firms born during the interwar period (1918–39). All regressions include firm-level controls. The coefficient estimates on other control variables are reported in the Online Appendix. Standard errors robust to heteroskedasticity are reported in parentheses. Significance levels: *** p < 0.01, ** p < 0.05, * p < 0.10.
Sources: Gazette des Tribunaux Mixtes, 1911–21; Journal des Tribunaux Mixtes, 1921–49; Egyptian Directory, 1911–50; Statistique des sociétés anonymes par actions, 1911; Industrial and Commercial Census, 1937; Economist, 1910–43; Mitchell (Reference Mitchell1988). See the text for details.
Selection in reporting capital poses a problem. All corporations and limited partnerships with tradeable shares in the database disclosed their capitalization. Partnerships, on the other hand, were not required to release this information, and almost half of the ordinary partnerships did not. Incomplete reporting is an issue to the extent that the partnerships that reported their capital during upturns were also more likely to have lower capital during upturns. Estimating a probit model to evaluate the likelihood of reporting capital over the cycle, I find that new partnerships were indeed more likely to disclose their capital information during upturns, but this effect vanishes for ordinary partnerships in the interwar sample (Columns 7 and 8). To address this problem, I examine the number of partners (partnership size) at entry over the cycle. This is a more reliable indicator of firm size for unincorporated firms than capital. For most partnerships, adding partners was the only way to increase capital (Lamoreaux and Rosenthal Reference Lamoreaux and Rosenthal2005; Guinnane and Schneebacher Reference Guinnane and Schneebacher2020). Columns (9) through (12) of Table 4 report the results from estimating probit models, where the dependent variable is the probability that an entrant had more than two partners. The evidence supports the start-up capital regressions: partnerships established during expansionary fluctuations were smaller.
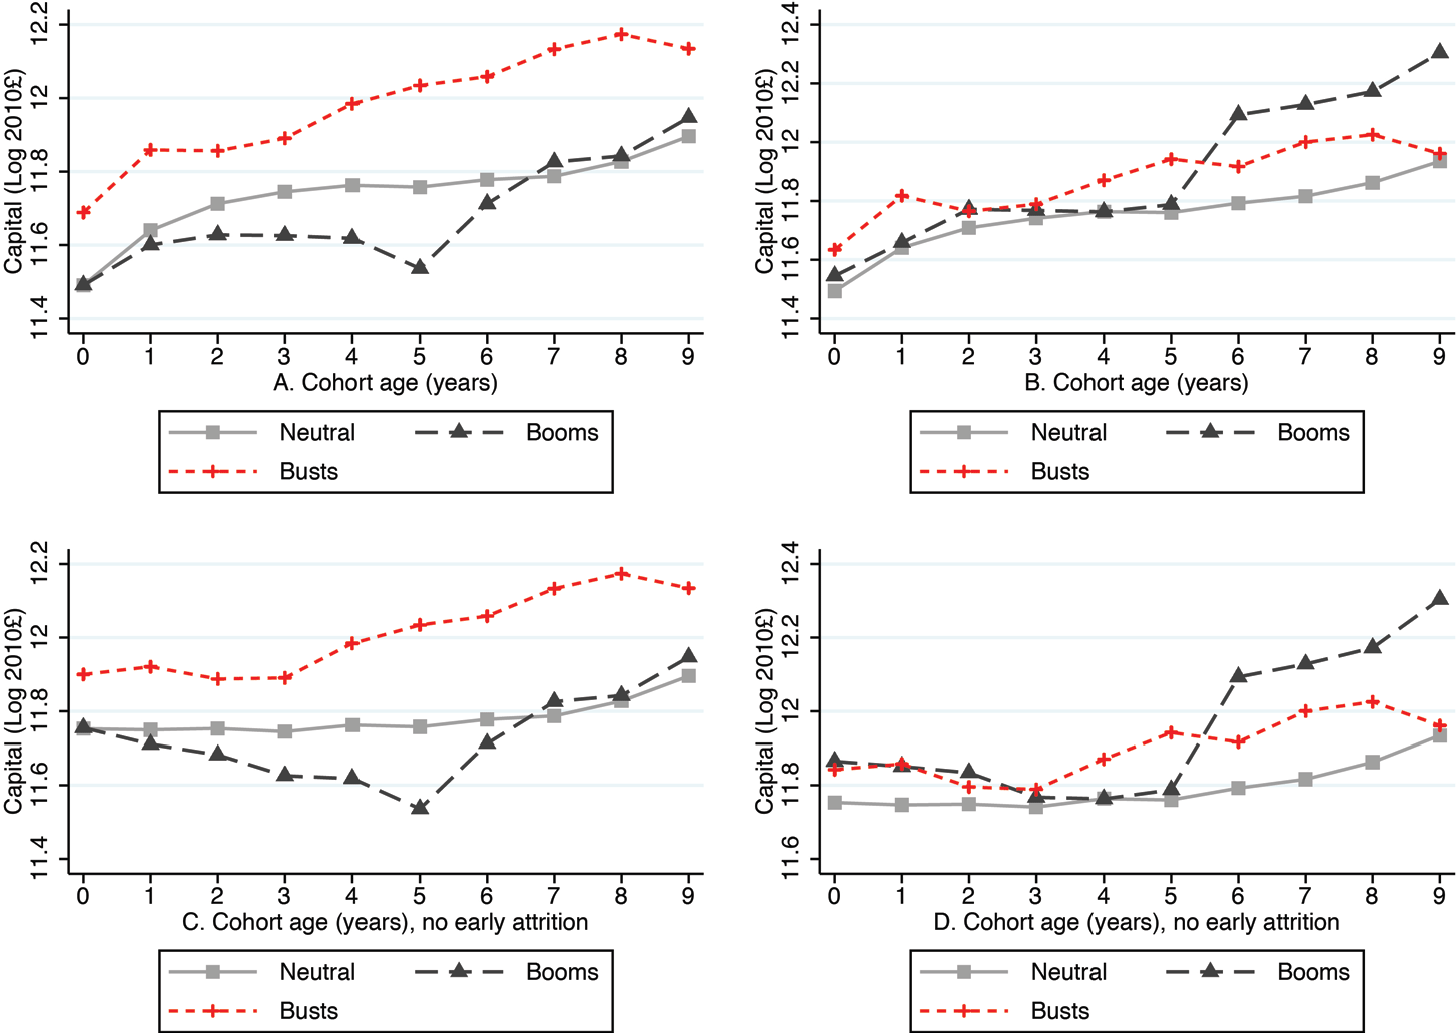
How persistent were these differences between the boom and bust cohorts? Did these firms stay small, or did they become successively larger over their lifecycle? If quality differences between cohorts were permanent, then startup capitalization or size could become sticky, and boom cohorts might remain persistently smaller than recessionary cohorts (Sterk, Sedláček, and Pugsley Reference Sterk, Sedláček and Pugsley2021). Figure 4 illustrates this point by plotting the average capitalization of cohorts over their lifecycles. Panels A and C use the log change in cotton prices as the cycle indicator; Panels B and D use the detrended cotton price. Expansionary cohorts refer to firms that entered in years during which the cycle indicator increased by more than one standard deviation; recessionary cohorts are comprised of firms that entered when the cycle indicator decreased by more than one standard deviation. Overall, there is little evidence of convergence. Bust cohorts remained permanently larger than boom cohorts, but under the alternative cycle indicator, these firms caught up after five years. The results are not driven by firm churning (that is, young firms that died before three years), as dropping these firms does not change the persistent differences in average capital over cohorts (Panel C). These exercises show that boom cohorts were born smaller and remained smaller, highlighting persistent heterogeneity over cycle conditions at entry.
AVERAGE PARTNERSHIP CAPITAL BY COHORT
Notes: The graphs plot the average capital of ordinary and limited partnerships by each cohort over the cohort’s lifecycle, up to 10 years (ages 0–9). Panels A and C use the log change in cotton prices as the cycle indicator; Panels B and D use the detrended log price as the cycle indicator (the residual after an OLS regression on a constant term, a linear trend, and the two nearest lags). Panels C and D exclude firms that died within the first three years after entry. Booms refer to firms born in years when the cycle indicator was at least one standard deviation above its mean or trend. Busts describe firms established in years when the cycle indicator was one standard deviation below its mean or trend. Neutral is the residual group.
Sources: Gazette des Tribunaux Mixtes, 1911–21; Journal des Tribunaux Mixtes, 1921–49; Egyptian Directory, 1911–50; Statistique des sociétés anonymes par actions, 1911; Industrial and Commercial Census, 1937; Economist, 1910–43; Mitchell (Reference Mitchell1988). See the text for details.

Firm Survival over the Cycle
Another piece of evidence that demonstrates cyclical selection is the cohort-specific death rate. Haltiwanger, Jarmin, and Miranda (Reference Haltiwanger, Jarmin and Miranda2013) show that the average exit rate and employment growth in the United States largely depend on firm age. Most firms exit when they are young, but if they survive, they grow rapidly relative to mature firms. This up-or-out dynamic accounts for the patterns of firm entry/exit in this historical setting, as well.
I start by estimating Kaplan-Meier survival functions over 5 and 10 years for neutral, expansionary, and recessionary cohorts. When estimating the survival function, I restrict the sample to companies that I can potentially observe during the survival window in question. The five-year survival analysis removes firms formed after March 1944, and the 10-year survival analysis drops those established after March 1939.
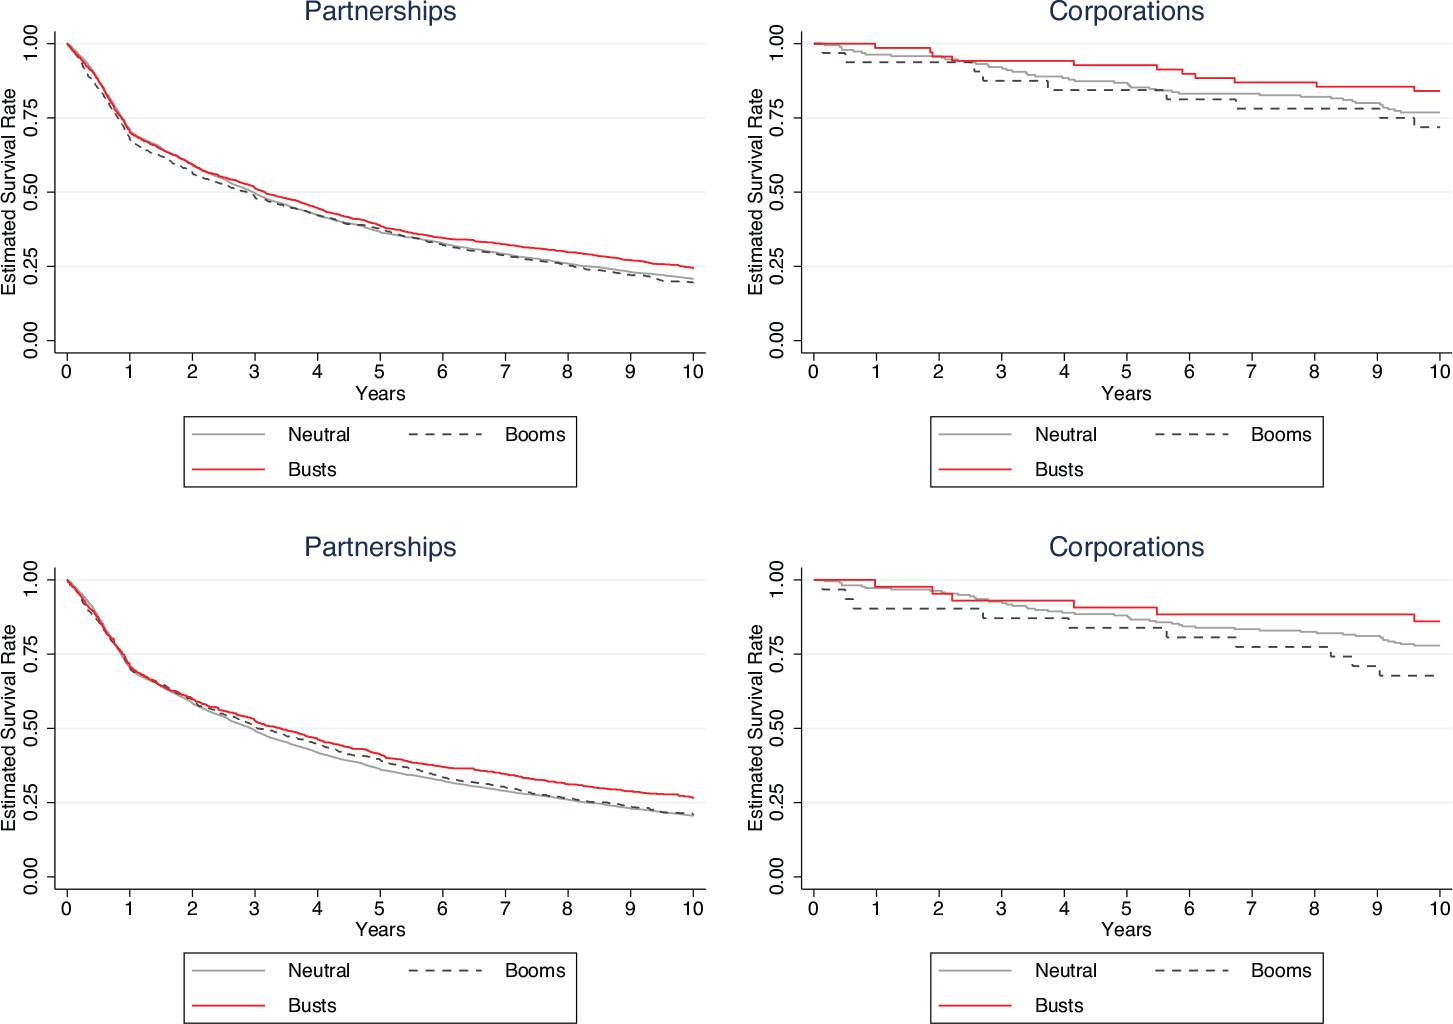
The estimated survival functions, presented in Figure 5, reveal that expansionary partnership cohorts were significantly more fragile than recessionary cohorts. Almost 50 percent of partnerships established during an economic upturn dissolved in two years. In contrast, 50 percent of firms established during recessions survived longer than the first three years. The differences persisted over longer survival windows. Seventy-five percent of boom cohorts had exited after a little more than six years; 25 percent of recessionary cohorts, on the other hand, had survived for more than nine years on average. Corporations did not display the same patterns as the survivor functions of different cohorts were not statistically different. The high barriers to entry for corporations most likely screened out firms by at least this measure of quality.
KAPLAN-MEIER SURVIVAL FUNCTIONS BY LEGAL FORM
Notes: These graphs show the estimated survival functions for partnerships and corporations. The top panels use the log change in cotton prices as the cycle indicator; the bottom panels use the detrended log price (the residual after an OLS regression on a constant term, a linear trend, and the two nearest lags). Booms refer to firms born in years when the cycle indicator was at least one standard deviation above its mean or trend. Busts describe firms established in years when the cycle indicator was one standard deviation below its mean or trend. Neutral is the residual group.
Sources: Gazette des Tribunaux Mixtes, 1911–21; Journal des Tribunaux Mixtes, 1921–49; Egyptian Directory, 1911–50; Statistique des sociétés anonymes par actions, 1911; Industrial and Commercial Census, 1937; Economist, 1910–43; Mitchell (Reference Mitchell1988). See the text for details.

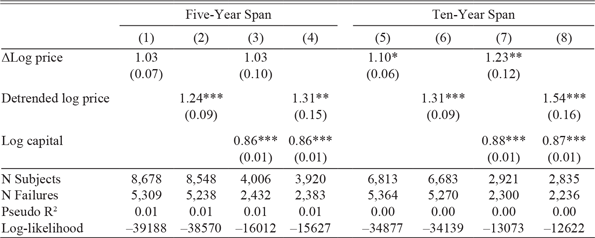
Perhaps the differences in survival are due to firm size or partner composition, which differ systematically across expansionary and recessionary cohorts. I further explore the cohort-specific and current cyclical drivers of survival by estimating Cox proportional hazards models over five and 10 years, controlling for firm characteristics at birth: the yield spread between Egyptian and British bonds, categorical variables indicating partnerships with at least three owners, ethno-religious composition of partners, whether at least one partner was “experienced,” an indicator for family firms, and sectoral controls. I stratify the sample by categories in which the proportional hazards assumption is violated: limited partnerships, experienced firms, and firms in which all partners are Muslims. Table 5 reports the results. Regardless of the cycle indicator, expansionary partnership cohorts were more fragile than recessionary cohorts, but the magnitudes are sensitive to how we measure the cycle. Either way, exit risk was amplified over longer time horizons. Partnerships born when the cotton price increased more than 1 percent over its mean were 10 to 54 percent more likely to dissolve relative to firms founded in “normal” times, when the price fluctuation was at its mean. The results are robust to including startup capital as an additional control, though this excludes firms without reported capital (Columns 3, 4, 7, and 8). The differences in frailty between cohorts were not driven by size, whether measured by the number of partners or capitalization. Repeating this exercise for all firms—including partnerships with tradeable shares and corporations—shows that the cyclical differences in firm frailty were confined to the partnership form (see the Online Appendix). While corporations established during upturns were associated with higher frailty, these effects are not precisely estimated, likely due to corporate exits being rare events. The Online Appendix provides additional estimates from Cox proportional hazards and probit regressions using annual observations over the first 10 years after entry, confirming the findings that the cycle conditions at birth were associated with higher exit risk but that current cycle conditions had no effect.
HAZARD RATIO ESTIMATES

Notes: The table reports hazard ratio estimates from estimating Cox proportional hazards models where the outcome variable is time to failure after entry, up to five years or ten years. The five-year survival regressions exclude firms born after 1944; the ten-year survival regressions exclude firms born after 1938. Each model is stratified by limited partnerships, experienced firms, family firms, and firms located in Cairo. The sample includes only ordinary and limited partnerships; results on the full sample are reported in the Online Appendix. The detrended log price is the residual of the logged cotton price form an OLS regression on a constant term and its nearest two lags. All specifications include aggregate and firm-level controls, except logged capital. Columns (3), (4), (7), and (8) report results from models that include logged startup capital. Standard errors robust to heteroskedasticity are reported in parentheses. Significance levels: *** p < 0.01, ** p < 0.05, * p < 0.10.
Sources: Gazette des Tribunaux Mixtes, 1911–21; Journal des Tribunaux Mixtes, 1921–49; Egyptian Directory, 1911–50; Statistique des sociétés anonymes par actions, 1911; Industrial and Commercial Census, 1937; Economist, 1910–43; Mitchell (Reference Mitchell1988). See the text for details.
CONCLUSION
The process of firm creation and destruction over the business cycle has significant implications for understanding the propagation of aggregate shocks. Sharp declines in business formation can slow down economic recovery and cause long-run stagnation in output growth. Measuring how firm dynamics can amplify business cycle fluctuations is significant for understanding industrialization in economic history, especially in the periphery, whose economies were exposed to extensive price volatility. But the question remains understudied in economic history despite its importance. This paper bridges this empirical gap by taking advantage of a rich dataset on multiowner firms in early-twentieth-century Egypt. During this period, Egypt was a small, price-taking economy dependent on cotton exports. Thus, I was able to establish a causal link between cyclical fluctuations—measured by short-run changes in cotton prices—and firm dynamics. The new evidence revealed the significance of the extensive margin of entry by demonstrating procyclical entry, acyclical exit, and countercyclical entrant quality. Expansionary periods boosted partnership entry rates but selected companies that were persistently smaller and died faster relative to entrants born in recessionary spells. Corporations had sluggish responses to aggregate fluctuations, and corporate cohorts were not statistically different across the cycle.
My analysis helps sort out alternative models of firm entry and the effects of the business cycle on firms by supporting the notion that potential entrants had latent differences in productivity and were informed about their types. Potential entrants followed the cutoff rules, comparing their assessment of discounted future profits to sunk entry costs. Since entry costs were cyclical, the entry margin was more responsive to short-run fluctuations. Expansions created more firms, but they were, on average, less productive. Recessions decreased the number of entrants, though these entrants were more resilient. The responsiveness of the entry margin led to strong “insulation” effects during recessions, as opposed to “cleansing” effects. Incumbents were shielded from competitive pressure from potential entrants, and creative destruction was muted.
The fact that Egypt’s margin of adjustment to the cycle occurred at the extensive margin of entry is significant for understanding its interwar growth experience. Temporary negative price shocks created “missing” generations of firms. My local projection estimates show that a one-standard-deviation decrease in cotton prices permanently lowered the number of entrants by 10 percent. The interwar period featured several sharp declines of this magnitude in 1921, 1925–26, and 1930. These price shocks contributed to the secular decline and stagnation of partnership creation in many sectors in Alexandria and Cairo. Without these fluctuations (and the boom in 1922), 25 percent more partnerships would have been created between 1920 and 1939. Since partnerships accounted for significant employment and capital in Egypt, these missing firms would have helped income growth, not to mention productivity growth through efficient churn. So, the long-term stagnation in firm creation that I document here can explain the slow growth of industrial output and per capita incomes in Egypt during the interwar period (Karakoç, Pamuk, and Panza Reference Karakoç, Pamuk and Panza2017). The nature of firm entry amplified and propagated temporary price shocks over a decade.
Without the presence of ex ante heterogeneity and cyclical entry costs, the effects of price shocks might not have been so severe. Positive price shocks could have been growth-inducing as they generated greater entry and allowed experimentation. But since the extensive margin of entry was the main adjustment channel, temporary shocks were transmitted across time. Cotton markets were especially volatile in the interwar period, so any negative price shock permanently scarred the economy through its effects on firm creation. Without that dependence, such temporary negative shocks would not have been as frequent. Thus, the interaction between the periphery’s specialization and the nature of firm entry over the cycle helps us understand the hurdles developing countries faced in their industrialization attempts before WWII. Together, these findings support theories that stress the role of new firms in how economies adjust to aggregate shocks.
The fact that corporations had muted cyclical dynamics highlights distortions in access to this enterprise form. Incorporation was a costly, time-consuming process. By the 1930s, it routinely took several months for successful incorporators to secure their authorization decrees. Due to high legal barriers to entry, corporate entrants were also screened out extensively. So, corporate dynamics followed the cycle with a delay, and systematic differences between cohorts were eliminated. Limiting access to incorporation, and thus to easier ways of mobilizing capital, likely had significant consequences for Egypt’s industrialization, as it did in other late industrializers (Gregg Reference Gregg2020). Reducing barriers to entry might have led to more extensive and efficient churning within the corporate form instead of the observed sluggish dynamics (Kerr and Nanda Reference Kerr and Nanda2009). Future research will need to grapple with the heterogeneity of firm dynamics across enterprise forms and distortions to incorporation to develop a more complete understanding of long-run growth in Egypt and other historical development settings.