I. INTRODUCTION
Magnesium (Mg) alloy, one of the lightest engineering materials, has low density, good thermal conductivity and damping vibration, high specific strength and stiffness, and excellent electromagnetic shielding and machinability.Reference Ugender, Kumar and Reddy1,Reference Wang, Jiang, Liu and Ge2 The joining methods of Mg alloys have always been an issue in many industrial fields. Therefore, high-quality welding techniques are required for the manufacture of complex Mg alloy structures. Tungsten inert gas (TIG) welding is widely used for the production of magnesium alloy joints due to its practicability and economy. However, the shallow penetration of TIG welding in magnesium alloys is a problem. Although penetration can be increased by improving the heat input, coarse grains and poor joints properties induced by porosity and shrinkage porosity are also accompanied.Reference Shu, Sun, Zhao, Song, Sui, He, He, Liu and Xu3 Therefore, obtaining deep welds, refining crystalline structure, and removing defects were the main ways to achieve a high-quality, high-strength, and tenacious magnesium alloy welded joints.
To solve the problems of the shallow penetration, a novel technique, called activating flux tungsten inert gas (A-TIG) welding, was invented by Paton Welding Institute. In the previous works,Reference Morisada, Fujii and Ni4 A-TIG welding successfully improved the penetration by coating the active powder on the surface of base metals before welding process. To achieve a higher quality level of the welds, Liu et al.Reference Liu and Sun5 and Shen et al.Reference Shen, Li, Zhai, Wen, Liu and Dai6,Reference Shen, Liu, Li, Li and Wen7 improved this technique by applying micron-sized and nano-sized SiC particles mixed with activated flux, respectively, and then conducted A-TIG welding to refine the Mg grains and strengthen the welds. The good wettability with magnesium matrix, low cost, and high hardness made SiC particles suitable as a reinforcement phase added into the magnesium alloy. According to the research results,Reference Chen, Jiang, Ma, Li and Hao8,Reference Xie, Shen, Cheng, Li and Pu9 after a small amount of SiC particles fused in the AZ31 magnesium alloy, some new phases (Al4C3 and Mg2Si) were formed by chemical reaction. Al4C3 acted as a nucleating agent to refine the α-Mg grains while the Mg2Si enhanced the mechanical properties of the magnesium alloy by acting as a strengthening phase.
Besides the strengthening and hardening effects of SiC, studies of rare earth elements microalloying in magnesium alloys has also been an hot issue recently. Adding rare earth elements into magnesium can enhance the corrosion properties, improve the creep resistance, and provide several kinds of strengthening such as fine grain strengthening, solid solution strengthening, and precipitation strengthening.Reference Arrabal, Pardo, Merino, Mohedano, Casajús, Paucar and Garcés10–Reference Zhu, Easton, Abbott, Gibson and Nie12
In recent years, cerium (Ce), the most abundant rare earth element, has been widely studied in magnesium alloys. Chen et al.Reference Chen, Zhao, Zhu, Wang and Tao13 studied the effect on the friction and wear properties of welded AZ91 alloys added with Ce, and found that the addition of Ce in magnesium alloy joints could improve the wear resistance of Mg alloys. Sliva et al. found that the addition of La–Ce mischmetal in ZK60 casting alloys could inhibit the formation of hot cracks, and build up thin and dense surface films that improve corrosion resistance. Besides, some high melting point phases containing Ce and Al would be formed in magnesium alloys, which could improve the flow of liquid metal, inhibit the formation of hot cracks, and build up a thin surface film that improves corrosion resistance.Reference Silva, Marques, Nossa, Alfaro and Pinto14 Thus, it can be seen that Ce can not only refine the grains, but also reduce the defects of welded joints, thereby improving the mechanical and corrosion properties of welded joints.
Above all, it would be beneficial to obtain excellent performance of magnesium alloy welded joints considering the effect of both rare earth elements and SiC nanoparticles. Therefore, the purpose of this paper is to study the synergistic effects of the mixed reinforcement particles containing different ratios of Ce and SiC on the microstructure and mechanical and corrosion properties of AZ31 magnesium alloy welded joints. The theoretical and experimental bases were provided for connection technology of aerospace materials.
II. EXPERIMENTAL
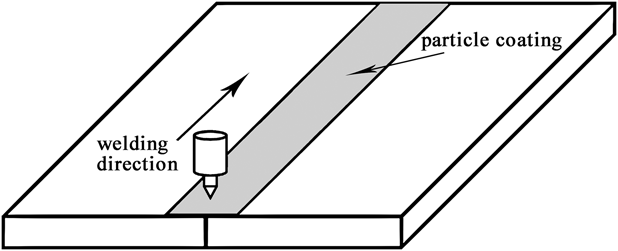
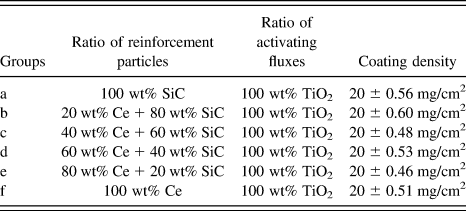
Hot-extruded AZ31 alloy (nominal composition Mg–3% Al–1% Zn–0.3% Mn–0.1% Si, by weight) plates with thickness of 5 mm were cut into samples with a dimension of 100 × 50 mm for TIG welding. Ahead of applying the coating, the surface of all sheets was ground by sand paper and then cleaned with acetone to remove oxides and greases. The composite reinforcement particles, which contained different ratios of cerium powder (90 μm, produced by Ganzhou Xinzheng New Material Co., Ltd., Ganzhou, China) and SiC particles (40 nm, produced by Xuzhou Jiechuang New Material Technology Co., Ltd., Xuzhou, China), were mixed with an equal mass of TiO2 (50 μm) powder, which was used as activating fluxes. These three kinds of powder were mixed with alcohol and coated on the top surface of each specimen with a width of 10 mm before the welding process (as seen in Fig. 1). Two plates were butt-welded by the AC automatic welding machine (NSA-500-1). The coating density was 20 (±0.60) mg/cm2 and calculated with the following method:
 $$\rho = {{{m_2} - {m_1}} \over S}\quad ,$$
where S is the coated area and m 1 and m 2 are the weights of plates before and after the coating, respectively. The specific compositions of the mixed powder are listed in Table I. The details of welding parameters were as follows: welding current was 125 A (AC), arc length was 2 mm, welding speed was 200 mm/min, and flow rate of argon gas was 10 L/min.
Schematic diagram of TIG welding and surface coating.

Specific compositions of the mixed powder and coating density.

For evaluating the mechanical properties of welded joints and base metals, tensile test was performed using two types of samples. One was the transverse specimens taken perpendicularly to the welding direction with the joints in the center of gauge length, and the other was base materials (according to the ASTM standard: E8/E8M-13a). The test was carried out using an electronic tensile test machine (SANS XYA105C, Shenzhen Xin San Si Material Testing Co., Ltd., Shenzhen, China) at a cross-head speed of 1 mm/min at room temperature. At least three specimens were tested for each group of conditions, and the average value was taken as the strength of the joints. Moreover, the microhardness measurement was conducted using an automatic tester (HX-1000TM, Shanghai Optical Instrument Plant, Shanghai, China) under a load of 100 g for 10 s and the values were obtained by taking the mean from five data points.
Before microstructure characterization, the specimens were ground and polished and then etched using a reagent made by 1 g picric acid, 10 mL ethyl alcohol, 2 mL acetic acid, and 3 mL distilled water. A scanning electron microscope (SEM; TESCAN VEGA II LMV, TESCAN, Brno, Czech Republic) operating at 20 kV was used to evaluate the microstructure of the samples. The phases in magnesium joints were analyzed using energy-dispersive X-ray spectroscopy (EDS; ISIS300, Oxford Instruments, Abingdon, UK) and X-ray diffraction (XRD; D/Max-2500PC, Rigaku Corporation, Tokyo, Japan).
The electrochemical corrosion measurements of AZ31 joint samples were obtained by an RST5000 electrochemistry workstation using a three-electrode system to investigate the corrosion property of the joints affected by different reinforcement particles. All the specimens acted as the working electrode, while a platinum foil and a saturated calomel electrode (SCE) served as the counter and reference electrodes, respectively. The section of the weld was inlaid by resin to let only the area of FZ come into contact with the corrosive medium, which was 3.5 wt% NaCl solution, during the test. The polarization curves were measured in the applied potential ranging from −0.8 VSCE to 0.8 VSCE with the scan rate of 1 mV/s after the specimens had been immersed in the electrolyte for 30 min. Electrochemical impedance spectroscopy (EIS) measurements were conducted at open-circuit potential (OCP) in the frequency range from 105 Hz to 10−2 Hz with a voltage amplitude of 10 mV. The tests were carried out twice to ensure the repeatability of the results, and the ZView 2 software (Solartron Metrology, West Sussex, UK) was used to build the appropriate circuits and obtain calculation data.
III. RESULTS AND DISCUSSION
A. Macro-morphologies and microstructures of welded seams
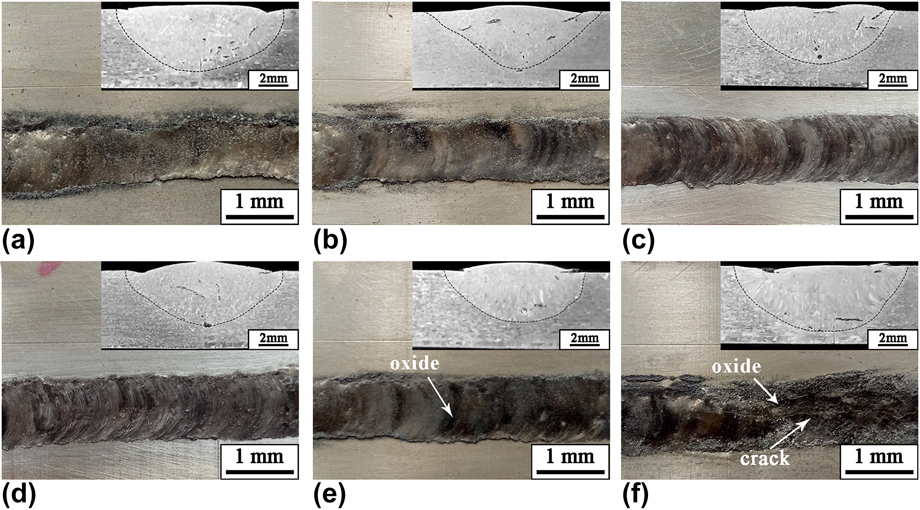
The surface appearances and outlines of the fusion zone (FZ) of AZ31 magnesium alloy joints welded by nanoparticles strengthening activating flux TIG (NSA-TIG) welding are shown in Fig. 2. The width and depth of TIG-welded seam did not show great changes in different groups of samples because of the equal mass of TiO2. However, the appearance of joint using 100% Ce reinforcement particles coating deteriorated and crack occurred in the middle of the joint according to Fig. 2(f). There were some pores and undercut appeared in welding joints, and more black oxides were formed on the surface of the joints with the increase of Ce addition in reinforcement particles.
Images of the macro-appearances and cross sections of the NSA-TIG-welded AZ31 magnesium alloy seams using different reinforcement particles: (a) 100 wt% SiC, (b) 20 wt% Ce + 80 wt% SiC, (c) 40 wt% Ce + 60 wt% SiC, (d) 60 wt% Ce + 40 wt% SiC, (e) 80 wt% Ce + 20 wt% SiC, and (f) 100 wt% Ce.
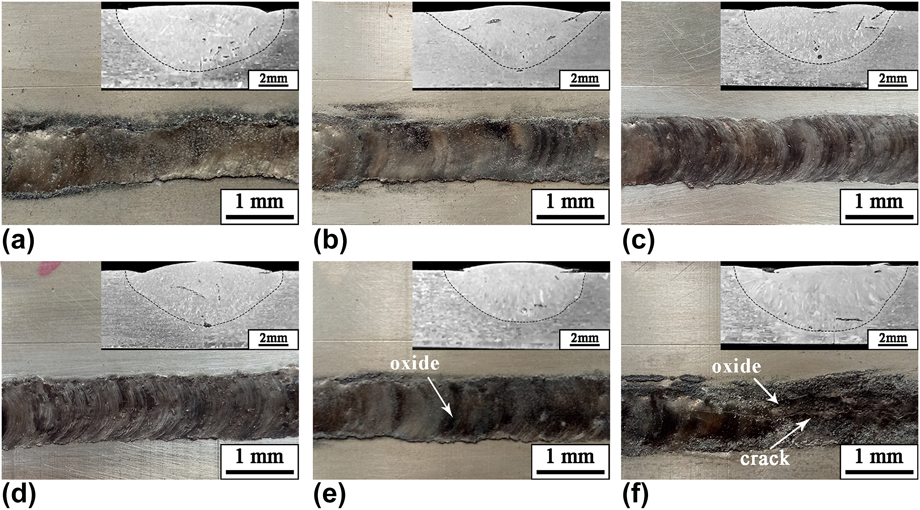
According to previous researchers,Reference Lin and Yan15 the shape of the welding seam could be affected by the liquid flow of the melting pool. When the welding seam was coated with active flux during the process, the flow of the top surface turned into the reversed Marangoni convection and deepened the penetration. Besides, oxygen, which was disaggregated during welding under TiO2 coating, transferred into the molten metal to change the surface tension temperature coefficient from negative to positive. In addition, the agglomeration of mixed particles could slow down the flow speed of the welding pool, thereby causing the defects such as pores, undercuts, and cracks.Reference Xie, Shen, Cheng, Li and Pu9 When SiC reinforcement particles were replaced entirely with Ce powder, the active chemistry property of Ce led to more dramatic reaction during welding process and more heat was produced. So the heat input was increased resulting in a larger FZ. Moreover, the agglomeration of Ce and the formation of black oxides resulted in an ugly appearance and poor performance of the joints. Gao et al. indicated that Ce could play a part in forming oxides because the interference of oxygen was not excluded and the agglomeration of Ce became more serious without SiC particles.Reference Gao, Dong and Han16
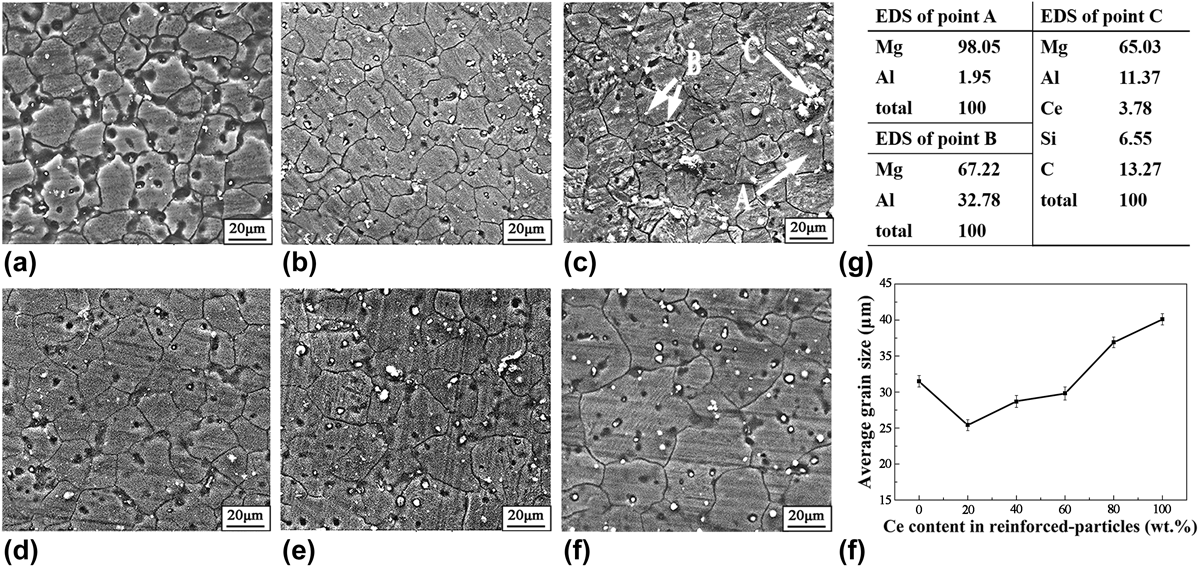
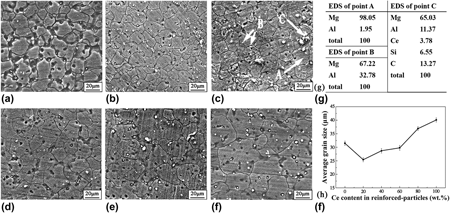
Figure 3 shows the SEM images, EDS results, and data of average grain size (d) measured by an image analyzer in the FZ of the joints. From Fig. 3, it is easy to observe that equiaxed grains were the main type in the middle of FZ and the grain size in FZ reached a minimum when 20 wt% Ce was added into the reinforcement particles. However, with the further increase in Ce content, the grain size increased gradually.
SEM images of joints using different reinforcement particles: (a) 100 wt% SiC, (b) 20 wt% Ce + 80 wt% SiC, (c) 40 wt% Ce + 60 wt% SiC, (d) 60 wt% Ce + 40 wt% SiC, (e) 80 wt% Ce + 20 wt% SiC, (f) 100% Ce, (g) EDS results, and (h) average grain size in the FZ.

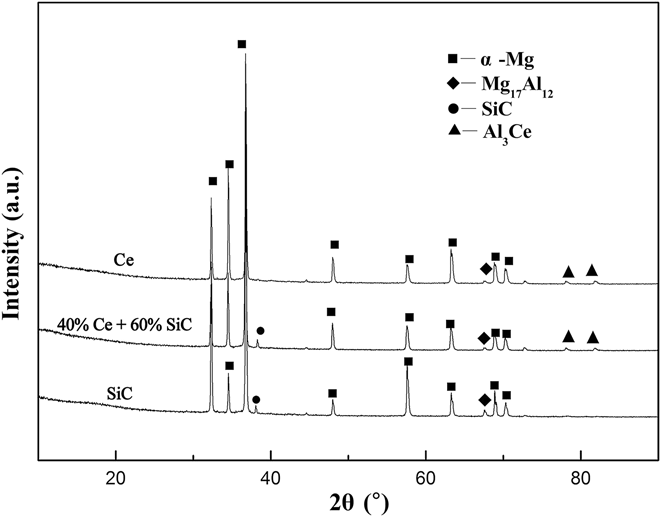
Three kinds of phases in the welding seam using 40 wt% Ce + 60 wt% SiC as reinforcement particles were examined by EDS, and the results are listed in Fig. 3(g). According to the EDS results and Mg–Al binary phase diagram,Reference Zhu, Chen and Gao17 intermetallic compound β-Mg17Al12 eutectic phase [marked with arrows B in Fig. 3(c)] and some second-phase particles [marked with arrow C in Fig. 3(c)] were dispersed in the primary α-Mg grains [point A in Fig. 3(c)] as well as the grain boundaries. Therefore, the second phases which consist of Ce, Si, and C elements were supposed to be Al3Ce and SiC particles by studying the diffraction peak of XRD presented in Fig. 4. EDS results and graph of XRD revealed the existence of four phases (α-Mg, β-Mg17Al12, Al3Ce, and SiC) in the welding joint when mixed Ce and SiC reinforcement particles coatings were applied.
XRD result of the FZ of joints using SiC powder, 40 wt% Ce + 60 wt% SiC mixed powder, and Ce powder as reinforcement particles.

According to Shang et al.,Reference Shang, Jung, Yue, Verma and Essadiqi18 the smaller solubility of Ce in Mg matrix (only 0.5% in Mg–Ce binary system) compared to Al and Zn in Mg (12.7% Al and 6.2% Zn in Mg–Al and Mg–Zn binary system) led to the accumulation of Ce on the solid/liquid interface. Moreover, due to the active character and larger electronegativity difference of Ce compared to Al, the reaction between Ce and Al was easily started, resulting in the formation of Al3Ce phase with high thermal stability instead of irregular shapes β-Mg17Al12 particles in the FZ and inhibiting the growth of α-Mg grains during welding process.Reference Chen, Zhao, Zhu, Wang and Tao13 However, overdose of Ce element in welding joints relieved the grain refinement because of the severe aggregation and easy oxidation of Ce particles. The higher heat input on the FZ under more Ce particles in the coating also led to the coarsening of α-Mg grains.
B. Mechanical properties of welding joints applying different ratios of Ce and SiC in reinforcement particles
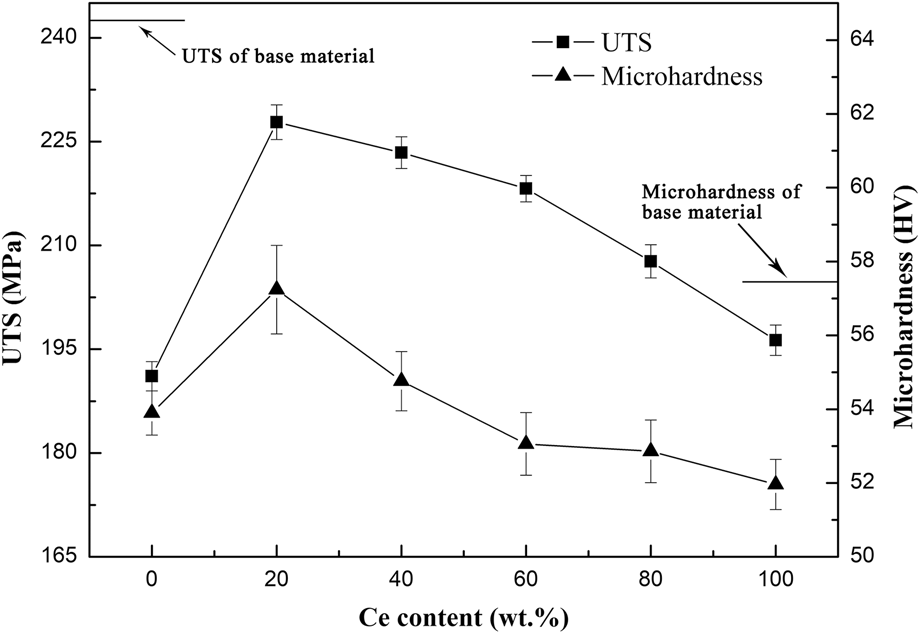
Figure 5 shows the test results of microhardness and UTS of AZ31 magnesium NSA-TIG welding joints using different mixed-particle coating. According to Fig. 5, the microhardness and UTS of FZ increased sharply and reached a maximum (56.97 HV and 227.8 MPa, respectively) when the Ce content was 20 wt% in the reinforcement particles coating. However, both the value of microhardness and UTS decreased gradually with further increase in the amount of Ce in the reinforcement particles.
Average hardness and UTS value of AZ31 joints.

Grain size of primary phase and the spacing between second-phase particles were the main factors of mechanical properties of alloys. According to Hall–Petch relationship and Orowan hardening mechanism,Reference Stanford, Geng, Chun, Davies, Nie and Barnett19,Reference Yuan, Panigrahi, Su and Mishra20 a decrease in the grain size and short distance between the second-phase particles resulted in the improvement of microhardness and UTS of an alloy. When the amount of Ce in the reinforcement particles coating increases up to 20 wt%, a relatively low heat input and more dispersed second-phase particles led to a smaller size of α-Mg grains and spacing between the second-phase precipitates (as seen in Fig. 3). In addition to grain refinement, the dispersed particles (β-Mg17Al12, Al3Ce, and SiC) could hinder the movement of the dislocations and increase the dislocation density due to the coefficient of thermal expansion (CTE) mismatch between the matrix and second-phase particles.Reference Kim, Sohn, Nezafati, Ferguson, Schultz, Bajestani-Gohari, Rohatgi and Cho21 However, with further addition of Ce in the reinforcement particles, the UTS and microhardness decreased gradually due to the coarsening of grain size. Besides, large oxides and agglomerates were drawn into the joints during welding process and led to the formation of pores and cracks [as seen in Figs. 2(e) and 2(f)] that weakened the joints.
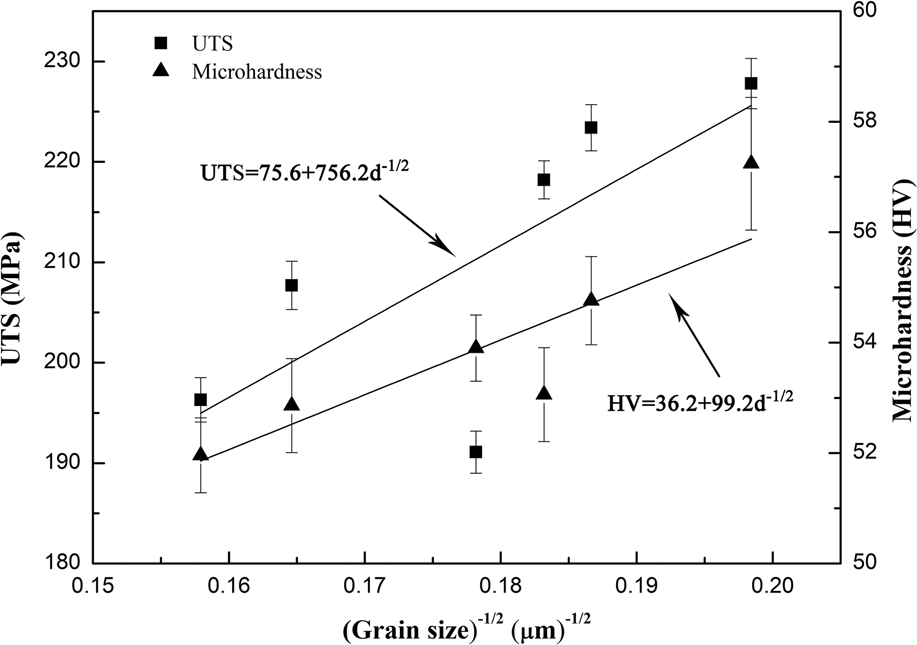
The contribution of grain refinement to the mechanical property levels of the FZ could be evaluated by the classical Hall–Petch equation:
 $${\sigma _{{\rm{HP}}}} = {\sigma _0} + K{d^{ - 1/2}}\quad ,$$
where σ0 is the lattice intrinsic resistance to dislocation motion, K is the Hall–Petch coefficient that describes the effect of grain boundaries to the strength, and d is the matrix grain size. Figure 6 reveals the Hall–Patch relationship between the UTS, microhardness, and grain size of the FZ. The fitting curves clearly present the increasing tendency of the UTS (UTS = 75.6 + 756.2d −1/2) and microhardness (HV = 36.2 + 99.2d −1/2) values under grain refinement.
The Hall–Petch relationship between the UTS, microhardness, and grain size.

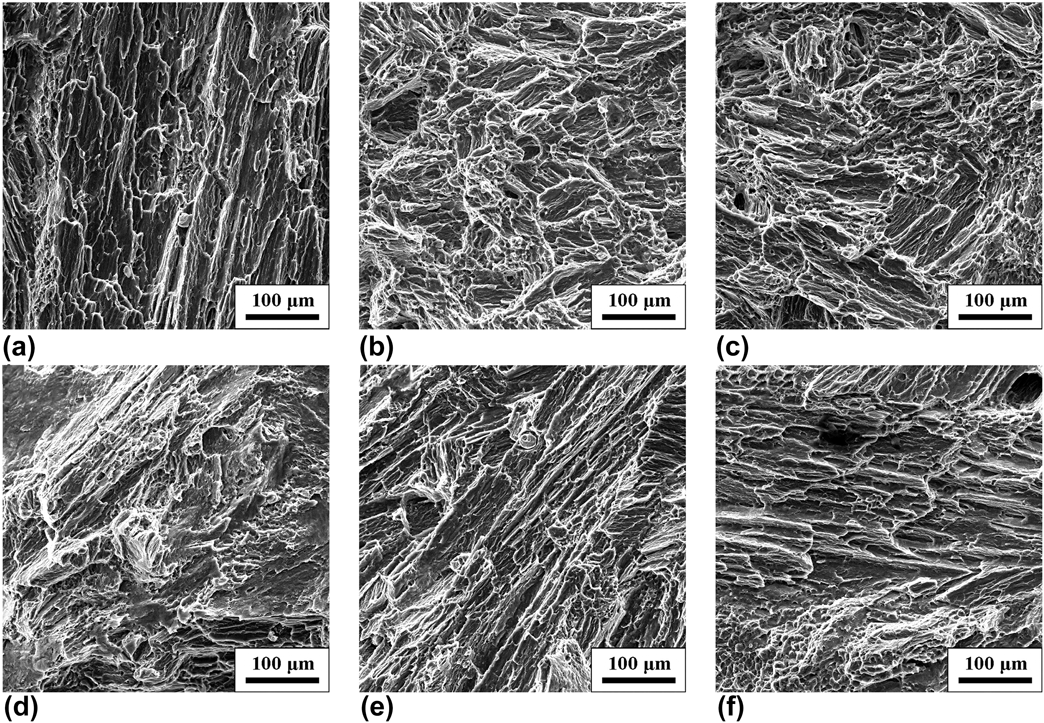
The SEM images of the tensile fracture appearance of NSA-TIG-welded AZ31 magnesium alloy joints with varying contents of Ce in the reinforcement particles are shown in Fig. 7. All the tensile fractures of samples occurred inside the weld joint. The typical surface appearance of the fracture presented a mixed feature containing a large number of ductile dimples and a few cleavage facets. Most of the fracture types were transgranular fracture which was formed by crack propagating along the special crystallographic planes. Moreover, the size and type of α-Mg grains could also influence the fracture mode. When a low amount of Ce was added in the reinforcement particles, the joints underwent a ductile–brittle mixed fracture. The cleavage planes on fracture surface were smaller and had different directions due to the finer grains and more dispersed particles in the grains and on the grain boundaries [as seen in Fig. 7(b)]. Thus, the strength of the joints were enhanced by the dispersed particles.Reference Zhou, Shen, Hu, Gao and Li22 With the increase in grain size in the FZ resulting from the more Ce addition, the direction of the cleavage planes became more and more uniform [as seen in Figs. 7(d)–7(f)], and there were big tear ridges in these fracture surface.
Tensile fracture surface of TIG welding joints using different reinforcement particles: (a) 100 wt% SiC, (b) 20 wt% Ce + 80 wt% SiC, (c) 40 wt% Ce + 60 wt% SiC, (d) 60 wt% Ce + 40 wt% SiC, (e) 80 wt% Ce + 20 wt% SiC, and (f) 100% Ce.

C. Corrosion property of the welding joints with different additions of Ce in the reinforcement particles
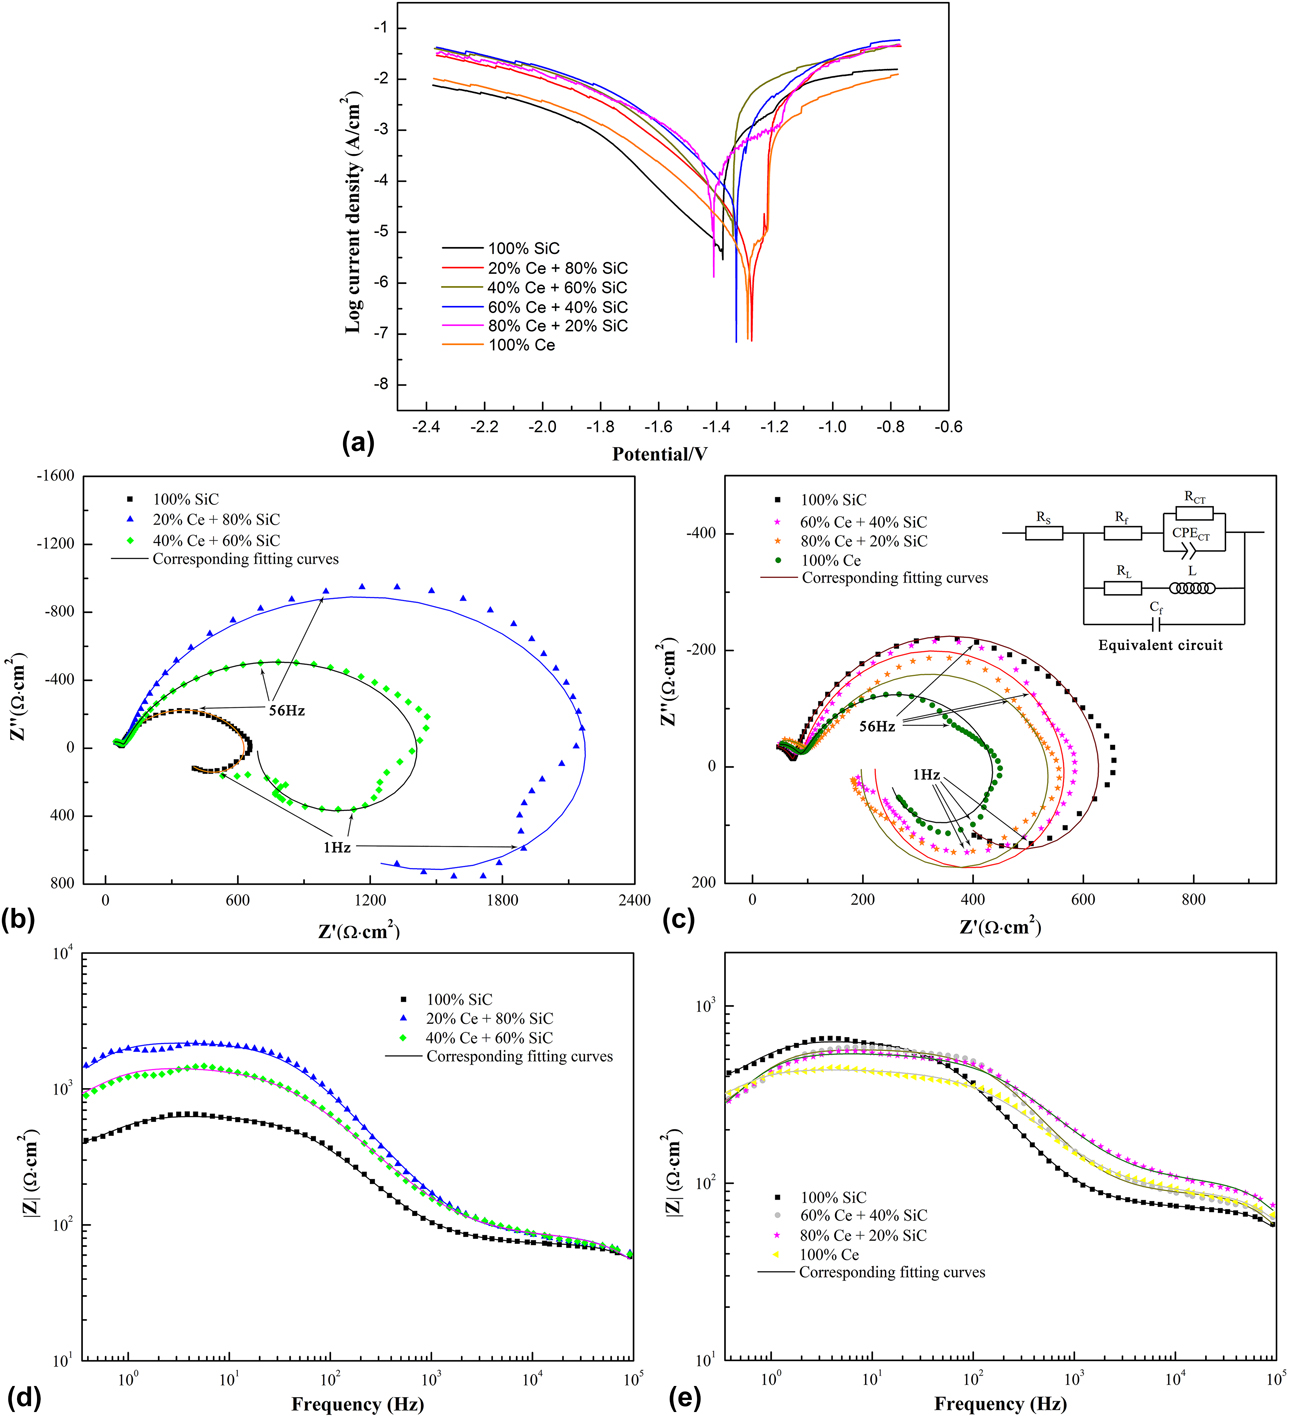
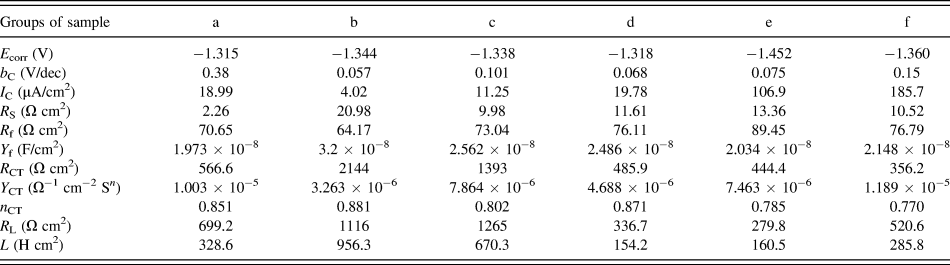
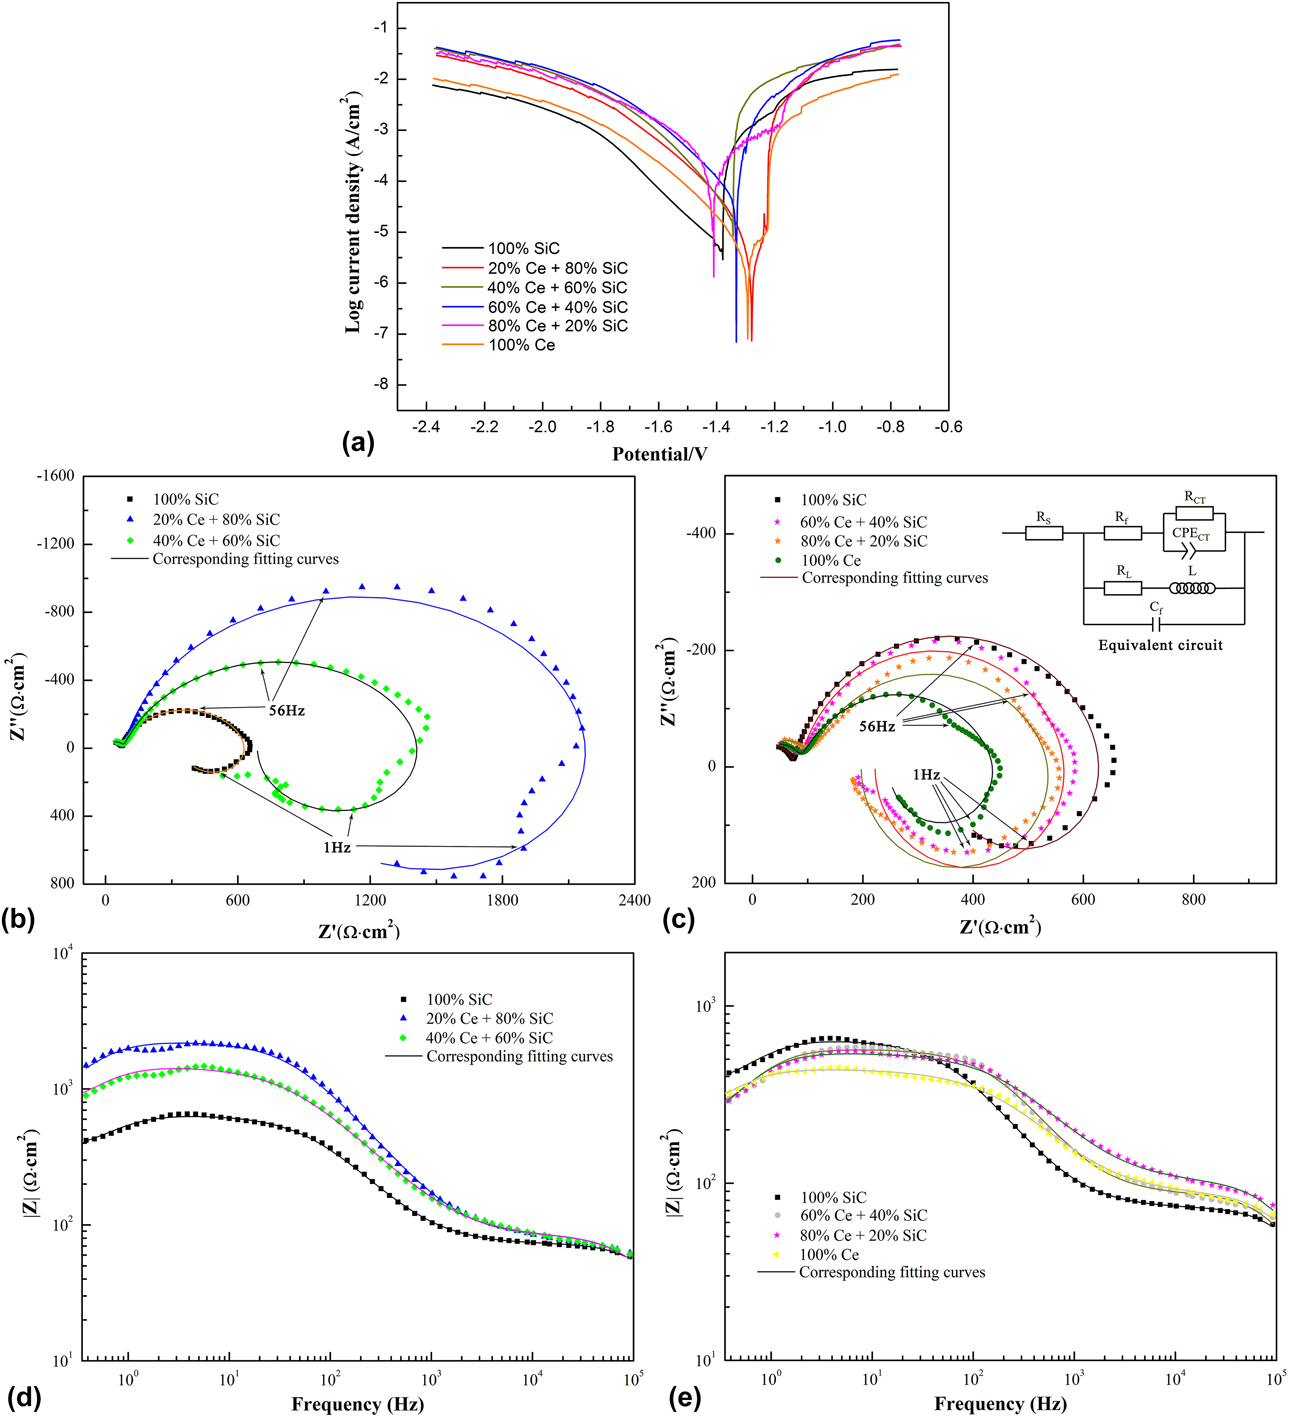
Figure 8 shows the electrochemistry test results of NSA-TIG-welded joints with different coatings. The polarization curves of the joints were measured after the OCP is stable in 3.5 wt% NaCl solution, as seen in Fig. 8(a). The cathodic branch of the curve of all samples was apparently gentler than the anode branch, which indicated that the cathodic process was more important in corrosion reactions.Reference Liu, Cao, Chang, Zhang and Zhang23 All the welded joint samples remained active in the scanned potential range. The results of corrosion potentials (E corr), slopes of cathodic branches (b C), and corrosion current densities (I C) were evaluated from the corresponding polarization curves and are listed in Table II. Generally, the more positive E corr value indicates the better corrosion resistance, while the lower I C is related to the slower corrosion rate of substances. When coated with 20% Ce and 80% SiC as reinforcement particles before welding, the magnesium joint possessed the lowest corrosion current density. Excess of Ce content in Ce–SiC mixed particles increased the corrosion current densities of the welding joints according to Table II. The addition of Ce with SiC reinforcement particles has a slight effect on the corrosion property of NSA-TIG-welded AZ31 magnesium alloy joints because the formation of less cathodic Ce-containing phases was promoted.Reference Liu, Cao, Chang, Zhang and Zhang23 However, the corrosion potential of the joints was not affected obviously by Ce addition, and the relationship between the corrosion current density and corrosion potential could almost be negligible.Reference Cain, Madden, Birbilis and Scully24 Due to the negative difference effect (NDE) of magnesium alloys, the polarization behavior of magnesium alloys is complicated and cannot be simply described. So EIS measurements were carried out to better estimate the corrosion behavior of magnesium welding joints.
Electrochemical test of NSA-TIG-welded magnesium alloy joints using different reinforcement particles: (a) polarization curve, (b and c) Nyquist plot with embedded equivalent electrical circuit, (d and e) Bode plots.
Parameters evaluated from the polarization curves and fitting data of EIS plots.

The EIS plots of magnesium alloy joints using different reinforcement particles coating are depicted in Figs. 8(b)–8(e). In all cases, the Nyquist plot was characterized by two capacitive loops in high frequency range and intermediate frequency range, as well as an inductive loop in low frequency range. The disperse points at low frequency range may be caused by the activeness of magnesium and instability of the electrochemical system. The small capacitive loop in the high frequency range could be explained as the slight passivation layer at the beginning of the test, while the big loop in the intermediate frequency range represented the charge transfer resistance of Mg alloy joints substrate. The inductive loop in the low frequency range was related to the adsorption of reaction products in the surface of Mg electrode.Reference Liu, Yang, Li, Yuan, Zheng, Cui, Yang, Yeung and Wu25 According to the corrosion process of magnesium alloy under 3.5 wt% NaCl solution and the literature,Reference Wang, Shen, Xie, Duan and Xie26 the equivalent circuit embedded in Fig. 8(c) was established to fit the EIS results. In the circuit, R S is the solution resistance, R f is the resistance of the passivation film, R CT is the charge transfer resistance of the joint substrates, C f represents the capacitance of the surface passivation film, and CPECT represents the constant phase elements which is often used to replace a capacitance to express the non-ideal situation of the interface. All the parameters evaluated from the fitting EIS plot are listed in Table II. In each tested group, the value of R f was much lower than that of R CT, which was a coincident with the radius of capacitive loops in Nyquist plot [Figs. 8(b) and 8(c)], and the value of R CT was the main reflection of the corrosion resistance of the samples.
Magnesium alloy joint using 20 wt% Ce and 80 wt% SiC as reinforcement particles possessed the highest corrosion resistance, which is indicated by the largest diameter of the capacitive loop in Nyquist plot and highest R CT value, as seen in Figs. 8(b) and 8(c) and Table II. In addition, the EIS spectrum obtained from group c (using 40 wt% and 60 wt% SiC as reinforcement particles) sample also exhibited a larger capacitive loop and higher fitting R CT value than that of the joint using 100 wt% SiC as reinforcement particles. However, with higher composition of Ce, the corrosion resistance of the joints showed a little deterioration. The Bode plots shown in Figs. 8(d) and 8(e) also reveal the corrosion behaviors of the samples. The impedance of the joint using 100 wt% SiC as reinforcement particles was below 103 Ω cm2 in low frequency range (f → 0), while this value obtained from sample b and c (added 20 wt% and 40 wt% Ce in reinforcement particles, respectively) both exceeded 103 Ω cm2. The increase in the value of impedance indicated a significant improvement in corrosion resistance of Mg joints due to the Ce addition.Reference Zhao, Xie and Zhang27 The EIS results were in good accordance with the polarization test shown in Fig. 8(a); thus, the corrosion property of the Mg alloy joints was clearly revealed through the electrochemical tests.
IV. CONCLUSIONS
The effects of SiC on the macro-morphologies, microstructures, and mechanical and corrosion properties of NSA-TIG-welded AZ31 magnesium alloy joints were investigated. The conclusions were drawn as follows:
(1) Different ratios of Ce and SiC in the reinforcement particles used on AZ31 magnesium alloys produced little changes in the size of TIG welding joints. The reaction of Ce in the joints caused the formation of Al3Ce precipitates and refined the grains in FZ together with SiC particles and β-Mg17Al12 phase. When using reinforcement particles containing 20 wt% Ce and 80 wt% SiC, the average size of α-Mg grains reached the minimum (25.4 μm). Excess of Ce content damaged the macro-appearance of the welding seam and formed defects in joints due to the agglomeration of particles and oxides. Grain coarsening also occurred with the increase in the heat input.
(2) Microhardness and UTS of the TIG-welded joints achieved the highest value, 56.97 HV and 227.8 MPa, respectively, when the Ce content was 20 wt% in reinforcement particles. The grain size and dispersion of second-phase precipitates were the main contribution to the improvement of mechanical properties of the joints. However, the value of microhardness and UTS decreased gradually with further addition of Ce content because of defects and grain coarsening of the joints.
(3) The addition of Ce element significantly improved the corrosion resistance of NSA-TIG-welded AZ31 magnesium alloy joints. the joint using 20 wt% Ce and 80 wt% SiC as reinforcement particles had the lowest corrosion current density and highest corrosion resistance among the other groups. The corrosion property deteriorates when more than 40 wt% Ce was added into the reinforcement particles.
ACKNOWLEDGMENTS
This research is supported by a Science and Technology Project of Beibei district of Chongqing of China (Project No. 2016-27), a foundation of the State Key Laboratory of Mechanical Transmission of Chongqing University of China (Project No. SKLMT-ZZKT-2017M15), and an Industry Joint Technology Innovation Project of Suzhou of China in 2017.