


INTRODUCTION
Collective action is social. When a person joins a protest, contributes to a public good, participates in a campaign rally, mobilizes for conflict, or supports a rebel movement, she does so alongside other people. A wealth of theory suggests that the way people are interconnected in social networks affects their collective outcome. The existence of social ties among activists should affect whether protest breaks out (Siegel Reference Siegel2009). The depth and type of social ties among citizens should affect the quality of civil society (Putnam Reference Putnam2001). The pattern of ties among contributors should affect whether a public good is funded (Bramoullé and Kranton Reference Bramoullé and Kranton2007). The presence or absence of certain network positions should affect whether ethnic groups can coexist peacefully (Larson Reference Larson2017).
Foundational theories like these in political science have been notoriously difficult to test because collecting rich data on social ties is fraught with difficulties (Siegel Reference Siegel2009; Larson and Lewis Reference Larson and Lewis2017). Traditional methods of measuring ties interconnecting a group of people are error prone and expensive. The difficulties compound for studies of collective events in which the participants are hard to identify, the ties must be measured ex post, or the event was sensitive—features describing many instances of collective action of interest to political science.
Online social media offer an unprecedented data opportunity. Platforms like Twitter and Facebook have become commonplace tools of 21st-century collective action, used in settings ranging from the Occupy Movement and the Arab Spring protests to the ISIS insurgency. These platforms allow and encourage users to formally establish a set of other users as their social contacts. Fortunately for researchers, and starkly different from traditional survey methods, ties on social media are observable.Footnote 1 The relative ease of measurement, combined with the immense amount of additional data, make these online sources particularly promising.
With a vast source of data newly available, the field has arrived at what could be a watershed moment. One lingering issue stands between researchers and a potential treasure trove of data: external validity. Specifically, are the relationships measured between a person and her online peers informative of the kind of offline relationships to which network theories typically speak? The potential to convincingly test network theories of collective action, both about the existence of ties and their arrangement within a network, using online social tie data depends crucially on whether online social ties are sufficiently similar to offline, “real-world” ones.
Although much hinges on the answer to this question, little empirical work assesses it, in part because survey methods typically used to learn about offline social ties are significantly different from methods used to extract the ties and their characteristics from online social media, precluding comparison. Given that online space is very different from the offline real world, it is not obvious that personal relationships and behavior manifest comparably in both. If online ties are different in kind, or if people respond to them differently than offline ties, then online social network data would be unsuitable for testing general network theories.
This article is the first to systematically address potential fundamental differences between online and offline ties on a broad scale. We implemented a survey experiment on Amazon Mechanical Turk (MTurk) that elicited online and offline social ties in an identical way. The survey began by asking respondents to name ties meeting certain criteria. In this step, treated respondents were told to list people with whom they interact online, whereas control respondents were told to list people with whom they interact offline. After eliciting the names of ties, the survey proceeded identically for treated and control respondents. Subsequent questions displayed the provided names to measure the nature of each relationship and the influence of these ties on hypothetical behavior. Our survey generates measures of the strength of each tie with respect to 17 commonly used dimensions, as well as the relationship between ties and five hypothetical outcomes: generosity, joining a nonviolent protest, joining a violent protest, sharing information about a nonviolent protest, and sharing information about a violent protest.
We find that the nature of ties, the relationship between their strength and outcomes, and the form of deviations from these relationships are statistically indistinguishable between the online and offline domains. These null findings are precisely estimated zeros and not the product of respondents misunderstanding the survey, as we document significant treatment effects in other areas. This parity is robust to a variety of tie strength measures and model specifications, and, interestingly, is not due to a shared identity of online and offline ties but a shared nature of these relationships.
In short, the essence of social relationships and the determinants of their strength or weakness are broadly comparable in the online realm and the offline world to which the preponderance of network theories pertain. These encouraging findings support network theory testing with online data and affirm the external validity of studies in a growing and potentially vast future literature throughout the social sciences.
TESTING SOCIAL SCIENCE NETWORK THEORIES
A social network is a set of relationships among a group of people. These relationships, or “ties,” can vary both in their nature, the qualitative features underlying the relationships, and in their function, the consequences of their presence. For instance, ties can range from acquaintanceships, in which a person shares only superficial details, to intimate connections characterized by deep levels of trust, knowledge, and affection (in this article, we measure 17 dimensions along which the nature of a tie can vary). Ties can, due to their nature, have consequences ranging from motivating individual actions such as generous behavior to facilitating social activities such as passing information and participating in a protest, to name just some examples.
According to social network theory, both the existence and the arrangement of certain ties can affect collective outcomes. Although exactly which ties are thought to affect which outcomes and why differs by subject area, the theories share a common form: presence or arrangement of ties affects the outcome given that the ties are of a particular nature. In Conley and Udry (Reference Conley and Udry2010), the existence of ties among farmers that are sufficiently friendly to transmit information increases the adoption of fertilizer. In Chwe (Reference Chwe2000), ties that are based on trust can, if arranged into tight-knit cliques within a network, facilitate protests.
In addition to the work by Conley and Udry (Reference Conley and Udry2010) described previously, a large body of empirical work corroborates the importance of the existence of certain ties across a wide range of contexts. Ties that facilitate political discussion affect public opinion (McClurg Reference McClurg2006), ties that convey trust affect the strength of civil society (Jackson et al. Reference Jackson, Rodriguez-Barraquer and Tan2012), and so on for outcomes ranging from political participation to health to rebellions (Sinclair Reference Sinclair2012; Christakis and Fowler Reference Christakis and Fowler2013; Parkinson Reference Parkinson2013). Studies in this branch of the literature emphasize the relationship between different dimensions of the nature of a social tie and the function the tie serves in molding behavior to produce some outcome.
A different branch of the literature explores the effect of the “network structure” on collective outcomes. Ties of a certain nature that are arranged in a certain way affect outcomes. Theory suggests that certain ties arranged into cliques facilitate protest (Chwe Reference Chwe2000), certain ties that bridge distinct subgroups improve employment prospects (Granovetter Reference Granovetter1973), certain ties arranged into enclaves incentivize corruption (Ferrali Reference Ferrali2016), and so on for outcomes related to policymaking (Patty and Penn Reference Patty and Penn2014), public goods contributions (Bramoullé and Kranton Reference Bramoullé and Kranton2007), and interethnic cooperation (Larson Reference Larson2016).
Because of their reliance on network data, both branches of the literature face challenges in validating their theories empirically. Testing consequences of the existence of ties requires, at a minimum, a record of the relationships each respondent maintains, which can be difficult to observe or measure. Testing consequences of network structure requires a precise record of the presence or absence of every possible tie between any two people of interest. Traditional methods of measuring social networks typically entail lengthy surveys asking respondents to recall their social contacts, which can be time consuming, expensive, error prone, and limited by construction, as when researchers ask for a capped number of ties from each respondent. When researchers conduct studies of full networks, they do so despite these significant challenges.
The difficulty of collecting rich network data has allowed network theory to outpace empirical testing in many subject areas pertaining to collective action; protests and civil conflict are two cases in point.Footnote 2 Theories of protests suggest that structural network features like density, cliques, bridges, and path lengths should affect the likelihood of protest (Marwell et al. 2000; Centola and Macy Reference Centola and Macy2007; Siegel Reference Siegel2009), but empirical tests with offline data have been limited to determining the consequences of having strong ties to other protest participants (Opp and Gern Reference Opp and Gern1993; McAdam and Paulsen Reference McAdam and Paulsen1993).Footnote 3 The lack of detailed network data has precluded testing the effects of many of these richer features of network structure (Siegel Reference Siegel2009). Similarly, theories of civil conflict suggest that subtle structural features like ties that connect members of different ethnic groups occupying certain network positions (Larson Reference Larson2016) and the presence of highly peripheral positions in ethnic networks (Larson Reference Larson2017) can affect interethnic conflict. However, like the area of protests, empirical work in the area of civil conflict using offline data has similarly been limited to indirect measures inferring the existence of ties (Parkinson Reference Parkinson2013; Staniland Reference Staniland2014; Tezcür Reference Tezcür2016).
Online social media are a potential treasure trove of network data. Unlike most offline interpersonal relationships, social ties among users of these online platforms are directly observable, allowing researchers with access to easily measure the full social network. The potential usefulness of online social media data has been widely recognized (Lazer et al. Reference Lazer, Pentland, Adamic, Aral, Barabasi, Brewer, Christakis, Contractor, Fowler and Gutmann2009), and a wealth of studies have been undertaken to characterize online networks (e.g., Ahn et al. Reference Ahn, Han, Kwak, Moon and Jeong2007; Grabowicz et al. Reference Grabowicz, Ramasco, Moro, Pujol and Eguiluz2012), to relate online networks to online behavior (e.g., Centola Reference Centola2010; Aral and Walker Reference Aral and Walker2011; González-Bailón and Wang Reference González-Bailón and Wang2016), and, increasingly, to relate online networks to offline behavior (e.g., Bond et al. Reference Bond, Fariss, Jones, Kramer, Marlow, Settle and Fowler2012; Steinert-Threlkeld et al. Reference Steinert-Threlkeld, Mocanu, Vespignani and Fowler2015).
Despite the rapid proliferation of empirical studies using online social network data, a fundamental issue of external validity has yet to be resolved. To convincingly test network theories of collective action with online social media data, researchers must be able to answer a simple question: do networks of online ties correspond sufficiently to the offline networks that have been the subject of theory? Sufficient correspondence is a matter of the nature and function of ties. If online ties are fundamentally different in nature or function than offline ones, then online social network data would be unsuitable for testing network theories.
This correspondence is far from given. If people behave (Wilcox and Stephen Reference Wilcox and Stephen2013) or establish ties (Ellison et al. Reference Ellison, Steinfield and Lampe2007) or react to ties (Salganik et al. Reference Salganik, Dodds and Watts2006) in fundamentally different ways in the online and offline domains, then results from analyses connecting online social networks to outcomes may say little about the relationships theorized to exist between general social networks and these outcomes. There is ample reason for skepticism. Writing well in advance of the Internet, Stanley Milgram and Philip Zimbardo developed a psychological model of “deindividuation” to explain the impact of anonymity on social behavior (e.g., Milgram and Gudehus Reference Milgram and Gudehus1978; Zimbardo Reference Zimbardo1969). Their predictions of lower self-regulation, greater confidence, and the freedom from the norms enforced by a social hierarchy have been connected to technological advances dating back to the telegraph (Watt et al. Reference Watt, Lea, Spears, Rogers and Woolgar2002) and through to Internet survey takers (Joinson Reference Joinson1999). These theories raise a concern that the manner in which people relate to others in the online domain differs fundamentally from that in the offline domain, potentially rendering their online ties different in kind and function from offline ones.
Many have pointed out the need for exploring the correspondence between online and offline networks; however, little work has done so to date. One exception is Jones et al. (Reference Jones, Settle, Bond, Fariss, Marlow and Fowler2013), which aims to learn whether online interactions on Facebook can predict a person’s closest offline friend. To do so, the authors conducted a survey on Facebook asking users to identify their closest offline friend and then showed that interaction frequency on Facebook can predict the identity of this individual well.
Although showing the correspondence between online and offline friends on a single platform is an indisputably valuable contribution, our aim is broader. We seek to assess general parity in (1) the nature of ties, (2) the relationships between different measures of this nature and hypothetical behaviors relevant to collective action, and (3) the out-of-sample predictive accuracy of models, across the online and offline domains. Since the overlap between sets of online and offline contacts tends to be imperfect (Subrahmanyam et al. Reference Subrahmanyam, Reich, Waechter and Espinoza2008), we favor an approach that elicits either online or offline ties for a single user, but one that does so in an identical way across users. If online and offline ties are similar in kind and function despite the fact that each respondent is only reporting on either her online or offline ties, then we can be more confident that the parity we find is general. Our approach has the virtue of extending beyond a single platform, and it allows us to explore a source of parity broader than shared identity. Indeed, our results suggest that the parity we document persists despite subjects reporting different ties in the online and offline contexts, implying that it is not whom you know but how well you know them that drives outcomes of interest.
Overview of Our Approach and Findings
To determine the suitability of using online network data to test offline network theories, we elicit a set of social ties from respondents, randomizing whether the respondent provides online or offline ties. Our approach is unconventional in that our treatment is not designed to influence the subject’s behavior but rather is intended to elicit comparable social network datasets. As such, our counterfactual is not a different potential outcome but rather a different potential data environment. We leverage the random assignment to data elicitation by comparing online and offline social networks in three ways, corresponding to the standard methods of evaluating quantitative results in empirical studies: by assessing comparability of the online and offline tie measures (data parity), by assessing comparability of empirical estimates (relationship parity), and by assessing comparability of model predictions via out-of-sample accuracy (model parity).
First, we explore the nature of social ties by measuring the determinants of the strength of the personal relationship. Strong ties, according to Granovetter (Reference Granovetter1973), are those characterized by higher emotional intensity, greater intimacy, a longer duration, and a greater prevalence of reciprocal services. Building on the approach of Gilbert and Karahalios (Reference Gilbert and Karahalios2009), we operationalize this concept in 17 different ways, each capturing a different dimension of strength. We show that regardless of why the ties formed and whatever primary purpose they serve in a person’s life, the constituent elements of the ties and their strength are equivalent across data environments. In addition, we show that the distribution of these characteristics across an artificial network is comparable.
Second, we explore the relationship between the strength of ties and five outcomes collected using hypothetical vignettes: generosity toward ties, willingness to share information about violent or nonviolent protests with a tie, and motivation to join a violent or a nonviolent protest when invited by a randomly selected tie. We find that the relationship between tie strength and each outcome is statistically indistinguishable between the online and offline cases. If stronger ties are more likely to induce an outcome in the offline domain, then they are also more likely to do so in the online domain, and vice versa. Furthermore, the magnitude of these effects is comparable.
Finally, we show that the error structure in the observed relationships between tie strength and the outcomes is indistinguishable across the two domains: deviations from the relationship between tie strength and outcomes look similar for online and offline tie data. We assess the error structure via k-fold cross validation, in which we compare the root mean squared error (RMSE), mean absolute error (MAE), and Bayesian information criterion (BIC) produced by identical models using the online and offline data.
These three tests constitute different quantitative characteristics of interest to the empirical researcher attempting to test social network theories using online data. We believe that the parity we document across all three tests affirms the motivating external validity concern: it suggests that online social networks are comprised of ties that are similar in kind and function to those in the offline world. Of course, the consistently null results would be concerning if we suspected that our subjects were not sufficiently primed by our elicitation and selected five social ties at random, without regard for whether they were online or offline ties. We demonstrate that this is not the case by documenting strongly significant results for tie characteristics unrelated to our tests for parity. Subjects in the online condition systematically interact with their ties more frequently on online social networks, less frequently in the real world, and “miss” their elicited ties more.Footnote 4 These results not only confirm the internal validity of our experiment but also suggest that the identity of ties differs in the online and offline contexts—peoples’ sets of online and offline ties may not perfectly overlap. Importantly, despite constituting different individuals, the relationships essential to testing network theories persist.
MEASURING ONLINE AND OFFLINE TIES
We administered a survey on MTurk designed to directly compare online and offline relationships. Our network elicitation is novel in two ways. First, respondents were randomized into being asked about either online or offline ties, which avoids problems of priming and ensures comparability. Second, the names provided by subjects at the beginning of the survey dynamically appeared in subsequent questions so that the respondents could rank or characterize with respect to their particular set of friends and acquaintances.
In total, we collected 17 measures of the nature of the relationship that we refer to as dimensions of tie strength, and five different outcome scenarios that we use to investigate the function of ties. This approach yielded a large sample of comparable data about online and offline social ties. Furthermore, the random assignment to either the online (“treatment”) or offline (“control”) elicitation provides us with a counterfactual for the nature of the ties as well as their relationship with behavioral outcomes of interest.
Data
Survey Environment
Our survey was posted on MTurk’s job board on March 14, 2015. We aligned our compensation with the typical hourly rate associated with MTurk jobs, achieving an effective hourly rate of $5.47. The average time to complete our survey was 16 minutes and 29 seconds. Only 4% of the responses were rejected due to the subject failing one of the two attention diagnostic questions. In addition, 8% of the respondents completed the survey in less than half the projected time (15 minutes). We omit these responses in the main analysis, although their inclusion does not affect our results.
Despite broad adoption of MTurk and other online survey platforms across the social sciences, it is important to acknowledge that the population from which we sample does not reflect the human population writ large nor the U.S. population more specifically. In addition to being more computer literate, individuals using the MTurk platform are younger, are less religious, are less racially diverse, earn lower incomes, and are less likely to be married or own a home than the general population (Berinsky et al. Reference Berinsky, Huber and Lenz2012). They are also less extroverted than traditional samples drawn from undergraduate populations (Goodman et al. Reference Goodman, Cryder and Cheema2013) and nationally representative probability samples (Clifford et al. Reference Clifford, Jewell and Waggoner2015), and are more politically liberal and interested in politics (Berinsky et al. Reference Berinsky, Huber and Lenz2012).Footnote 5
However, despite these differences, there are reasons to be optimistic about the generalizability of our findings from an MTurk sample. Insofar as members of the MTurk population share more in common with the computer-literate populations that constitute the core of online social networks, MTurk samples will be informative for our research question. Furthermore, MTurk respondents are similar to respondents from a large, nationally stratified sample in the sectors in which they are employed and their urban versus rural geographic distribution (Huff and Tingley Reference Huff and Tingley2015), and their distribution throughout the United States is roughly representative (Berinsky et al. Reference Berinsky, Huber and Lenz2012). These characteristics suggest that MTurk respondents are likely exposed to offline social networks that are similar to those of their counterparts in more traditional samples.
Moreover, although MTurk respondents may have different personality and sociodemographic characteristics than respondents in traditional samples, several studies confirm that respondents nevertheless respond or behave similarly. Clifford et al. (Reference Clifford, Jewell and Waggoner2015) show that despite differences in the composition of personalities, the way personality maps onto ideology and partisanship is similar for MTurk and other samples. Crump et al. (Reference Crump, McDonnell and Gureckis2013) replicated typical results from the attention, performance, and learning literatures in psychology using MTurk. Amir et al. (Reference Amir, Rand and Gal2012) compared identical tests of classical game-theoretic games in a lab, on MTurk, and via a generic Internet survey. They found that MTurk yielded similar results to laboratory settings in dictator, ultimatum, trust, and public goods games. Similar diagnostics run by Horton et al. (Reference Horton, Rand and Zeckhauser2011) testing other-regarding preferences, priming, and framing effects were not significantly different from the benchmark laboratory results.
That framing effects experiments replicate well with MTurk samples is particularly reassuring for our design. Respondents react to differences in framing in ways similar to those in more traditional samples (Berinsky et al. Reference Berinsky, Huber and Lenz2012; Weinberg et al. Reference Weinberg, Freese and McElhattan2015). Indeed, respondents on MTurk pay substantially closer attention to the exact wording of questions and read prompts thoroughly, making them a particularly favorable subject pool for testing the effect of a subtle treatment (Paolacci et al. Reference Paolacci, Chandler and Ipeirotis2010; Weinberg et al. Reference Weinberg, Freese and McElhattan2015).
Elicitation Framework
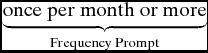
The survey began with the elicitation of five names (first names only) from respondents that were then piped into ensuing questions to ensure realism. We randomly primed subjects to provide names from either their online or offline social networks. In the following, we present a sample question for illustration. The bold terms indicate the randomly assigned prime, whereas the underlined terms were varied to guarantee a range of social tie types. Each subject responded to all five elicitation questions with the same treatment (i.e., no subject was asked to provide a strong tie from her offline network and a weak tie from her online social network). Although varying treatment and control within subjects would allow us to control for individual fixed effects, we were concerned with priming subjects. The random assignment to elicitation ensures that differences we document reflect the data environments we are interested in exploring and not psychological associations primed by our treatment.
“Please provide the name (first name only) of a contact with whom you interact
 $\underbrace{\text{once per month or more}}_{\text{Frequency Prompt}}$
{offline} / {online}. This person should be
 $\underbrace{\text{an acquaintance and not a friend}}_{\text{Tie Type}}$
.”
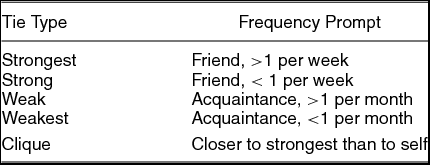
The fifth elicitation question asked for the first name of a social tie who the respondent knows but is closer with the respondent’s most frequently interacted with friend than the respondent.Footnote 6 Table 1 summarizes these elicitation questions and the types that we ascribe to each tie.
Elicitation Questions Asked of Each Respondent

Note: Treated respondents were asked to name online ties of these types, and control respondents were asked to name offline ties of these types.
We elicited the social ties in this manner to ensure variation in our measures of tie strength and to give subsequent questions a concrete reference point. As a first-order concern, we confirm that our measures are picking up signal and not noise by finding strong overlap between the various measures of tie strength that we subsequently collect and the elicitation ranking, discussed in our Supplementary Material.
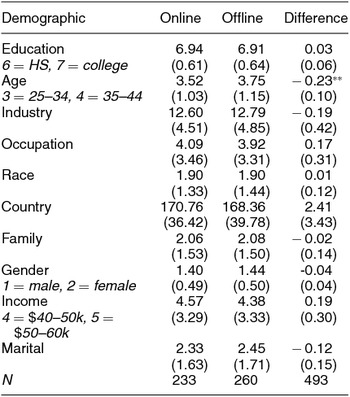
The remainder of the survey was identical, allowing us to attribute differences in outcomes to differences in online versus offline network characteristics. Given the survey design, we expect strong covariate balance between the elicitation groups, confirmed in Table 2. The subject’s age is the only covariate that differs systematically by elicitation, in line with our allowance for Type 1 error. The following analysis includes these measures as controls to improve the accuracy of the estimates.
Covariate Balance Between Online and Offline Elicitations

Note: The final column displays the t-test statistic for the difference in means.
*p < .10; **p < .05; ***p < .01.
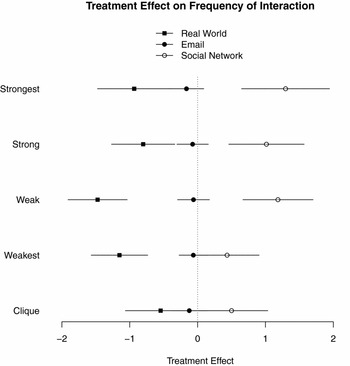
To ensure that subjects understood our elicitation conditions, we asked them to indicate how frequently they interact with their ties on their most commonly used social networking sites, email platforms, and other online communities, as well in the real world. We collected these measures at the end of our experiment to avoid priming. Reassuringly, we find significantly more interaction on social networking sites and significantly less real-world interaction in the online elicitation condition. Interestingly, we find null results for the frequency of email interaction, as illustrated in Figure 1.
Difference in Self-Reported Interaction Frequency Between Online and Offline Elicitation Prompts

These results suggest two things. First, subjects understood and reacted to our treatment. This initial diagnostic is essential for our interpretation of a null treatment effect in the following. Second, the results suggest that a subject’s online ties consist of different individuals than her offline ties. This conclusion is supported by the significant differences we measure in terms of the frequency of interaction via (1) online social platforms such as Facebook, Twitter, and Instagram and (2) offline spaces such as home, school, and the office. The parity that we report in the following between online and offline ties is present despite the specific identities of ties differing. We infer from this finding that there is something essential about the way humans socialize that persists across different environments and peers.
In the remainder of the article, we refer to the elicitation rankings in Table 1 as the elicitation dimension. In the Supplementary Material, we present more detailed evidence of the internal validity of our online and offline distinction, and verify that our respondents report high levels of interaction with online ties on Twitter and Facebook, platforms of interest to researchers using online social networks data. The full survey is also available in the Supplementary Material.
Outcome Measures
We measure outcome behaviors by posing hypothetical questions to our subjects about resource allocation and protest behavior. These vignettes capture behaviors of broad interest in the social sciences related to collective action, such as generosity and coordination. We elicit measures of generosity in resource allocation using a simple Dictator Game in which respondents are asked to divide $100 between themselves and their five social ties. We argue that our results are not undermined by our hypothetical framework and defend this claim in the Supplementary Material.
In addition, we assess the influence of social networks on the subject’s willingness to participate in both peaceful and violent protests when invited by a social tie, as well as which social ties, if any, the respondent would invite to a protest should she choose to attend. Each respondent was asked hypothetical questions with one of her social ties randomly included in the question. Although these outcomes are limited in that they are hypothetical rather than observed behavior, the random assignment of ties in the question allows us to make causal claims about this hypothetical behavior that would not be possible with other nonexperimental designs. A detailed analysis of the protest vignette is presented in the Supplementary Material.
Tie Strength Measures
We measure the nature of online and offline ties by examining the components of tie strength. We record several measures of tie strength to test (1) whether these measures differ systematically between the online and offline contexts, and (2) which dimensions have the strongest predictive power for our outcomes of interest. Unlike many analyses of networks that must rely on coarse proxies such as co-attendance at events or schools, co-sponsorship of bills, or geographic proximity, our survey platform allows us to disaggregate network ties by theoretically motivated dimensions of interest.
Specifically, we gathered data on six different measures of homophily, four measures of intimacy, four measures of reciprocity, and three measures specifically targeting professional relationships. Each dimension was prompted by asking the respondent to either rank her elicited ties or to select which elicited tie was the strongest in a certain dimension, as illustrated in the example questions that follow. A glossary of these 17 measures is included in the Supplementary Material.
We elicit measures of homophily along four different dimensions (education, religion, politics, and class) by asking respondents to identify which of their elicited ties they feel most similar to in terms of the specific dimension. For politics and religion, we also asked respondents to identify which of their elicited ties they would like to play a game with to maximize a cash prize. These hypothetical games require the tie to correctly answer questions regarding the respondent’s views on certain issues related to the dimension of interest.Footnote 7 For example, to measure homophily with respect to education, the survey asked:
“Which of your ties do you feel most similar to in terms of education?”
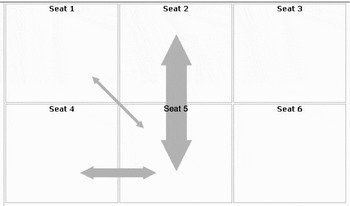
In addition, we ask for more general assessments of homophily via a novel survey question that asks respondents to arrange themselves and their ties around a hypothetical dinner table to maximize interaction between individuals who share the most and the least in common. We instruct the respondents that facing seats have the most interaction, adjacent seats are next most likely to interact, and diagonals represent the weakest opportunities for interaction. The corners of the six-person table have no opportunity for interaction. We use the respondents’ placement to identify the tie with whom they share the most and least in common. In addition, this question yields a rich characterization of network structure that we use as a proxy for the network among our subjects’ ties. Figure 2 reproduces the diagram presented to respondents.
Visual Accompanying Instructions Presented to the Respondent on How to Assign Their Social Ties to Seats

We further refine the nature of these relationships by asking each respondent to separate her ties into groups of those with whom she would and would not share personal successes and crises (see the following example). We call this sharing of information intimacy, although it clearly also corresponds to notions of trust:
“Think about your contacts in the context of a personal crisis (i.e., death of a loved one). Please categorize your contacts by who you would notify in order of priority and who you would not ever discuss your crisis with.”
In addition, we characterize desired interaction by asking subjects to rank their ties by how much they would like to interact with each tie in an ideal world, which we interpret as a proxy for how much each tie is “missed.”
We define reciprocity via four questions, two of which involve a hypothetical scenario in which the respondent requires financial assistance for an entrepreneurial endeavor. We ask the respondent which of her elicited ties would most likely contribute and which of her ties would most effectively garner other sources of support via their social leadership. For example, to measure contributions, the survey asked:
“Imagine you are starting a project and are in need of funding. Please rank your social ties in order of who would be most interested in contributing.”
To capture a different dimension of reciprocity, we ask the respondent to imagine that one of her ties is playing the Dictator Game described earlier. We ask the respondent to identify which of her ties, if any, would maximize the respondent’s personal gain (i.e., by sharing the money). We then ask the respondent to identify which of her ties, if any, would maximize the group gain of all five elicited ties. An example question is given next.
“Imagine one of your contacts is the recipient of $100 and is asked how (s)he would divide the money. Please rank your contacts in order of who would maximize the amount of money you receive.”
We are interested in the more structured relationships of a professional setting. In addition to two professional intimacy questions that mirror the personal success and crisis questions described previously, we also measure the strength of information flow by asking the subject to rank her elicited ties by whom she would reach out to when searching for a job (reproduced in the following example).
“Imagine you are looking for a job. Please rank your social ties in order of who you would ask for leads.”
Finally, we ask subjects to rank their ties in order of “strength” to identify which of the disaggregated dimensions dominate within this subjective measure. We compare these self-reported measures with the elicitation ranking described in Table 1, finding strong correspondence between our elicitation and these measures.
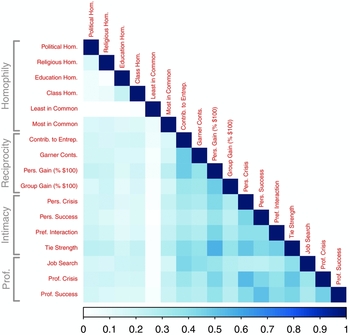
A concern with our survey is that subjects interpret the different questions on the same reductive dimension, thereby robbing us of the ability to disaggregate tie strength into its component pieces. Figure 3 presents raw correlations between our different measures of tie strength, reassuring us that our data capture unique dimensions of tie strength. The strongest correlations (roughly 0.7) are between self-reported tie strength and the personal gain metric, indicating which tie would maximize the respondent’s share were the tie to play the Dictator Game. In other words, the person whom the respondent thinks of as her closest tie is most likely to be the person who would offer her the largest share of $100 in the Dictator Game.
Correlation Between Different Dimensions of Tie Strength

Other dimensions exhibit much weaker correlations, yielding broad variation in the dimensions we capture. The dimension least correlated with all others is intuitive: the tie with whom the subject shares the least in common.
Overview of Methods
Our most straightforward method for testing the difference between the online and offline contexts is to compare the conditional expectations across treatment and control via ordinary least squares (OLS). We control for subject covariates both linearly as well as by using coarsened exact matching (CEM) to balance the online and offline observations on observable dimensions. As expected given the random assignment of elicitation, we are able to match treated and control observations with minimal pruning, losing only 9% of observations in our effective sample. In addition, we separately estimate propensity to treatment assignment via Bayesian additive regression trees and implement inverse propensity weighting (IPW). Finally, we use seemingly unrelated regressions (SUR) to account for correlated errors across models. We discuss these approaches in greater detail in the Supplementary Material.
This range of specifications may seem unusual given that random assignment allows us to interpret differences between the online and offline conditions as unbiased and consistent causal estimands. However, since null results are of substantive interest, we use more sophisticated methods to improve the efficiency of our estimates. In this way, we ensure that any null results are the products of point estimates close to zero and not of noisy measures produced by our finite sample. This added rigor makes our tests conservative, which is necessary to interpret our null results as evidence of comparability between online and offline social networks.
In the following analyses, we begin by analyzing the network measures themselves, looking for systematic differences between online and offline contexts. We then look at empirical relationships between these predictors of tie strength and social behaviors such as generosity to see if online and offline ties function differently for these outcomes. Finally, we compare predictive accuracy for identical models using identical measures estimated in the online and offline conditions.
The progression of our analysis mirrors that of empirical research: are the measures of interest comparable, reflecting parity in the data? If so, are the estimates comparable, suggesting parity in the relationships? If so, is model fit comparable, suggesting parity in the methods? Our results provide strong confirmation in all three cases.
ANALYSIS
We explore differences between online and offline ties by comparing (1) the dimensions of ties and their strength in both domains, (2) the relationship between tie strength and the subject’s behavior in both domains, and (3) the accuracy of models trained using online data in predicting offline outcomes. We look for ways in which social network data comprised of online ties differs from similar data comprised of offline ties. We find strong evidence in favor of parity in all three approaches.
Data Parity
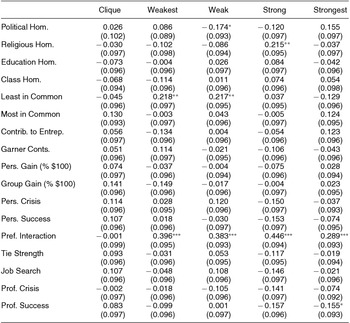
The simplest test of online/offline parity examines whether the raw measures of tie strength differ. Since elicitation assignment was random, we treat the offline elicitation as a valid counterfactual. Table 3 presents a series of regressions of each dimension of tie strength on the online elicitation dummy. Each row corresponds to a single regression with the row labels identifying the outcome measure of tie strength. Columns (1) through (5) present bivariate estimates of the form indicated in Equation (1), run separately for each elicited type. Substantively, we are interested in exploring whether the nature of the social tie (indicated by M) differs systematically by treatment (indicated by D) across subjects i and elicited tie type t.
 $$\begin{equation}
M_{i,t} = \alpha _t + \beta _t D_{i} + \epsilon _{i,t}
\end{equation}$$
Online/Offline Differences in Measures of Tie Strength

Notes: Heteroskedastic-robust standard errors are presented in parentheses. Each row represents the coefficient produced by regressing the row variable on the online elicitation dummy. Each column represents an elicitation type. *p < .10; **p < .05; ***p < .01.
Interpreting these estimates naively would suggest that online and offline social ties differ across a subset of dimensions. Most notable in terms of both size and significance is the preferred level of interaction which finds that subjects would like to interact more with their online ties than their offline. This result holds for all elicited tie types except the clique and suggests that subjects “miss” their online ties more than their offline ties.
However, caution must be exercised for two reasons. First, Table 3 presents only bivariate specifications. Although random assignment ensures that these estimates are unbiased, we can improve the efficiency of our estimates by controlling for subject-level covariates, either via multiple regression analysis, matching, or propensity score weighting. Furthermore, the errors in these models are likely to be correlated across outcomes, particularly when looking within a specific elicitation type. We reestimate the treatment effect using SUR analysis to account for this source of correlated errors.
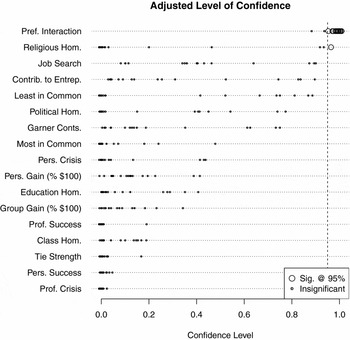
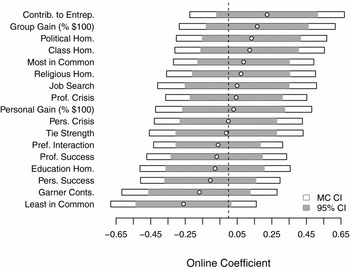
Second, with 90 separate outcomes, our Type I error increases dramatically. We should expect roughly nine significant results when examining 90 separate models at the 90% level of confidence. In Table 3, we see 10 estimates that exceed this threshold. As such, we cannot be sure our significant results are truly grounds for rejecting the null or are merely within the expected range of Type I error. We adopt a free step-down resampling procedure (Westfall and Young Reference Westfall and Young1993) to adjust our p-values to compensate for this issue of multiple comparisons.Footnote 8 Figure 4 plots the adjusted confidence levels for each tie and each model run on each outcome measure. As illustrated, the only measure that differs systematically between online and offline treatment conditions is the preferred level of interaction, which is significantly positive regardless of specification and elicited tie. Again, subjects “miss” their online ties more than their offline ones.
Adjusted p-Values Estimated via Free Step-Down Resampling for Each Dimension of Tie Strength Across Four Models (Controls, CEM, IPW, and SEM) and Four Elicited Ties (Weakest, Weak, Strong, and Strongest)

Compression Effects
Next we consider whether compression effects are masking differences. Given the relatively restricted range of interactions available on the Internet—for instance “liking,” “tagging,” and messaging—the difference between the weakest and strongest ties may be compressed relative to the offline world, in which activities such as sports, dinner, shopping, and drinking may allow for a broader range of tie strength. To test this concern, we calculate the difference in each measure between the strongest and weakest ties and then regress these differences on the elicitation.
As illustrated in Figure 5, there is no evidence of compression. Across all network measures, the difference between the strongest and weakest online ties never differs from the offline ties at conventional levels of significance, let alone the wider intervals adjusted to correct for multiple comparisons. The comparability of online and offline ties with respect to their constituent dimensions is robust.
Difference in Average Measures (y-axis) Between Strongest and Weakest Elicited Tie, Compared between Online and Offline Elicitation Frameworks

Structure Comparisons
A final lens through which to evaluate the parity of our data is via a comparison of the network structures themselves. We note at the outset that our survey design samples social ties and not richer structural features of the subject’s social network. However, through the seating chart question, which reveals information about the connections among a respondent’s ties, we can learn something about structure in online and offline contexts.
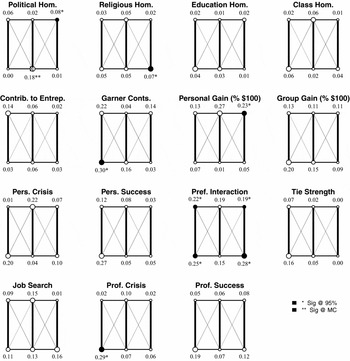
In Figure 6, we start by examining whether the elicited tie types themselves vary systematically in their seat assignment between the online and offline contexts (recall that respondents were instructed that placing ties in certain seats indicates certain relationships among ties). The left and middle columns present the percentage of cases in which each elicited tie type was assigned to each seat in the online and offline treatment conditions, respectively, with node size and label reflecting the frequency of placement. The right column presents the p-values associated with a difference in means t-test, which are both labeled and shaded according to their significance at conventional (*) and MC-adjusted (**) thresholds. Node size in the right column reflects the absolute difference between the online and offline measures.
Seat Assignment by Elicited Tie Both Online and Offline

As illustrated, the placement of different elicited ties depends on the strength of the tie with most subjects placing themselves in one of the two center seats (63% and 70% of cases in the online and offline conditions, respectively). Meanwhile, the weakest and clique ties are systematically placed in the corner seats. In the right-hand column, we do notice some evidence of significant differences between the online and offline conditions, although these are not significant after adjusting for multiple comparisons. Furthermore, these differences appear to be substantively meaningless, as they capture only random differences in the choice of seat. For example, both right-hand corner seats differ for the clique tie, yet upon closer inspection it appears that subjects simply flipped the choice of the top or bottom corner seat. As such, we conclude that these differences are both statistically and substantively null.
However, we are interested in more than simply the elicited identities of the ties in the seats. In Figure 7, we present difference tests by node position for all tie strength measures, ignoring the identity of the elicited tie. Ergo, each node’s online and offline values are calculated as the average measure values, dropping observations in which the subject placed herself in the seat. These means are then compared using a t-test as earlier, with significance indicated at conventional (*) and adjusted (**) thresholds. Again, we find almost zero evidence of significant differences between online and offline conditions across all measures of tie strength. To the extent that seating captures the way the ties are tied to one another, this offers limited support for a stronger claim that the interconnections among an ego’s ties—and hence the egocentric network structures—are similar for online and offline ties.
Difference Tests by Node Position for All Tie Strength Measures

Relationship Parity
The preceding section demonstrated that the nature of ties, measured by the dimensions of tie strength, are indistinguishable in the online and offline worlds. However, online tie data would still be unsuitable for testing offline theories if the ties functioned differently—that is, if the relationship between tie strength and outcomes manifests differently for online and offline ties.
We test this possibility with the five outcome measures we collected and report results for generosity here.Footnote
9
Generosity is measured via a hypothetical Dictator Game in which subjects were asked to divide $100 between themselves and their social ties. We regress different dimensions of tie strength on respondent generosity—the amount the subject would give to each tie—using the CEM method to improve consistency, and save the estimated coefficients (
 $\hat{\beta }$
) for both the online and offline tie data. These
 $\hat{\beta }$
estimates were compared using a difference-in-means t-test (
 $\frac{\hat{\beta }_{on}-\hat{\beta }_{off}}{\sqrt{se_{on}^2+se_{off}^2}}$
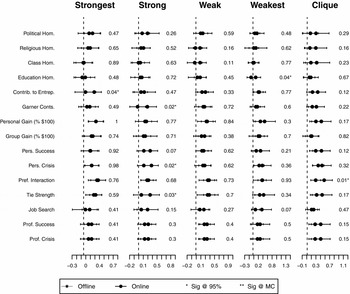
). The associated p-values are presented in Figure 8. Again, we find no systematic evidence of a difference between the online and offline tie data, regardless of which measure of tie strength is used as the explanatory variable. As before, there are a few differences in β’s that are marginally significant, but these are within the occasional Type I error that is expected 5% of the time. Multiple comparison-adjusted confidence intervals include zero across all measures.
Online and Offline Coefficient Comparison

Furthermore, the ordering of these insignificant differences is, itself, seemingly random. As illustrated in Figure 8, the light and dark circles, indicating β’s estimated in the offline and online frameworks, respectively, flip rank across dimensions of tie strength and within elicitation type. The only exception is the clique type for which the online estimates are systematically larger than the offline for all dimensions except the job search measure. We believe that the clique elicitation yields much weaker ties in the online framework than the offline framework, affording the component dimensions of tie strength to have stronger predictive power, a point we elaborate on in the Supplementary Material. Nevertheless, none of these differences are significant after the multiple comparison correction.
However, this is not to suggest that our measures of tie strength are not predictive of generosity. As illustrated in Figure 8, certain dimensions of tie strength strongly correlate with the portion of $100 the subject is willing to share. In particular, reciprocity is consistently significant and positive across all types of elicited ties, with subjects indicating greater willingness to share the money with a tie whom they perceive as likely to do the same for both online and offline ties. Other dimensions are less consistent across different elicitation types, although we also highlight the positive coefficients on several dimensions for the clique. We include a more rigorous multiple regression analysis of the determinants of subject generosity in our Supplementary Material.
In short, although certain dimensions of tie strength are better predictors of generous behavior toward ties than others, these dimensions do not vary across the online and offline contexts. Predictors of behavior in one are the predictors of behavior in the other.
Model Parity
The analyses conducted previously failed to uncover systematic differences between online and offline ties in terms of both measures of tie strength and relationships to hypothetical behavior. However, researchers analyzing social relationships using online tie data may also be interested in the parity of empirical models themselves, particularly for applied researchers using online tie data to make predictions about real-world outcomes. Even if the measures are comparable and the relationships persist, predictive accuracy may differ depending on the source of the social network data.
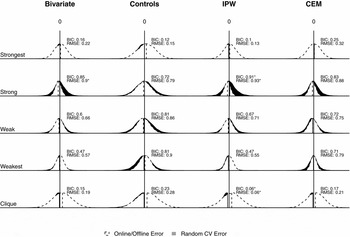
We use cross validation to examine whether the predictive accuracy of models estimated using online tie data is sufficient to predict outcomes for offline ties. We model generosity (using the donation game) using only the online tie data and then examine its accuracy in predicting generosity for the offline tie data. We compare the mean errors and the variance to an identical test in which we randomly divide the data in half. We repeat the cross-validation technique 1,000 times, saving the errors as a distribution against which we compare the RMSE, MAE, and BIC of the online/offline test.
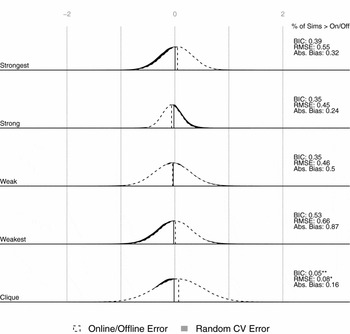
Informed by the preceding results on reciprocity, we regress the donation outcome on the personal gain measure of tie strength. Figure 9 compares the online/offline prediction errors (and the standard deviation) to 1,000 randomly sampled cross-validation results. The dashed black lines indicate the distribution of errors generated by the model trained on the online tie data, predicting generosity in the offline tie data. The gray distribution illustrates the identical procedure, except where we randomly divide the data in half. We are interested in (1) whether the mean error differs in the online/offline context and (2) whether the variance of the errors is dramatically smaller or larger. To formalize these comparisons, we record the RMSE, the BIC, and the absolute bias for each of the 1,000 simulations and then measure the percentage of simulations that were larger than the same statistics recorded in the online/offline comparison.
Bias and Variance in Out-of-Sample Predictions

A visual inspection of the results indicates that there is no systematic difference between the online/offline predictive accuracy relative to a random cross validation. Interestingly, the result does not hold for the clique ties, as indicated by the significantly fewer shares of simulations that were larger than the online/offline division in terms of both BIC and RMSE.
We further examine the cross-validation results across models and ties, focusing on BIC and RMSE to compare the performance of random simulations against the online/offline division. To guard against the possibility of spurious null results stemming from the particular relationship of interest, we analyze the RMSE from a regression of generosity on political homophily instead of personal gain. As illustrated in Figure 10, the results are either consistently equivalent or even in favor of the online/offline division (particularly for predicting strong tie relationships). Note, however, the systematic differences with regard to the clique tie, which again exhibits worse predictive accuracy when dividing by the online/offline cleavage. We suspect that this reflects a substantive difference in how subjects view “friends-of-friends” in online and offline contexts.
Prediction Error in Models Trained on Online Data v. a Random Split of the Data

Summary of Findings
The analyses presented previously indicate that there is no systematic difference in the measurement of social tie dimensions between ties gathered from a respondent’s online social network and those gathered from her real-world friends and acquaintances. In addition, there is no evidence that the limited forms of interaction in the online world truncate or compress the weakest and strongest ties, and a cursory examination of placement within an imposed structure finds insignificant differences. Furthermore, the evidence suggests that relationships between certain tie dimensions and outcomes of interest (specifically, how much the respondent would donate if she were given $100) do not vary systematically across online and offline networks either. Finally, the cross-validation analysis finds that the online tie data is no better nor any worse at training models to predict outcomes in the offline world than randomly sampling the combined data.
These results suggest that real-world relationships involving social ties can be analyzed using online data. The failure to uncover systematic differences between the online and offline contexts in terms of tie strength measurement, coefficient estimates, and model efficacy constitutes the first comprehensive test of the ability of online network data to be used to test theories that entail offline phenomena.
IMPLICATIONS FOR RESEARCHERS
Our findings suggest that online ties are not fundamentally different from offline ties in nature. Our results also suggest that online ties are not fundamentally different from offline ties in function in the domains of resource allocation and protest behavior. Since network theories connect ties to outcomes based on their nature, these findings support the use of online tie data to test theories of offline networks. Theories of the importance of structural features also relate these arrangements of ties to outcomes via the ties’ nature and function, and thus these findings are good news for testing network structural theories as well (and our limited tests of structural differences corroborate this inference). Researchers aiming to test network theories need not rule out online tie data on the grounds that the ties are too dissimilar from the offline ties of interest.
It is important to point out what these results do not imply: it is not the case that a person’s online social network is identical to her offline social network. Exactly who a person is socially tied to online may differ from the people she is tied to offline, and we present evidence that the overlap is indeed imperfect. It is also not necessarily the case that the structure of online social networks is identical to the structure of offline social networks. Online networks may be different in structure from offline networks in myriad ways.Footnote 10
Crucially for tests of network theories, it need not be the case that online networks are identical to offline ones, in the identity of nodes or in structure, for online social tie data to inform theories of offline networks. Although we may not know (or believe) that, say, the number of weak ties in offline networks is the same as in online ones, our article gives reason to believe that what constitutes a weak tie, and why the weak ties that are present matter, is similar in the online and offline domains. That ties are similar in nature in both realms supports testing theories about the existence of certain ties. This conclusion also offers limited support for testing theories of network structure. We do not know that the same structural features are present in both online and offline networks; however, if a structural feature in offline networks matters because of the nature of the ties that comprise it, then that structural feature comprised of the same types of ties should matter in the online realm as well.
The 17 measured dimensions of ties offer a comprehensive look at the nature of online and offline ties. Our measures of outcomes admittedly capture only a small subset of the potential functions of ties. Although generosity and protest participation represent important behavior relevant to collective action, there are certainly many other outcomes of interest. We encourage future work to dig deeper into the exact realms in which online and offline networks have similar consequences for outcomes. This future work is important not only to deepen our understanding of the relationship between networks and outcomes but also to better identify the mechanisms by which ties affect outcomes in either domain.
These results encourage theory testing with a relative easy-to-collect source of network data. However, although observable ties make online social media data simpler to collect, access restricted by some platforms can present other challenges that are not faced in the collection of offline data. It can be difficult to access any sets of nodes and ties, the nodes and ties that are accessible may be an incomplete set, and conditional access may make replication difficult. We consider access issues specific to certain platforms in the Supplementary Material. Access and replicability are important issues moving forward; however, the results in this article suggest that when access is granted, the online tie data will be informative for offline network theories. Furthermore, when accessible network data are incomplete, the shared nature of the ties means that the sampling issues will be the same as those pertaining to incomplete offline data.
CONCLUSION
Across the social sciences, theories of collective action increasingly acknowledge that actors are interconnected, and these connections shape behavior. Testing these theories requires rich social network data, which is expensive, error prone, and difficult to collect in an offline context. Online social media offer network data that are fundamentally different: social ties between users are observable. Although this feature does not resolve all difficulties, it does allow researchers to forego lengthy surveys that ask respondents to recall their social ties.
However, to take full advantage of these data, researchers must be sure that the fundamental difference in data type does not impart other differences that affect the external validity of inferences drawn from them. Are ties in the online realm informative of the ties connecting a person to her peers offline? For this data source to be useful for theory testing, the ties must be similar in kind and function to the ties that are the subject of theory. The similarity between online and offline ties is an empirical question that had not been considered previously in a broad and systematic way.
We implemented a survey experiment on MTurk in which subjects were asked to name social ties, but subjects were randomly prompted to name only either online or offline ties. This approach maximizes the chances of finding differences. If instead we had asked each respondent to name both offline and online ties, we would have risked priming the respondent to pick as online friends her offline friends listed first or vice versa; if we had asked about offline ties through a social media platform, we would have risked priming the respondent to think of her contacts on that platform.
Our survey collected information on 17 dimensions of tie strength and on the ties’ influence on outcomes pertaining to resource distribution and protest behavior. We considered differences between online and offline ties in three areas: whether the dimensions underlying the tie and the components of its strength differ, whether the tie’s ability to influence outcomes and the dimensions of the tie that best do so differ, and whether the error structure of models fit to online data differ from the error structure of models fit to offline data.
Our findings strongly support the suitability of using data on online ties to test theories of offline social networks. The similarity we observe in all three areas is robust to alternate specifications of the relationships we document, and we validate respondent engagement with the online/offline prompt, reassuring us that our results are not the product of a weak or ignored treatment. Moreover, we provide evidence that the similarity cannot be fully attributed to shared identity; online ties are sufficiently similar to offline ties not because a person’s online and offline ties are the same people, but because the nature and the function of social ties manifests similarly in both domains. The essence of ties is comparable.
These findings are good news for theory testing with online tie data because theories relate networks to collective action on the grounds that ties do something. If ties are similar in kind and function in the online realm and the offline realm, then ties in the online realm can speak to the theory as well as ties in the offline realm can. Straightforwardly, this means that these data can be used to test theories about the existence of ties and their strength. This also means that these data can be used to test some theories about the structure of networks. Even if the structure of an online network is not identical to the structure of an offline network, the fact that ties correspond in kind and function means that the consequences of the structural features that are present should be related as well.
Of course, online data are not a magic bullet. Even if the researcher is able to secure access, there may still be good reasons to not use online data for any given question. The networks measured for any study must correspond to the theory underlying that particular study. Whether a network culled from online social media will meaningfully speak to the research question still requires careful thought, rich substantive knowledge, and a relevant outcome measure. Our claim is not that online data can be used to answer every question related to networks and collective action. However, online data should not be ruled out on the grounds that online ties are too different to speak to theories about networks in general.
In light of the wealth of theories relating the structure of social networks to outcomes related to collective action and the sudden abundance of high-resolution social network data available from online social media, it is our hope that our findings help pave the way for more theory testing in political science and beyond, and a rich interplay between theory and data moving forward.
SUPPLEMENTARY MATERIAL
To view supplementary material for this article, please visit https://doi.org/10.1017/S0003055417000120.
Replication files can be found at https://doi.org/10.7910/DVN/K1XN7Q.





Comments
No Comments have been published for this article.