I. INTRODUCTION
Recent years, a tremendous increase has been developed in the scientific and technological interest in photocatalysis to solve the world’s energy and environmental pollution problems.Reference Du, Furube, Hara, Katoh and Tachiya1,Reference Liu, Han and Liu2 To date, various photocatalysts have been widely studied for water splitting and pollutant degradation, such as TiO2, g-C3N4, ZnO, MoS2, and so on.Reference Li, Wang, Liu, Chen, Lei, Xu, Li, Ding, Zhang and Yang3–Reference Liu and Zhou6
CdS and ZnS (E g = 2.42 and 3.7 eV) have attracted considerable attention because their band gap width decreases with increasing temperature, luminescence properties, wide range of conductivity variation, and excellent photoelectric conversion properties. Normally, these two materials can be obtained easily by a simple chemical method with low price and low temperature, so they are always used to design and develop much higher efficient semiconductor composite photocatalysts.Reference Lee, Lee, Kim, Cho, Eo, Yun and Cho7 Especially, CdS (or ZnS)-based semiconductor composites with a core/shell structure played a significant role in the fields of microelectronics, optoelectronics, optical devices, and photocatalysis. Many core/shell CdS or ZnS-based composites have been reported in photocatalysis. For example, Chen et al.Reference Chen, Song, Zhang, Zhang, Zhang, Wang, Gao, Zhao, Zhang and Tao8 synthesized ZnO–CdS core/shell nanorods with a wide absorption range by an ion exchange approach, presenting an enhanced light-harvesting ability in both the UV and visible light range, which leads to improved photocatalytic performance as compared to bare ZnO. Reddy et al.Reference Reddy, Shim and Cho9 reported CdS/ZnS core/shell nanoparticles, which exhibited a higher photocatalytic degradation activity for methyl orange. Mumin et al.Reference Mumin, Moula and Charpentier10 first prepared CdS/ZnS core/shell quantum dots and then fabricated core–shell CdS–ZnS QDs linked with nano-TiO2, and its maximum photodegradation efficiency of methylene blue (MB) dye (88%) was obtained.
Nickel phosphide (Ni2P), one of the important metal phosphides, has been well known in the fields of hydrodesulfurization and hydrodenitrogenation, corrosion-resistant, oxidation-resistant, and wear-proof materials. Currently, it is also been famous as a new catalyst in the photocatalytic degradation.Reference Liu, Ma, Zhang and Han11 Ni2P has a special crystal structure, and its nanostructure always makes it exhibit some amazing properties. For example, Liu et al.,Reference Liu, Lin and Tong12 prepared Ni2P 3D flower-like Ni12P5 microstructures, which possess good photocatalytic activity. So it is an excellent candidate for the CdS (or ZnS)-based core/shell structure. However, for the severe preparation condition and high cost of metal phosphides, report focusing on the investigation of the combination of transition metal phosphides and ZnS or CdS to establish core/shell composites is still rare. Herein, it is necessary to explore the extended performances of Ni2P/ZnS and Ni2P/CdS core/shell composites.
In this paper, Ni2P/ZnS and Ni2P/CdS core/shell composites were successfully synthesized by a facile two-step method. And the characterized results show that both composites consist of Ni2P microsphere core and ZnS (CdS) nanostructure shell. Furthermore, using MB as a typical pollutant, it is found that both composites exhibit enhanced photocatalytic degradation activities under UV irradiation.
II. EXPERIMENTAL SECTION
All the chemical reagents were of analytical pure grade and used without further purification.
A. Synthesis of Ni2P microspheres
In a typical experiment, 1 mmol NiCl2·6H2O was dissolved in a 40 mL Teflon liner autoclave with mixed solvent of 10 mL ethylene glycol, 1 mL H2O, and 19 mL isopropyl alcohol under stirring. When the solution became green and uniform, the appropriate amount of white phosphorous (5 mmol) was added. Then the autoclave was sealed and maintained at 180 °C for 12 h.
After completion of the reaction, the autoclave was cooled down to room temperature naturally. The black precipitate was filtered and washed successively with absolute ethanol, benzene, and distilled water to remove the residual reactants, excess white phosphorous, and other by-products. After that, the as-obtained samples were dried in a vacuum at 60 °C for 12 h.
B. Preparation of Ni2P/CdS and Ni2P/ZnS composites
First, the as-prepared Ni2P microspheres (0.05 g) were ultrasonically dispersed into 30 mL deionized water. Then the appropriate amount of Zn(Ac)2·2H2O or Cd(NO3)2·4H2O was added into the formed solution under stirring. The resulting solution was transferred into a flask with reflux device. The flask was heated up to 80 °C and slowly dropped 20 mL CH3CSNH2 solution (0.025 mol/L) under vigorous stirring. After about 1 h, the flask was cooled to room temperature naturally. The resulting precipitate was centrifuged and washed with absolute ethanol and distilled water. Finally, the as-obtained samples were dried in a vacuum at 60 °C for 12 h and collected for further characterization.
C. Characterization
X-ray diffraction (XRD) patterns of the as-prepared products were recorded using a Rigaku Ultima IV X-ray diffractometer (Tokyo, Japan) with Cu Kα radiation. Field-emission scanning electron microscopy (FE-SEM) images were collected using a Hitachi S-4800 FE-SEM (Tokyo, Japan) equipped with an energy dispersive X-ray spectrometer (EDX) to characterize the morphologies of the products. Then, the crystal structure, surface morphology, and particle size of the as-prepared products were examined by transmission electron microscopy (TEM) on a FEI Tecnai G2 F20 (Hillsboro, Oregon) apparatus with an accelerating voltage of 200 kV. The dye degradation was also analyzed by the electrochemical impedance spectroscopy (EIS, ParSTAT MC, Princeton, New Jersey) and Fourier transform infrared spectroscopy (FT-IR, Shimadzu Affinity-1, Shimadzu, Kyoto, Japan).
D. Photocatalytic activity measurements
The photocatalytic degradation experiments of MB were measured at room temperature under irradiation of mercury lamp (500 W) at different times, maintaining the reaction mixture in suspension by using a magnetic stirrer. 50 mg of the photocatalysts (the as-prepared Ni2P, Ni2P/ZnS, and Ni2P/CdS composites) were, respectively, ultrasonically dispersed in 50 mL of solutions with amounts of 1.0 × 10⁻⁵ mol/L of MB aqueous solutions. The mixtures were irradiated by using a mercury lamp (500 W) for a certain time after that they had been stirred in the dark for 30 min to achieve the adsorption–desorption equilibrium. The optical property changes of dyes were recorded on a Hach DR5000 UV-vis absorption spectrophotometer (Loveland, Colorado) with wavelengths ranging from 200 to 800 nm.
III. RESULTS AND DISCUSSION
A. Structural and compositional analysis
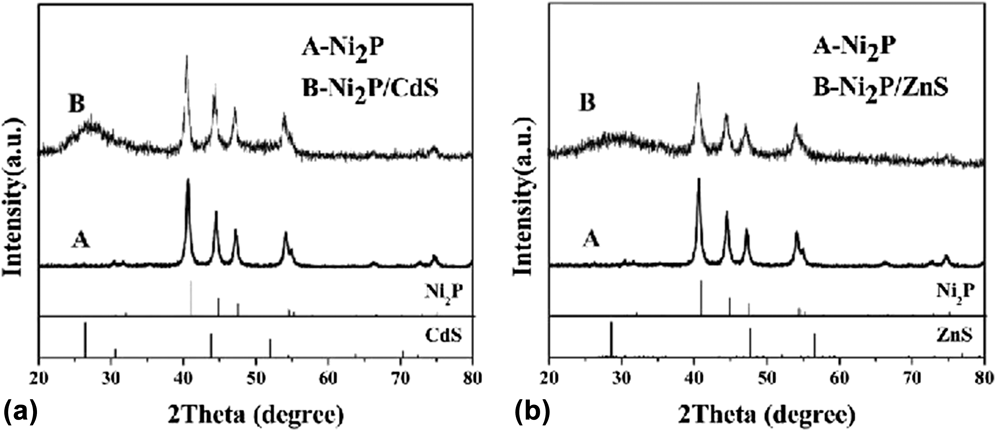
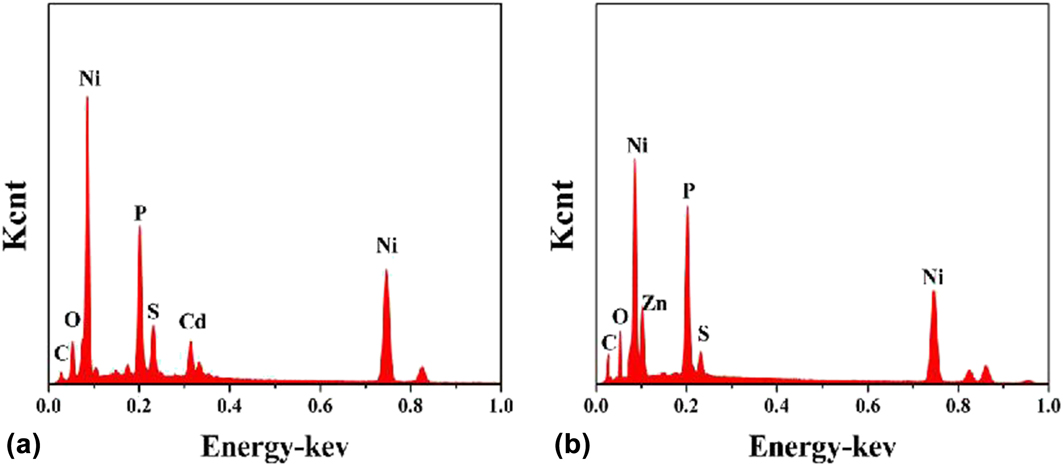
The crystallinity and phase of the as-obtained products were characterized by XRD, and the result is shown in Fig. 1. All the diffraction peaks of Ni2P can be readily indexed to the hexagonal structure Ni2P (JCPDS card No. 65-3544, a = 5.862 Å, c = 3.372 Å) with high crystallization. No characteristic diffraction peaks from other phases or impurities were detected, which reveals the high purity of the as-prepared Ni2P structures. While as shown in Figs. 1(a) and 1(b), besides the diffraction peaks of Ni2P, the XRD patterns of both Ni2P/CdS and Ni2P/ZnS composites also have other diffraction peaks, and it can preliminarily confirm that they belong to the diffraction peaks of CdS and ZnS. To further confirm the elemental constitution of the as-obtained products, the EDX measurements were carried out (Fig. 2). Figures 2(a) and 2(b) show the EDX pattern of Ni2P/CdS composites and Ni2P/ZnS composites, respectively. It can be seen that only the peaks for Ni, P, Cd, and S are appeared in Fig. 2(a) and only the peaks for Ni, P, Zn, and S are appeared in Fig. 2(b). It can be further proved by the results of the XRD pattern.
Typical XRD patterns of Ni2P microspheres and Ni2P/CdS composites (a); Typical XRD patterns of Ni2P microspheres and Ni2P/ZnS composites (b).

EDX spectrum of Ni2P/CdS composites (a) and Ni2P/ZnS composites (b).

B. Morphology analysis
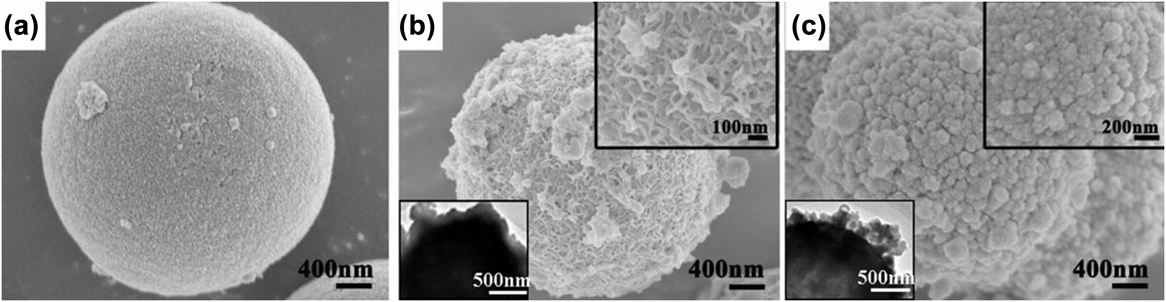
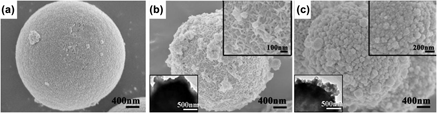
The morphology and size of the as-obtained Ni2P, Ni2P/CdS, and Ni2P/ZnS composites were investigated by FE-SEM (Fig. 3). Figure 3(a) suggests that Ni2P consists of a large quantity of monodisperse microspheres with a narrow size distribution and the average diameter maintains at about 1–2 µm. And Ni2P microspheres have a very smooth surface. The scanning electron microscopy (SEM) images of the as-obtained Ni2P/CdS and Ni2P/ZnS composites are shown in Figs. 3(b) and 3(c). The Ni2P/CdS and Ni2P/ZnS composites still show a spherical morphology, but the diameter of microspheres does not have a significant change in sizes. In addition, the rough surface of the composites indicates that CdS and ZnS have been coated on the surface of Ni2P microspheres as a shell. Further observation from the right upper SEM insets of Figs. 3(b) and 3(c) present that the CdS shell is composed of CdS nanorods which has an average diameter of about 20 nm and the ZnS shell is some nanoparticles with 60 nm diameter. The left lower TEM insets of Figs. 3(b) and 3(c) show the TEM images of Ni2P/CdS and Ni2P/ZnS, respectively. And the TEM investigations further prove their unique structures. As shown in the insets of Figs. 3(b) and 3(c), the as-prepared composites are composed of Ni2P hollow microspheres as the core and CdS (ZnS) nanostructures as the thin shell. And CdS (ZnS) nanostructures as the thin shells attach on the surface of Ni2P hollow microspheres, but CdS nanostructures on the surface of Ni2P hollow spheres are smaller and more uniform, which is consistent with the results of SEM, XRD, and EDX.
Typical FE-SEM images of Ni2P microspheres (a), Ni2P/CdS composite (b), and Ni2P/ZnS composites (c); The left lower and right upper insets of (b) and (c) are TEM images and magnified SEM images of Ni2P/CdS and Ni2P/ZnS composites.

C. Formation mechanisms of Ni2P/CdS and Ni2P/ZnS composites
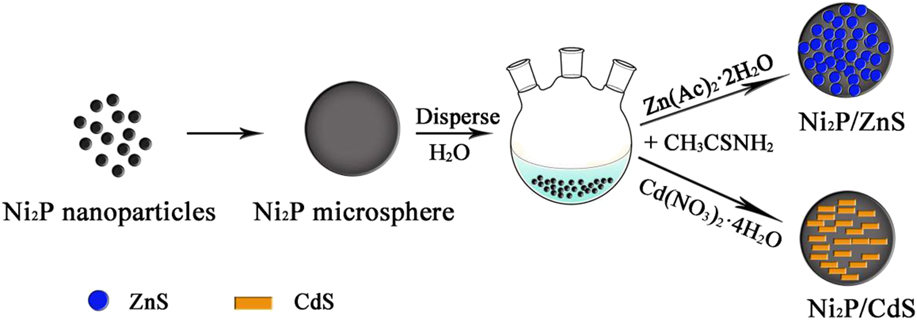
The formation mechanism of Ni2P microspheres is very clear. At first, elemental phosphorus (P4) reacts with water (H2O) to produce PH3 under hydrothermal treatment, and then PH3 combines with Ni2+ to form Ni2P nanoparticles and further assemble to Ni2P microspheres.Reference Zhao, Han, Huang, Dai, Tian, Zhu and Yue13,Reference Liu, Li and Lu14 During the next step, CdS and ZnS can be easily deposited by a simple chemical bath deposition method. In the water solvent, S2− can be extremely released by CH3CSNH2 at 80 °C. Since the presence of M2+ (Cd2+/Zn2+), S2− will soon react and form CdS and ZnS. Then, CdS and ZnS are further assembled on the surface of Ni2P microspheres.Reference Mezughi, Tizaoui and Alkhatib15 In this way, core/shell Ni2P/CdS and Ni2P/ZnS composites can be easily obtained (Fig. 4). The whole reaction equations can be listed as follows:
 $$2{{\rm{P}}_4} + 12{{\rm{H}}_2}{\rm{O}} \to 5{\rm{P}}{{\rm{H}}_3} + 3{{\rm{H}}_3}{\rm{P}}{{\rm{O}}_4}\quad ,$$
 $$4{{\rm{H}}_3}{\rm{P}}{{\rm{O}}_3} \to {\rm{P}}{{\rm{H}}_3} + 3{{\rm{H}}_3}{\rm{P}}{{\rm{O}}_4}\quad ,$$
 $$2{\rm{N}}{{\rm{i}}^{2 + }} + {\rm{P}}{{\rm{H}}_3} \to {\rm{N}}{{\rm{i}}_2}{\rm{P}} + 3{{\rm{H}}^ + }\quad ,$$
 $${\rm{C}}{{\rm{H}}_3}{\rm{CSN}}{{\rm{H}}_2} + {{\rm{H}}_2}{\rm{O}} \to {\rm{C}}{{\rm{H}}_3}{\rm{CON}}{{\rm{H}}_2} + {{\rm{H}}_2}{\rm{S}}\quad ,$$
 $${{\rm{H}}_2}{\rm{S}} \to {{\rm{S}}^{2 - }} + 2{{\rm{H}}^ + }\quad ,$$
 $${{\rm{M}}^{2 + }} + {{\rm{S}}^{2 - }} \to {\rm{MS}}\quad .$$
Schematic illustration of the formation process of Ni2P/CdS and Ni2P/ZnS composites.

D. Photocatalytic activity of Ni2P/ZnS and Ni2P/CdS
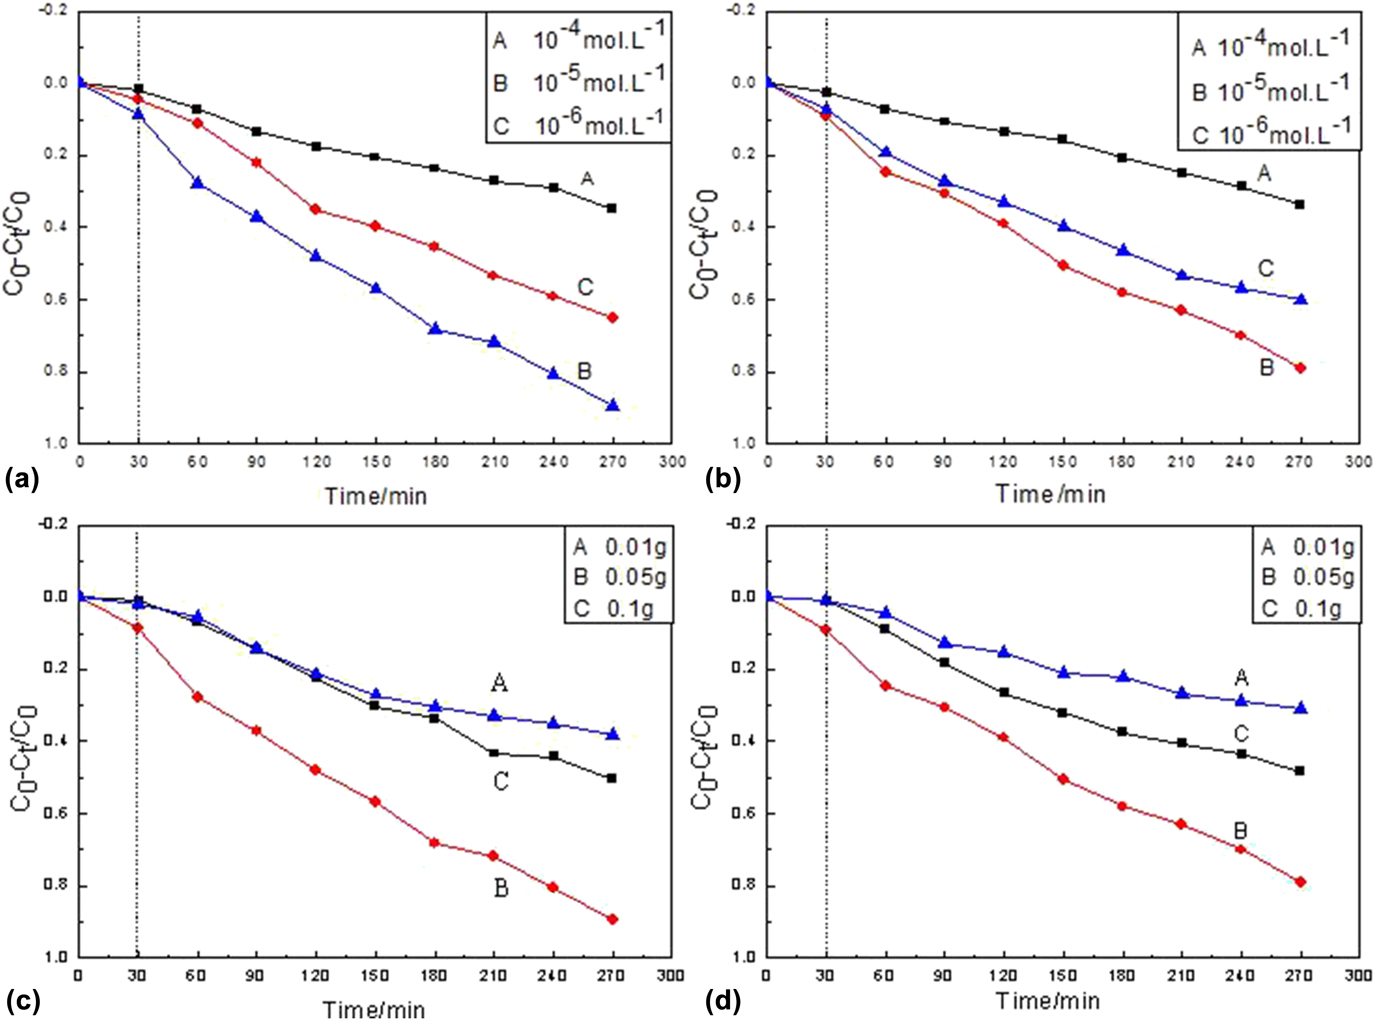
To obtain the photocatalytic efficiency of the catalysts (as-prepared composites), it is necessary to investigate their approximated dye concentrations and catalyst amount. Then a series of photodegradation experiments of the as-prepared composites (Ni2P/CdS and Ni2P/ZnS) are measured using MB as the target model under a mercury lamp (500 W) irradiation at room temperature (Fig. 5).
Photocatalytic degradation rate of Ni2P/CdS (a) and Ni2P/ZnS (b) under different concentrations of MB solution; degradation rate curves of MB solution with different loadings of Ni2P/CdS (c) and Ni2P/ZnS (d).

Figures 5(a) and 5(b) show the effect of dye concentration on the photocatalytic degradation efficiency when the catalyst amount is 0.05 g. It can be seen that the photocatalytic degradation ratios of two catalysts are different as the MB concentration increasing. When the MB solution concentration is 1 × 10⁻⁴ mol/L, the photocatalytic degradation ratios are much lower probably because the as-prepared catalysts could only produce a given amount of active free radicals when the dye concentration is high. These free radicals are not enough to degrade all dye molecules. In addition, high dye concentration could also affect light transmission and decrease the catalysts on the light absorption, thereby reducing the active sites on the catalyst surface and then the photocatalytic efficiency. Decreasing the concentration to 1 × 10⁻⁵ mol/L, the degradation ratios of two catalysts are the optimum, which can be up to 89% (Ni2P/CdS) and 78% (Ni2P/ZnS). Further decreasing to 1 × 10⁻⁶ mol/L, the photocatalytic degradation ratios are also poor (a for Ni2P/CdS and b for Ni2P/ZnS). This might be that the lower dye concentration will extend the activity scope of dye molecules and get less access to catalysts, which increases the recombination of the photo-production electrons and holes and reduces the photocatalytic ratios.Reference Huang, Li, Zhang, Li and Lei16 Therefore, the optimum MB concentration was 1 × 10⁻⁵ mol/L in our experiment. Figures 5(c) and 5(d) present the photocatalytic degradation curves as the catalysts are 0.1, 0.05, and 0.01 g, respectively. As shown in Figs. 5(c) and 5(d), the photocatalytic degradation ratios of Ni2P/CdS (Ni2P/ZnS) are only 38.1% (30.9%) and 50.6% (48.3%) when the catalytic amounts are 0.01 and 0.1 g. While increased to 0.05 g, the photocatalytic degradation ratios are obviously accelerated, which can achieve 89% (Ni2P/CdS) and 78% (Ni2P/ZnS) after 270 min. This might be due to the less photogenerated electrons and h-holes being generated when the catalyst is not enough, when the catalyst is too much, the light scattering effect is magnified and then the effective light intensity decreases, which are not conducive to UV light utilization, thus leading to the easy recombination of photogenerated electron (e−) and hole (h+), and affecting the photocatalytic degradation efficiency of the catalyst.Reference Chang and Park17
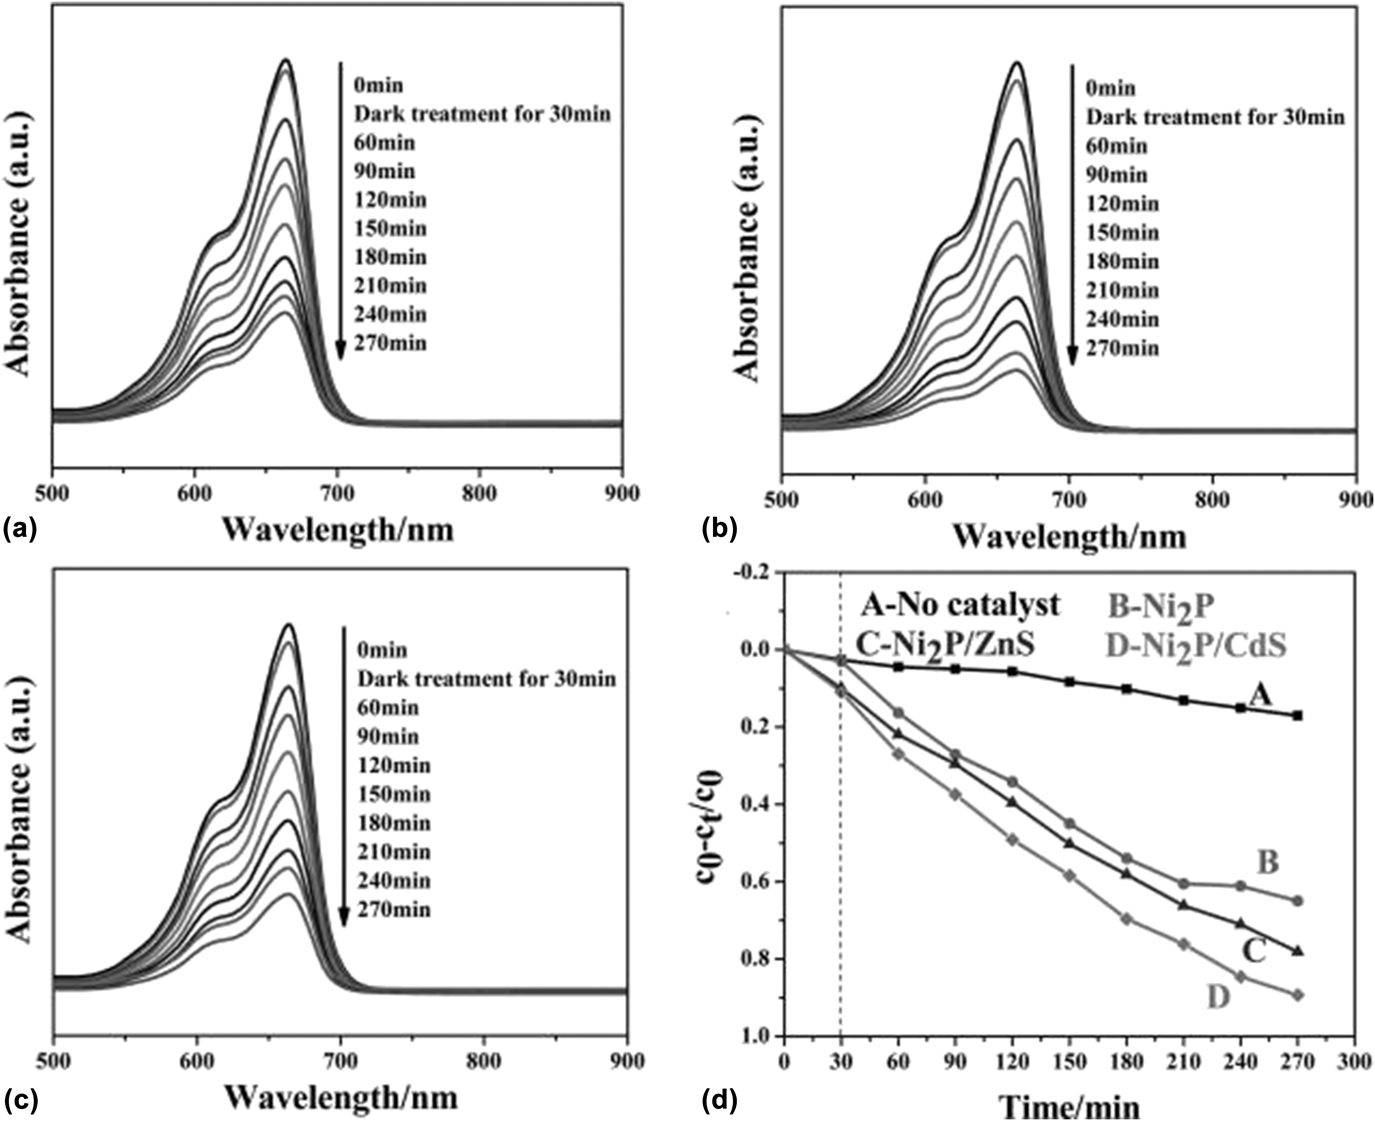
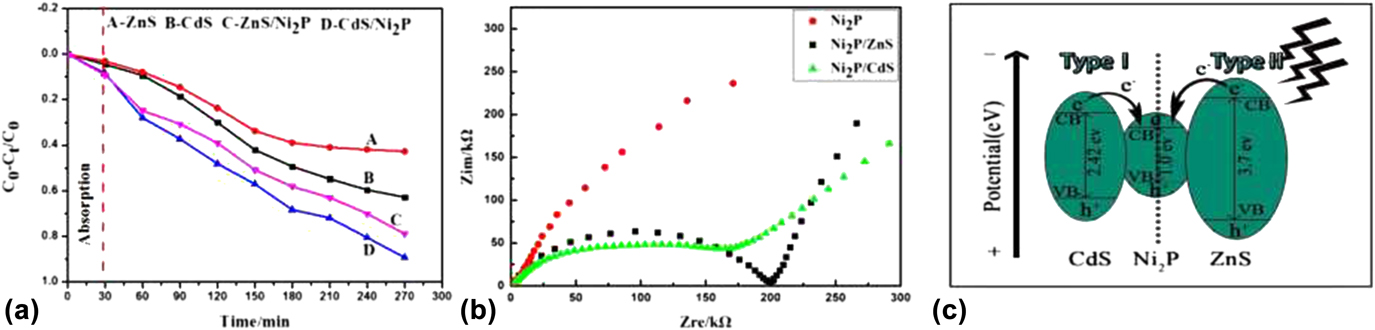
Figure 6 shows the UV-vis absorption spectra of MB solutions in the presence of Ni2P microspheres, Ni2P/CdS, and Ni2P/ZnS composites under a mercury lamp (500 W) irradiation at room temperature. From Figs. 6(a)–6(c), it is observed that the main absorption peak intensity of MB centered at about 663 nm gradually decreased with different degrees as the irradiation time increasing. Obviously, the degradation ratio for MB in the presence of as-prepared Ni2P/CdS and Ni2P/ZnS composites decreases greatly compared to Ni2P microspheres, indicating an enhanced photocatalytic degradation activity after coating. Figure 6(d) exhibits the degradation ratio curves of various catalysts for MB. The y-axis of degradation ratio curves is referred to as c 0 − c t/c 0, in which c t is the amount of MB at each irradiated time interval determined at the main wavelengths of MB, whereas c 0 is the starting amount of MB solutions without any measured. Obviously, when Ni2P/CdS and Ni2P/ZnS core–shell composites are used as the photocatalyst, the degradation ratio of MB can increase to above 89% (curve D) and 78% (curve C), showing a greater activity than that of Ni2P microspheres (65%) (curve B). In addition, the photocatalytic degradation activities of single-component CdS and ZnS were also investigated as the opposite experiments [as shown in Fig. 7(a)]. Similar to the above results, under the same degradation conditions, the degradation ratios for MB in the presence/absence of CdS and ZnS can be obtained. It can be seen that after 270 min UV irradiation, the degradation ratios of CdS and ZnS for MB are 62.8 and 42.9%, compared with those of Ni2P/CdS and Ni2P/ZnS (89 and 78%). The enhanced photocatalytic degradation activity of the Ni2P/CdS and Ni2P/ZnS composites may be attributed to the modification of CdS nanorods and ZnS nanoparticles on the surface of Ni2P microspheres, which can provide more active sites and promote the separation of the photo-production electrons and holes effectively, reduce the recombination probability, and increase the charge carrier lifetime.
UV-vis absorption spectra of MB in the presence of Ni2P microspheres (a), Ni2P/CdS composites (b), and Ni2P/ZnS composites (c); Corresponding degradation ratio curves of MB at different times (d).

Degradation profiles of MB with commercial CdS powder, commercial ZnS powder, Ni2P/CdS and Ni2P/ZnS (a); EIS Nyquist plots of Ni2P, Ni2P/CdS, and Ni2P/ZnS (b); Schematic illustration of the photocatalytic mechanism of as-prepared Ni2P/CdS and Ni2P/ZnS core/shell composites (c).

Electrochemical impedance spectroscopy (EIS) is a powerful tool to study the properties of materials, chemical (especially electrochemical) processes, and interface reaction mechanisms.Reference Leng, Zhang, Zhang and Cao18 Generally, the charge transfer resistance (R ct) equals to the semicircle in high-medium frequency, which can be ascribed to charge-transfer resistance. The separation ratio of the photo-production electrons and holes in the photocatalytic system is negative correlation with the charge transfer resistance. That is, the separation ratio of the photo-production electrons and holes is higher when the semicircle or the resistance is smaller, indicating the charge travelling faster. Obviously, the photocatalytic degradation ratio should be better.Reference An, Wang, Cheng, Zhao, Gao and Cheng19 Figure 7(b) is an EIS Nyquist plot of three samples (Ni2P, Ni2P/CdS, and Ni2P/ZnS). It can be seen that the R ct of Ni2P/CdS and Ni2P/ZnS samples are smaller than those of Ni2P, and the R ct of Ni2P/CdS is smallest, which is well consistent with the order of the photocatalytic degradation ratios. So based on the above results, the photocatalytic mechanism Ni2P/CdS and Ni2P/ZnS composites are deduced in Fig. 7(c).Reference Xu, Feng, Li, Xiao and Wang20 Under UV light irradiation, the valence band (VB) electrons of CdS and ZnS are respectively excited to its own conduction band (CB), while the holes remain in the VB. Then the excited electrons in the CB of CdS and ZnS would be injected into the CB of Ni2P driven by the potential energy. Thus, the effective separation of photo-excited electron-hole pairs can greatly reduce the chance of recombination. In other words, a large quantity of charges can participate in the photocatalytic degradation reaction. Subsequently, the electrons react with O2 adsorbed on the surface of Ni2P/CdS and Ni2P/ZnS composites to produce superoxide ions (O2−) to degrade MB. While, the photogenerated holes would react with H2O to produce hydroxyl radical (•OH), which are similarly beneficial for the degradation of MB. In summary, Ni2P/CdS and Ni2P/ZnS core–shell composites can produce much more reactive substances to participate in photocatalytic degradation of MB by the effective separation of photogenerated electron-hole pairs.
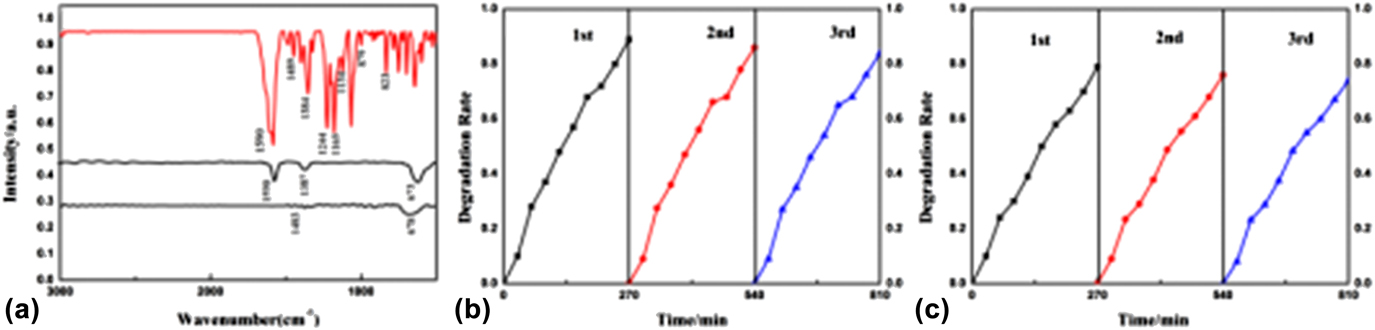
To further understand photocatalytic degradation efficiency, the infrared (IR) spectra of degraded dyes are also carried out. Figure 8(a) shows IR spectra of MB before and after photocatalytic degradation. The IR spectrum of MB before UV irradiation is just consistent with the standard spectrum. The characteristic peaks at 1590, 1486, 879, and 823 cm−1 come from skeletal and bending vibrations of the benzene ring structure. And the peak at 1384 cm−1 can be indexed as bending vibration of the methyl group. But after 270 min light irradiation, the characteristic peak intensity of the benzene ring is greatly weakened and almost disappears, indicating that benzene rings in MB molecules have been destroyed to varied extents. Beyond that, the characteristic peaks of C–N, C=S, and C–S are also disappear (located at 1244, 1165, and 1134 cm−1), indicating that the degradation is relatively complete. In addition, it is observed that there is a weak and broad peak located at 673 or 678 cm−1 for curve B and C, which might be the degraded product SO42− because SO42− has a moderate absorption at 680–570 cm−1 in the IR spectrum.Reference Yan, Gao, Wu, Tan and Zheng21 In addition to the photocatalysis degradation ability, the stability of catalysts is another important issue for their practical application. Therefore, the photocatalytic degradation stability of as-prepared catalysts (Ni2P/CdS and Ni2P/ZnS) is investigated by recycling them in the repeated degradation experiments [Figs. 8(b) and 8(c)]. After three cycles, they still can reach 83% (Ni2P/CdS) and 74% (Ni2P/ZnS) although the photocatalytic degradation ratios of two samples have tiny decrease, suggesting good photocatalytic degradation stability. The tiny decrease might be due to the detachment of some CdS or ZnS nanoparticles from the surface of Ni2P microspheres.
Infrared spectra of MB dye before and after photocatalytic degradation by Ni2P/ZnS and Ni2P/CdS (a); Cycling runs of photocatalysis degradation in the presence of Ni2P/CdS (b) and Ni2P/ZnS (c).

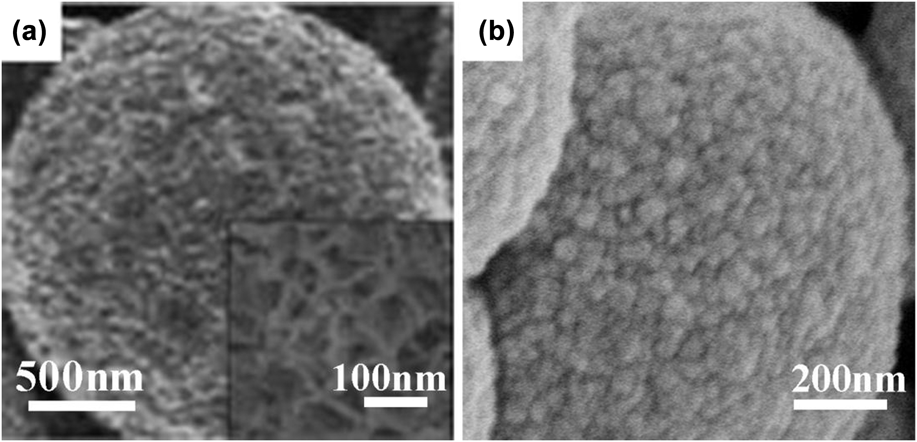
Figure 9 shows the FE-SEM images of Ni2P/CdS and Ni2P/ZnS after three cycles under UV irradiation. It can be seen that the morphologies of Ni2P/CdS and Ni2P/ZnS are unchanged, but the surfaces of the Ni2P/CdS and Ni2P/ZnS composites become relatively smooth after three cycles compared with those before degradation. This means that some big CdS or ZnS nanostructures fall off the surface of Ni2P microspheres, which leads to the tiny decrease of photocatalytic degradation ratios.
Typical FE-SEM images of Ni2P/CdS (a) and Ni2P/ZnS (b) after UV irradiation for three cycles.

IV. CONCLUSION
Ni2P/CdS and Ni2P/ZnS core–shell composites are synthesized successfully by a facile two-step chemical method. The further characterization results show that CdS nanorods or ZnS nanoparticles are coated on the surfaces of Ni2P microspheres. Both Ni2P/CdS and Ni2P/ZnS show good degradation activity and stability compared with the pure Ni2P microspheres. The degradation parameter experiments suggest that the optimum addition amount of the catalyst is 0.05 g and the MB concentration is 1 × 10⁻⁵ mol/L. In this paper, the preparation route of two composites is simple and effective, which might provide a good thought for design and preparation of the highly efficient photocatalyst in environmental protection and water treatment.
ACKNOWLEDGMENTS
The authors appreciate the financial support from the National Natural Science Foundation of China (21301113), the Natural Science Foundation of Shaanxi Province of China (2015JM2059), the Scientific Research Planning Program of the Education Department of Shaanxi Province (15JK1080), the Scientific Research Planning Program of Key Laboratory of Shaanxi Province of China (15JS011), and the Graduate Innovation Fund of Shaanxi University of Science and Technology.