Carbapenem-resistant Enterobacterales (CRE) are one of the most common multidrug-resistant organisms (MDROs) responsible for healthcare-associated infections. Reference Van Duin and Doi1–4 Rapid spread of CRE is a serious public health issue and a recent increase in its prevalence is of major global concern. Reference Bonomo, Burd and Conly5 CRE are resistant to many antibiotics and spread rapidly within and between healthcare facilities, with the potential to cause a regional epidemic. Reference Woodworth, Walters and Weiner2,4 Carbapenemase-producing Enterobacterales (CPE), particularly Klebsiella pneumoniae carbapenemase (KPC), are commonly identified in hospital environments and often transmitted among patients admitted to healthcare facilities. Reference Van Duin and Doi1,Reference Bonomo, Burd and Conly5,Reference Yan, Zhou and Du6 CPE can survive in healthcare environments for several days, becoming a point source of infection for vulnerable patients. Reference Kotsanas, Wijesooriya and Korman7
Healthcare connectivity and patient sharing for continued short-term or long-term rehabilitative care increases patient-to-patient exposure or exposure to reservoirs in healthcare settings. Reference Huang, Avery and Song8 Acute-care hospitals and long-term care facilities are highly interdependent due to patient-sharing patterns or interfacility movement of high-risk patients. Reference Simmering, Polgreen, Campbell, Cavanaugh and Polgreen9 This may increase the risk of spread of antibiotic-resistant pathogens within the healthcare network.
Patients who have had symptomatic CRE infections are at increased risk of reinfection Reference Sreeramoju, Montie, Ramirez and Ayeni10,Reference Emerson, Eyzaguirre, Albrecht, Comer, Harris and Furuno11 and readmission within a few weeks or months at the same or a different facility, likely introducing CRE organisms to another facility. Reference Shimasaki, Segreti and Tomich12 Accordingly, healthcare facilities with high patient traffic may play a pivotal role in the regional spread of CRE. Reference Barbadoro, Dichiara and Arsego13 The impact that interfacility patient movement may have as an important path through which CPE infections spread suggests the need to prioritize high-risk healthcare facilities for targeted infection control interventions. Reference Barbadoro, Dichiara and Arsego13
Although healthcare facility-specific outbreaks and intrafacility transmissions have been widely reported, Reference Huang, Avery and Song8,Reference Campos, Albiero and Ecker14–Reference Reuben, Donegan and Wortmann16 the mechanistic details of regional spread and cluster transmission between facilities has not been well investigated. CRE infection control and prevention require a regionally coordinated approach that includes oversight and monitoring of the extent of infection across a region. Reference Slayton, Toth and Lee17 The extent of the CRE spread and risk of exposure could be predicted by conducting social network analysis using patient interfacility transfer data. The purpose of this study was to explore CRE regional transmission patterns and examine the effect of healthcare network metrics on facility-specific rates using social network analysis.
Methods
Study design and data source
A multi-institutional retrospective cohort study was conducted in the Greater Houston region, Texas. Healthcare interfacility network data were constructed using CRE surveillance data collected from 2015 to 2020 at the Houston Health Department and the adjacent county, Fort Bend County Health and Human Services. CRE are reportable infectious diseases in Texas, and healthcare facilities (HCFs) have been required to report identified CRE cases to the health departments. Health departments investigate all identified cases by obtaining laboratory data (ie, clinical laboratory tests, susceptibility tests, and molecular tests, when available), electronic medical records, patient demographics, clinical data, health facility information. These data are used to identify potential source and risk factors of the infection.
A social network analysis was conducted to identify the patterns of regional spread and to visualize interfacility patient transfer network in relation to CRE exposure. The Greater Houston metropolitan area is the fifth most populous in the United States, with an estimated population exceeding 7 million in 2020. 18 Houston also has a large number of healthcare facilities, including the largest medical center in Texas.
The study population included 268 healthcare facilities (HCFs) from which 5,099 CRE cases were primarily reported or attributed. The CRE surveillance data was used to generate an HCF network dataset that included HCF attributes, case counts, and facility types. HCFs included were acute-care hospitals (ACHs), long-term acute-care facilities (LTACs), and long-term care facilities (LTCFs). HCFs were included if at least one CRE case was originated from (case was reported from or transferred from the facility), or if the patient was a resident of the facility or the patient was discharged to the facility. CRE cases were excluded from this analysis in situations in which the patient was tested at an outpatient clinic or home health care and had not been admitted to or resided in an HCF in the 6 months prior and the CRE case could not be linked to any HCF.
A facility-to-facility patient transfer network was constructed using the HCF network dataset. The patient interfacility transfer was either “direct facility-to-facility” transfer or “indirect” transfer (ie, no same-day transfer) because CRE patients can be colonized for a prolonged duration of time. Therefore facility-to-facility patient transfer was considered in this study if it occurred within the past 6 months.
Study variables and operational definitions
The primary outcome of interest was the CRE case count of each HCF. CRE was defined as Enterobacterales that were resistant to at least one carbapenem antibiotic or produced a carbapenemase enzyme that inhibits the carbapenem action. Carbapenemase test results included in this study were obtained from the clinical laboratory of the reporting hospitals or public health laboratories and the results were either from the phenotypic or genotypic tests. An incident CRE case was defined as a patient who had a positive culture for CRE from clinical isolates that was identified at a specific HCF after 48 hours of admissions. Each CRE case was attributed to an HCF based on the patient’s exposure or location at the time of specimen collection. The transferring facility represented the source facility or the origin of the case in the network. If the patient was a resident of the same facility where the culture was performed, or if the patient was transferred from home, then no transferring HCF was designated in the network. However, if the patient had been in a HCF in the past 6 months, the facility where the patient had previously resided represented the transferring facility in the network.
A directed interfacility CRE case patient transfer network was constructed, where individual HCFs were designated as nodes. Facilities were linked to each other by a case patient who had been admitted to or was a resident of the facilities. In the one-mode directed network graph, nodes were shown by points representing facilities and lines with arrows representing directionality of edges connecting nodes.
Independent variables were the type of healthcare facility (ie, ACH, LTAC, or LTCF), the number of cases transferred from the different types of HCFs, and healthcare network metrics. The healthcare network metrics included degree centrality (count), in-degree centrality, out-degree centrality, and clustering coefficients. Degree centrality is a measure of how well connected the actor is or simply the number of edges linked to a given actor or node. In this context, it denotes the total number of potentially infectious contacts that a facility produces. A high degree of centrality would mean most contacts because it could indicate potential super spreaders. Clustering coefficients represented the degree to which a given facility clustered in relation to its neighboring facilities. In-degree centrality represented the total number of cases directed toward the facility (node). Out-degree centrality represented the total number of cases originating from a facility and destined for other facilities (nodes).
Statistical and social network analysis
Epidemiologic tabular data were converted into an edge-list format to generate an actor-by-actor adjacency matrix in UCINET version 6.716 software. Reference Borgatti, Everett and Freeman19 In the edge-list network data, healthcare facilities were considered actors (nodes), and patient movement between them formed ties. Healthcare network metrics were computed in UCINET, including degree centrality, in-degree centrality, out-degree centrality, and clustering coefficient. A merged network data set was generated by combining the computed healthcare network metrics with the node’s attributes, which included types of HCF, CRE case counts per facility, source of patient transfer, and the number of cases transferred from LTCFs, LTACs, and ACHs. Visualization of the healthcare exposure network graphs were performed in Gephi version 0.9.2 software. Reference Bastian, Heymann and Jacomy20 Hierarchical cluster analysis was conducted on the network data set, separately for KPC-producing CRE and NDM-producing CRE cases to examine the HCF clusters for the transmission of these highly transmissible genes. To produce a cluster of healthcare facilities with higher interfacility CRE patient transfers and the risk of exposure, a cluster analysis was performed with the community detection algorithm, Reference Andry and Budi21 and the cluster adequacy was checked using clustering coefficient indexes.
The distribution across groups for continuous variables was compared using the Kruskal-Wallis test. Spearman correlation coefficients were used to examine the relationship between network metrics. A multivariable model was constructed using a generalized linear model with zero-inflated negative binomial distribution to test the association between each healthcare network metric and facility-specific CRE case rates. All variables with P < .10 in the univariate models were included in the multivariable model. The model goodness of fit was examined using the Pearson χ2 test. All tests were 2-sided with 5% level of significance. Adjusted rate ratios (ARRs) were computed along with a 95% confidence intervals (CIs). Variables with estimates at P < .05 were considered statistically significant. Except for the network analyses, which was analyzed using UCINET and Gephi, all statistical analyses were carried out using SAS version 9.4 software (SAS Institute, Cary, NC).
This study was reviewed and approved as exempt by the Institutional Review Board of the University of Texas Health Science Center in Houston, Texas.
Results
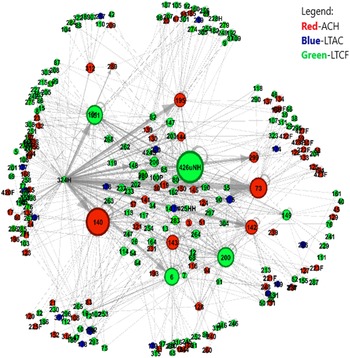
Table 1 shows the distribution of CRE cases and network metrics based on the type of healthcare facilities. In total, 268 healthcare facilities were included in the analysis, among which 100 (37.3%) were ACHs. Figure 1 shows the network graph for all CRE patients transferred between the identified facilities. On average, there were 29 case patient-transfer connections (degree) with a minimum of 0 and a maximum of 710 connections. From 2015 to 2020, 5,099 CRE patients attributed to the 3 types of healthcare facilities were transferred between facilities. Although 10 HCFs (all of which were ACHs) accounted for ∼63% of reported cases, 2 ACH facilities were outliers with high numbers of CRE cases (Fig. 2).
Distribution of Network Metrics and Case Patient Transfer Characteristics by the Type of Healthcare Facility in the Greater Houston Region, Texas, 2015–2020

Note. ACH, acute-care hospital; LTAC, long-term acute-care facility; LTCF, long-term care facility.
a The P value is the test of distribution based on the Kruskal-Wallis test.
b The number of case counts is not unique cases; cases may have been transferred to multiple facilities due to readmission and/or re-testing during readmissions at a different facility; and a single case may have been attributed to multiple facilities.
Interfacility patient transfer network among healthcare facilities in the Greater Houston, Texas, 2015–2020. Note. LTCF, long-term care facilities; ACH, acute-care hospital; LTAC, long-term acute care. The size of the nodes corresponds to the betweenness centrality.

Box and whisker plot showing the distribution of cases by the type of healthcare facilities in the Greater Houston, Texas, 2015–2020. Note. LTCF, long-term care facilities; ACH, acute-care hospital; LTAC, long-term acute care.

Bivariate analysis revealed a statistically significant difference (P < .001) in the median total case counts among the healthcare facilities. The facility-specific case counts were highly correlated with the total degree centrality (r = 0.69) and in-degree centrality (r = 0.74), but they were not strongly correlated with the out-degree centrality (r = 0.45). The median in-degree centralities of the 3 types of HCF were significantly different (P < .001). There was no significant difference in the median out-degree centrality between the 3 types of healthcare facilities (P = .69).
In the multivariable model, the facility-specific rate of CRE was significantly associated with the type of HCF and in-degree centrality but not with the number of cases transferred from either ACHs, LTACs, or LTCFs (Table 2). The incidence rate of CRE reported from ACHs was >4 times that of LTCFs (ARR, 4.5; 95% CI, 3.02–6.72), and the incidence rate of CRE originating from LTACs was ∼7 times that of LTCFs (ARR, 7.04; 95% CI, 2.48–19.75), after adjusting for the different sources of patient transfer, clustering coefficient, and in-degree centrality. Each additional patient transferred from other facilities (in-degree centrality) conferred a 3% increase in the CRE case incidence rate (ARR, 1.03; 95% CI, 1.02–1.04).
Healthcare Network Metrics and Factors Associated with the Facility-Specific Incidence Rate of CRE, 2015–2020, Greater Houston, Texas

Note. CRE, carbapenem-resistant Enterobacterales; CI, confidence interval; ACH, acute-care hospital; LTAC, long-term acute-care facility; LTCF, long-term care facility. Pearson χ2 test model good fit (P = .87). Bold indicates statistical significance.
Cluster transmission of KPC-producing CRE
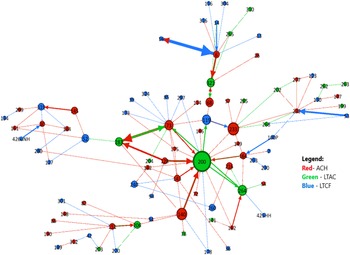
Figure 3 represents KPC-producing CRE transmission network graph that occurred in 4 clusters involving 98 HCFs. In each cluster, there was an ACH with high degree of centrality. The measure of cluster adequacy indicated that 82.8% of clusters had high within similarity and distinct without. The nodal size corresponds to the degree (number of connections or cases transferred), and the thickness of line color corresponds to the out-degree centrality (representing the number of CRE cases transferred out to neighboring facilities). LTAC-200 had high degree centrality and betweenness centrality. The high in-degree centrality suggested that the facility received large KPC cases from within the cluster facilities. The high-betweenness centrality also suggested how important this facility was in bridging other facilities in transmitting KPC-CRE in regional transmission.
KPC-CRE clustering pattern in interfacility transfer network in the Greater Houston, Texas, 2018–2020. Note. Red line, case from ACH; green line, case from LTAC; blue line, cases from LTCF. The thickness of line color corresponds to the out-degree centrality.

Cluster transmission of NDM-producing CRE
NDM-CRE transmission occurred in 3 clusters involving 19 HCFs (Fig. 4). Most of the transmission occurred in ACHs (17 ACH facilities), with only 1 LTAC and 1 LTCF. The first cluster (n = 10), with 1 LTAC and 9 ACH, accounted for ∼53% of all NDM-producing CRE cases. The proportion of the total NDM-producing CRE cases that were clustered in the second cluster (n = 4) and third cluster (n = 5) were 21% and 26%, respectively. Interestingly, the NDM-producing CRE transmission between these clusters was epidemiologically linked to cases that originated from abroad. Two patients who received medical care abroad and traveled to Houston for medical care were shared between these clusters (Fig. 4).
Transmission of NDM-producing CRE in clusters of healthcare facilities in the Greater Houston, Texas, 2018–2020. *Two cases who were transferred between the first and second clusters were cases who had medical care abroad and traveled to Houston, suggesting that the NDM transmission was epi-linked to these 2 cases.

Discussion
The findings in this study showed that the vast majority of CRE cases reported were attributed to or reported from ACHs. Although 10 ACHs accounted for 63% of all CRE case sources, 2 ACHs stood out as outliers with the highest CRE case counts in the region, indicating that CRE was endemic with year-long transmission at these facilities. These facilities also had a high degree centrality, suggesting that they were central in the CRE patient interfacility transfer and spread of the infection in the region. However, a possible reason for observing high case counts at the ACHs is that patients admitted to ACHs from LTCFs and LTACs are more likely to be colonized with KPC-producing CRE, Reference Munoz-Price22–Reference O’Fallon, Gautam and D’Agata24 and they have the potential to transmit the infection to ACHs upon admission. Colonized or infected residents of LTCFs may serve as reservoirs, with increased risk of introducing the infection to ACHs, leading to a higher case burden at ACHs. Reference Prabaker, Lin and McNally23 Therefore, cases admitted from LTACs or LTCFs should not be overlooked, and facilities with high case burden need to be targeted for intervention.
Our results demonstrated that transmission of healthcare-associated CRE occurred through clusters of highly connected healthcare facilities. Particularly, transmission of KPC-producing CRE occurred via 4 clusters of HCFs in the region. The majority of the edges were directed from ACHs to lower-level healthcare structures, but LTACs played a bridging role in the regional transmission. The LTAC with high betweenness centrality in the KPC-CRE transmission network appeared as a central player in facilitating KPC dissemination. A similar situation was reported in a previous study. Reference Won, Munoz-Price and Lolans25 Evidently, targeted infection control measures at the identified LTACs could play a potential role in halting KPC propagation.
NDM-producing CRE transmission occurred in three clusters of HCF in the region, where 90% of the transmission occurred between ACHs. Unlike KPC-CRE, transmission of NDM-producing CRE primarily occurred in ACHs. This is because NDM-CRE probably spreads during acute and invasive medical procedures, which are generally performed in ACHs. In addition, the spread of NDM-CRE is often a ‘point source,’ in which transmission occurs via contaminated devices that often require high-level disinfection. Reference Epstein, Hunter and Arwady26,27 The cluster analysis revealed that transmission of NDM-producing CRE could be traced to 2 NDM-CRE patients who had received medical care abroad (India and Africa) before traveling to Houston for medical care. The 2 cases belonged to 2 different ACHs in 2 separate clusters. Previous reports have indicated that NDM-producing CRE is commonly identified in India yet rare in Africa. Reference Van Duin and Doi1,Reference Safavi, Bostanshirin and Hajikhani28
In-degree centrality was the main predictor of facility-specific CRE rate, regardless of the source of patient transfer. Each additional connection conferred a 3% increase in the rate of CRE at a given HCF. Additionally, the rate of CRE in LTACs was 7 times the rate of CRE in LTCFs, whereas the rate of CRE in ACHs was 4-fold that of LTCFs. However, the facility-specific CRE case rate was not associated with the number of CRE cases transferred from either an LTAC or an LTCF. This finding is in line with a study from Chicago, which also indicated that hospitals with higher connectedness had higher CRE case burden, Reference Ray, Lin, Weinstein and Trick29 and the number of patients shared from LTACs, LTCFs, or ACHs was not associated with the CRE case rate. Furthermore, the facility-specific CRE case rate was not associated with clustering coefficient. This may imply that the rate of CRE cases generated within a facility may be largely due to either intrafacility factors or importation by colonized patients, who serve as reservoirs and vehicles of transmission. Reference Prabaker, Lin and McNally23,Reference McKinnell, Miller and Singh30
This study had several limitations. First, given the source of data, facility-level factors such as the measure of facility size were not included in the analysis, which may have resulted in a biased estimate in the facility-specific rate of CRE. However, regardless of controlling for the size of healthcare facilities, the finding in this study is consistent with other studies. Reference Won, Munoz-Price and Lolans25,Reference Ray, Lin, Weinstein and Trick29 Second, a random effect from within individual facilities were not controlled due to the small sample size. Furthermore, CRE definition in our study includes non–carbapenemase-producing Enterobacterales that are not epidemiologically important since they do not typically lead to cluster transmissions. Lastly, the study was based on surveillance data, and cases may have been underreported, which may have led to underestimated degree centrality of the facility.
It is imperative that infection control efforts in the region provide targeted interventions at the high risk facilities. Stopping the chain of transmission may require short-term but robust active surveillance coupled with strict infection control and disinfection targeting at the high-risk facilities. Cluster-based transmission of MDROs associated with the healthcare facilities network underscores the critical role of interfacility communication and risk-based patient sharing in limiting the spread of resistant pathogens. Social network analysis methods may have the potential to visually depict regional dissemination of healthcare-associated infections, such as CRE, much better than traditional epidemiological outbreak investigation, if it is integrated with a molecular method.
Acknowledgments
We appreciate the Houston Health Department and Fort Bend County Health and Human Services for allowing us to use the surveillance data. This study was made possible with the support of the University of Texas Health Sciences Center School of Public Health at Houston, Texas. The findings and conclusions reached in this study are those of the authors only and do not necessarily represent the official position of either the authors’ institutional affiliations, health departments, or the centers that performed the laboratory tests.
Financial support
There was no funding received for this study. C.D. was supported by NIH/NIAID grants R01AI116914 and R01AI150685.
Conflicts of interest
All authors report no conflicts of interest relevant to this article.