Recent research shows that political elites are disproportionately more responsive to the preferences of highly educated, politically active and affluent voters.Footnote 1 In this article, I build on this literature and explore party responsiveness to the preferences of women – arguably one of the most salient subconstituencies in Western democracies but one that has been largely overlooked in the responsiveness literature. Specifically, I examine whether European mainstream party rhetoric responds equally to the preference shifts of women and men. Furthermore, borrowing insights from the literature on the representation of women, I also examine whether the share of women in national parliaments affects party responsiveness to women’s preferences.
Previous studies of subconstituency representation suggest that parties are likely to be more responsive to preference shifts among men, since they are, on average, more politically active, wealthier and more highly educated.Footnote 2 However, current research on women’s descriptive and substantive representation in parliaments commonly assumes an implicit link between the two, suggesting that an increase in the share of female politicians in parliament will lead to a stronger impact of women’s preferences on actual policies.Footnote 3 The steadily increasing number of women in European parliaments over the last five decades therefore implies that parties should be increasingly responsive to women.
The analysis reported in this article challenges the idea of the link between descriptive and substantive representation. Using data on twelve Western European countries from 1973 to 2012, I find that parties’ policy programs respond to the preference shifts of both women and men, which is in line with earlier studies of representation.Footnote 4 However, I also show that parties are more responsive to preference shifts among men than women. The share of female politicians in parliament does not affect this asymmetry in responsiveness.
I argue that the disconnect between descriptive and substantive representation arises because in European democracies, parties – not single members of parliament (MPs) – are responsible for representing citizens. The combination of parties’ gate-keeping power, socialization effects and party discipline prevents women from behaving significantly differently from men once they are elected to parliament.Footnote 5 In other words, despite the growing descriptive representation of women in parliaments and the significant differences between the preferences of women and men in the electorate, we do not observe an improved responsiveness to women’s preferences, because female MPs are expected to vote along party lines just like male MPs.
The results have a number of important implications. First, they contribute to the research on unequal representation and party responsiveness,Footnote 6 which has previously largely ignored the role of gender at both the elite and mass levels. Secondly, they extend the literature on women’s substantive representation,Footnote 7 which has not considered Left–Right positioning as a form of substantive representation and does not often consider the congruence between voters’ preferences and elite behavior. Most importantly, since the share of female politicians in parliament does not condition the responsiveness of parties to either men or women, the analysis suggests that descriptive representation may not always be linked to substantive representation. In other words, while descriptive and substantive representation might be linked in other ways, within the setting of the analysis presented here, men seem to represent women’s interests in parliament as well or poorly as women do.Footnote 8
PARTY RESPONSIVENESS TO WOMEN AND MEN: THEORETICAL EXPECTATIONS
Macro-level studies have repeatedly shown European mainstream parties to react strongly to changes in an electorate’s mean voter position.Footnote 9 Those findings are independent of the underlying assumptions regarding parties’ motivations. Whether they are aiming for office, policy or votes, policy makers will generally have incentives to closely track changes of the mean voter’s preferences. At the subconstituency level, opinions as to whether parties respond equally to shifts of different subgroups of the electorate diverge slightly. Focusing on more and less affluent voters, Bartels and Gilens argue that policy shifts are best explained by the preferences of high-income voters, and that parties and politicians are particularly unresponsive to the preferences of low-income citizens.Footnote 10 Griffin and Newman show that office holders are disproportionately responsive to the preferences of the politically active.Footnote 11 Education and political sophistication have been shown to affect party responsiveness,Footnote 12 and Adams and Ezrow also find that European parties are particularly responsive to preference shifts among citizens who regularly engage in political discussions and persuasion (so-called opinion leaders).Footnote 13
Based on these previous findings, parties are likely to be more responsive to preference shifts among men than women. This is because men are, on average, more politically active than women, earn more, are more highly educated and more likely to act as opinion leaders within their respective social contexts – all characteristics that have been shown to lead to higher party responsiveness.Footnote 14 At the same time, there is a crucial difference that distinguishes income- or knowledge-related subconstituencies from the subconstituencies of women or men as a whole: the latter are almost perfectly equally distributed among the electorate. Since women make up roughly half of all potential voters, the mean voter literature would clearly predict at least a certain degree of responsiveness regarding their preferences as well. As a result, I arrive at the following two hypotheses.
Hypothesis 1: European mainstream parties respond to shifts in the preferences of both men and women.
Hypothesis 2: European mainstream parties are more responsive to shifts in the preferences of men than of women.
A second crucial distinction that differentiates the female subconstituency from those of the poor, politically inactive or uneducated, is that female representation has been steadily increasing in European parliaments over the last five decades,Footnote 15 which should provide female parliamentarians with opportunities to actively shape policies in a way that would be congruent with women’s preferences.
Analyzing whether this is the case, scholars have long studied the descriptive representation of women to analyze differences in the number of women in national parliaments,Footnote 16 as well as the substantive representation of women, which focuses not on the quantity but the quality of female representation. One of the key findings that has frequently been confirmed in the United States and comparative contexts is that women tend to be responsible for introducing a disproportionate amount of women-related legislation.Footnote 17 Wängnerud, for example, concludes her analysis of parliamentary survey studies of the Swedish Riksdag with the finding that ‘women’s interests are primarily represented by female politicians’.Footnote 18
While this might imply a link between the descriptive and substantive representation of women, few studies have explicitly analyzed this relationship.Footnote 19 Most of the existing analyses that do study the interplay of the two concepts rely on Phillips’s theory of the politics of presence, which argues that there is a link between descriptive and substantive representation because women are better equipped to represent the interests and needs of women than men.Footnote 20 As a consequence, more women in parliament should lead to better responsiveness to women’s preferences. These normative considerations and empirical findings directly lead to the third hypothesis.
Hypothesis 3: European mainstream parties’ responsiveness to women’s preferences increases with the seat share of women in the respective national parliament.
However, summarizing the findings of studies analyzing the link between women’s descriptive and substantive representation in a review of the field, Wängnerud carefully concludes that the ‘safest position would be to say results are “mixed” when it comes to empirical support’.Footnote 21 This assessment also seems to be in line with the fact that, apart from differences regarding clearly gender-related legislation, most studies find only very limited differences between male and female politicians. Instead, party membership is often found to be the best predictor of values, attitudes and actions; once party-level variation is accounted for, differences between women and men in parliament often become insignificant.Footnote 22 Given the significant role of party discipline in Europe’s parliamentary democracies, this is hardly surprising.Footnote 23 After all, both women and men are organized into parties with common policies and will usually be bound to support their party line, regardless of their gender. This in turn will significantly limit female parliamentarians’ opportunities to make an impact that is decisively different from that of their male counterparts.
Another argument is that of socialization. Since most societies are still largely male dominated, women in leadership roles are often found to share ‘male’ characteristics such as toughness, aggression and determination.Footnote 24 This applies to both jobs in business and politics. Fukuyama discusses the phenomenon and describes Margaret Thatcher as the quintessential example: she was ‘far tougher and more determined than any of the male politicians she came up against [and] had beaten men at their own game’.Footnote 25
Moreover, gate-keeping is an additional party-level phenomenon that hinders women’s political ambitions. Whether in the form of (still mostly male) party leadership or parties’ institutional rules, gate-keeping makes women less likely to be promoted, recruited or encouraged to run for office, especially if they are likely to go against existing party lines and ideas.Footnote 26
In other words, if women who succeed in politics often act like men and share some of their characteristics, one would not expect an increase in the descriptive representation of women to also improve their substantive representation. In fact, a non-existing link would be in line with Osborn’s study of US state legislatures, which shows that party identity prevails over gender differences.Footnote 27 Focusing on Western Europe, O’Brien’s comparative analysis equally challenges the notion that an increase in women’s descriptive representation will necessarily lead to improved substantive representation.Footnote 28 Recent studies in psychology come to similar conclusions as well, showing that both male and female university faculty members are consistently biased against female applicants, regardless of their own gender or existing levels of women’s representation in the faculty or student body.Footnote 29
Therefore, if women do not behave significantly differently from men once they are elected to parliament, because they share character traits and are equally bound to follow a party line, there is no reason to assume that a change in levels of female parliamentarians should lead to any measurable change in responsiveness to women’s preferences. These considerations motivate the fourth and final hypothesis.
Hypothesis 4: European mainstream parties’ responsiveness to women’s (and men’s) preferences is not conditioned by the seat share of women in the respective national parliament.
DATA, MEASURES AND MODEL SPECIFICATION
To arrive at a longitudinal measure of public opinion across Western Europe, I utilize the Eurobarometer surveys conducted on behalf of the European Commission. On average, the surveys ask more than 3,600 respondents per year in each country to place themselves on a 1–10 Left–Right ideological scale (where 1 indicates an extreme left position and 10 is extreme right).Footnote 30 For the time period from 1973 (the first year that the Left–Right self-placement item appears on the Eurobarometer survey) to April/June 2002, I rely on the Mannheim Eurobarometer Trend File 1970–2002,Footnote 31 which compiles the Eurobarometer surveys for these years. For the subsequent period from September/October 2002 to November 2012, I collected the missing Eurobarometer data myself and created an updated Eurobarometer Trend File 1973–2012. While the original Mannheim Trend File already compiled Left–Right self-placement data for 742,123 respondents across 78 Eurobarometer surveys for the twelve Western European countries of the analysis, the extension of the dataset to late 2012 adds an additional 611,481 respondents from fifty-one surveys.
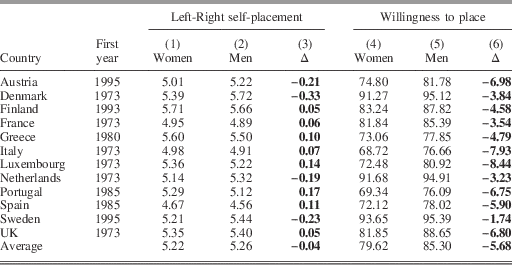
Based on this total of 129 Eurobarometer surveys, Table 1 presents summary statistics of the Left–Right measure across the twelve countries included in the analysis and compares the responses from women and men. These statistics are based on the full set of Eurobarometer surveys administered between 1973 and 2012, which leads to huge sample sizes. Apart from Luxembourg, the results for all other countries are based on over 80,000 respondents.Footnote 32 Columns 1–2 report the average Left–Right self-placements of women and men, and Column 3 presents the results of a series of t-tests to determine if the differences between these placements are significant. Relying on the same Eurobarometer question, Columns 4–5 report the percentage of women and men willing to place themselves on the Left–Right scale in a given country, and Column 6 reports the results of the respective t-tests.
Eurobarometer Respondents’ Left-Right Self-Placements, 1973–2012

Note: ‘First year’ indicates the first year for which Left-Right self-placements are available for a given country. The summary statistics in Columns 1–2 and 4–5 are based on the full set of Eurobarometer surveys administered between 1973 and 2012. The average number of respondents per country that were used to compute these figures was over 112,500. Columns 1–2 report the average Left-Right self-placements of women and men and Columns 4–5 report the percentage of women and men willing to place themselves on the Left-Right scale in a given country. In Columns 3 and 6, Δ reports the differences between women and men, and presents the results of corresponding t-tests. All differences are significant at the 99 per cent confidence level.
The results show that women are significantly less likely – on average, about 6 percentage points – to place themselves on the scale across all twelve countries. The variation of differences ranges from just below 2 percentage points in Sweden to over 8 percentage points in Luxembourg. These patterns are in line with existing survey research that demonstrates that women tend to exhibit lower levels of political knowledge than men on traditional knowledge questions, and that women are less likely to guess when they do not know the answer to a specific question.Footnote 33 Turning to the summary statistics on average Left–Right placements, the results are less clear. Women are found to be placing themselves, on average, just to the left of men, but this result is strongly driven by only four of the twelve countries included in the analysis: Austria, Denmark, the Netherlands and Sweden. In the other eight countries, women place themselves to the right of men, on average.
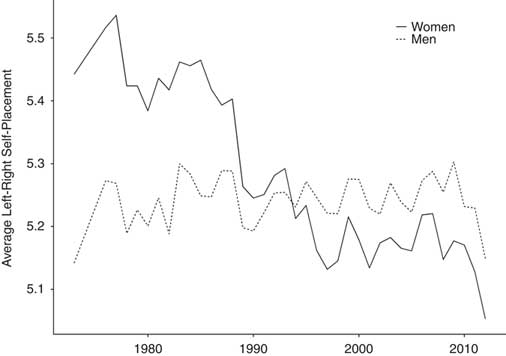
The main reason for the rather mixed findings regarding Left–Right self-placement might be due to what Inglehart and Norris call gender realignment.Footnote 34 They show that female conservatism was a widespread and well-established phenomenon during Western Europe’s post-war era; women would routinely position themselves to the right of men. However, this tendency was first succeeded by a process of gender dealignment during the 1980s and then eventually replaced by a new gender realignment. Whereas the traditional gender gap in post-war Europe and the United States saw women as more conservative and to the right of men, this started to change during the 1980s when the ideological gap between men and women started closing. In the 1990s women realigned to the left of men. As Inglehart and Norris point out: ‘by the mid-1990s, the [initial] position had reversed – women had moved [from the right] to the left of men’.Footnote 35
Extending the time-series that Inglehart and Norris use by almost fifteen years, Figure 1 supports their argument. In the 1970s and early 1980s, women clearly place themselves to the right of men on the Left–Right scale. Beginning in the mid-1980s their positions start to converge, and by 1994 women in the twelve European countries analyzed here are, on average, more leftist than men. Only in the early 2000s does the average position of women start to stabilize again (apart from a sharp shift to the left by both women and men post-2010). The figure also confirms another one of Inglehart and Norris’ findings: while women shifted their average position significantly from the right to the left over the last few decades, the self-placements of men have remained remarkably stable during the same period. These findings are relatively consistent across all twelve countries in this study and are mostly driven by changes among right-leaning women, who have moved to the left much more consistently than their already left-leaning counterparts.Footnote 36 Viewed together, the summary statistics presented in Table 1 and the time-series data in Figure 1 suggest that women do significantly differ from men in their political ideologies and that there are considerable changes in those ideologies over time.
Eurobarometer Left-Right Self-Placements of Women and Men, 1973–2012

Measures and Model Specification
Do political parties’ manifestos represent the different preferences of women and men equally well? And is the responsiveness to women’s preferences conditioned by women’s seat share in the respective national parliament? In order to test my hypotheses, I follow previous research and model party movements over time.Footnote 37 More specifically, the outcome variable Party Shift (t) captures party shifts along the Left–Right dimension between two elections. In other words, it indicates the difference in a given party’s Left–Right position between the current election (t) and the previous election (t − 1). Similarly, [Party Shift (t − 1)] is the change in the same party’s Left–Right position between the previous election (t − 1) and the preceding one (t − 2).
To derive party policy positions and shifts over time, I rely on data provided by the Manifesto Project.Footnote 38 This project conducts content analysis of electoral manifestos to determine a party’s position on the Left–Right scale. Based on the ideas of saliency theory, the project has specifically trained scholars coding each quasi-sentence of a given manifesto into a predefined fifty-six-category coding scheme.Footnote 39 To measure a party’s placement on the Left–Right scale, the Rile score is calculated, which subtracts the added percentages of a party’s scores in thirteen left categories from the added percentages of scores in thirteen right categories.Footnote 40 The result is a score theoretically ranging from −100 (extreme left) to 100 (extreme right). The project is unparalleled in its coverage of party positions across both time and space. Spanning the whole post-war period, the latest version of the dataset provides data for over 3,600 manifestos from 900 parties competing in over 600 elections in fifty-five different countries. This means that the dataset lends itself exceptionally well to time-series cross-section analyses such as that undertaken here.Footnote 41
The main explanatory variable of interest is Voter Shift (t), which measures the difference in average Left–Right self-placements of voters in a given country between the year of the current election and the year of the previous election for either women, men or all voters. Data on these shifts come from the Eurobarometer surveys discussed above. Note that since party position data are only available for years with elections in a specific country, [Voter Shift (t)] also refers to election years only.
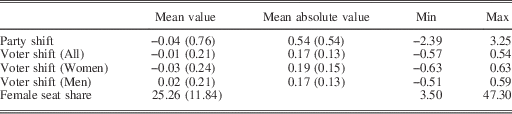
The analysis also includes another key explanatory variable – Female Seat Share (t) – which reports the seat share of female parliamentarians in a given country for a specific election year.Footnote 42 Information on the number of elected female parliamentarians in democracies around the world is provided by the Inter-Parliamentary Union (IPU).Footnote 43 For the years until 2010, these data were compiled by Armingeon et al. in the Comparative Political Data Set.Footnote 44 For the time after 2010, I collected the additional seat shares directly from the IPU website.Footnote 45 Finally, some models will include an interaction term [Voter Shift (t) × Female Seat Share (t)], which makes it possible to interpret the effect of different levels of descriptive representation of women in parliament on their substantive representation. Table 2 reports descriptive statistics of the main variables included in the analysis.
Descriptive Statistics: Dependent and Independent Variables

Note: N=351. All manifesto-based measures have been rescaled to the 1–10 scale used in the Eurobarometer surveys. The numbers in parentheses are the standard deviations of the reported values.
In the most basic specification, this allows for the estimation of the two following models to test Hypotheses 1–4:
 $$\eqalign{ {Basic\,model-{\rm Party}\,{\rm shift}\,\left( {\rm t} \right)} &\,{{\equals}\, {\rm \beta }_{{\rm 0}} {\plus}{\rm \beta }_{{\rm 1}} {\rm {\asterisk}}\left[ {{\rm Voter}\,{\rm shift}\,\left( {\rm t} \right)} \right]} \hfill \cr &{} \quad{{\plus}{\rm \beta }_{2} {\asterisk}\left[ {{\rm Party}\,{\rm shift}\,\left( {{\rm t}{\minus}1} \right)} \right]{\plus}{\rm e}} \hfill \cr {Interaction\,model-{\rm Party}\,{\rm shift}\,\left( {\rm t} \right)} &\,{{\equals}\,{\rm \beta }_{0} {\plus}{\rm \beta }_{1} {\rm {\asterisk}}\left[ {{\rm Voter}\,{\rm shift}\,\left( {\rm t} \right)} \right]} \hfill \cr &{} \quad{{\plus}{\rm \beta }_{2} {\rm {\asterisk}}\left[ {{\rm Female}\,{\rm seat}\,{\rm share}\,\left( {\rm t} \right)} \right]} \hfill \cr &{} \quad{{\plus}{\rm \beta }_{3} {\rm {\asterisk}}\left[ {{\rm Voter}\,{\rm shift}\,\left( {\rm t} \right){\times}{\rm Female}\,{\rm seat}\,{\rm share}\,\left( {\rm t} \right)} \right]} \qquad\qquad\qquad\cr &{} \quad{{\plus}{\rm \beta }_{4} {\rm {\asterisk}}\left[ {{\rm Party}\,{\rm shift}\,\left( {{\rm t}{\minus}1} \right)} \right]{\plus}{\rm e}} \hfill \cr } $$
Hypotheses 1 and 2: β1Men>β1Women>0
Hypothesis 3: β3>0; H4: β3=0
In other words, according to Hypotheses 1 and 2, the party responsiveness coefficients β1Men and β1Women should be positive, with β1Men>β1Women indicating a higher degree of responsiveness to preference shifts among men. If Hypothesis 3 is correct and parties are more responsive to women’s preferences as the female seat share increases, the interaction coefficient estimate β3 should be positive, while Hypothesis 4 would suggest no such conditioning effect.
The analysis focuses on the policy responsiveness of mainstream political parties only. Mainstream and niche parties are defined based on the party family classification in the Manifesto Project data. If a party is a member of the Communist, Green or Nationalist party family, it is regarded as a niche party; otherwise it is classified as a mainstream party. This is in line with previous research on party responsiveness, which has shown that mainstream parties react to shifts in the mean voter position, whereas niche parties are found to be more responsive to their specific party supporters.Footnote 46
Additionally, three EU-15 countries are excluded from the analysis: Belgium, Germany and Ireland. This is to meet the concerns raised by Huber, who shows citizens’ self-placements along the Left–Right scale to be a valid tool for cross-country comparison across Europe with the exception of those three countries.Footnote 47
RESULTS
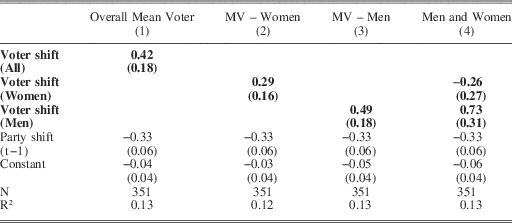
Table 3 reports the results from the basic model specification based on an analysis of 351 party shift observations by sixty-eight different parties competing in a total of eighty-two national elections across twelve countries in Western Europe. Column 1 presents the coefficient estimates for overall mean voter shifts, Column 2 refers to shifts in the average Left–Right self-placement of women, Column 3 reports the findings regarding parties’ responsiveness to changes in the preferences of men, and Column 4 reports the results when including the preference shifts of both women and men.Footnote 48 The Party Shift (t – 1) term is added for two reasons. First, it controls for the possibility of autocorrelation, and secondly, it reflects earlier studies by Budge and Adams, who find that parties have electoral incentives to shift their Left–Right position in the opposite direction of the shift between the last two elections.Footnote 49
Parties’ Responsiveness to Different Electorates, 1973–2012

Notes: The table reports estimated coefficients from an OLS regression and robust standard errors in parentheses. The outcome variable is the change in a party’s Left-Right position between the current election and the previous election. The definitions of the explanatory variables are given in the text.
As expected, the parameter estimate on Voter Shift is positive and significant for the first three specifications. This means that, by and large, parties are responsive to preference changes among women, men and the overall electorate, which is what Hypothesis 1 predicted. Substantively, the estimate in Column 2 means that if the average Left–Right self-placement of women in a given country shifts by one unit (either to the left or the right) between two elections, then parties do, on average, shift by 0.29 units in the same direction. Moreover, the estimates also show that parties are more responsive to preference changes among men than to those among women. For a one-unit change in the average Left–Right position of men, parties tend to shift half a unit in the same direction – the effect is almost twice as strong as that for women. Furthermore, when analyzing the responsiveness to both preference shifts in the same model (Column 4), the coefficient for women’s preferences loses statistical significance, whereas the effect becomes even stronger for men’s preferences.Footnote 50 This in turn supports Hypothesis 2, which states that parties are more responsive to Left-Right shifts among men than to those among women.Footnote 51 Finally, the coefficient for Party Shift (t−1) is negative and highly significant in all four columns, supporting the findings from Budge and Adams, who show that parties tend to alternate the direction of their policy shifts between elections.Footnote 52
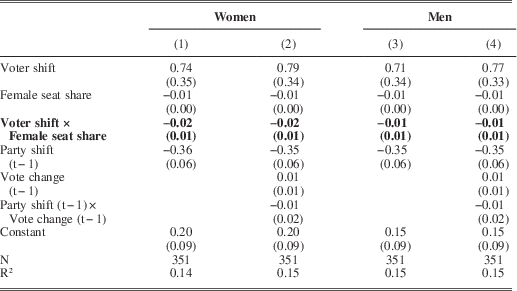
Table 4 reports results from the interaction model specification. Columns 1 and 3 present parameter estimates for a simple version of the interaction model, whereas Columns 2 and 4 present a slightly more sophisticated version. The latter specification includes additional control variables for past election results. More specifically, Vote Change (t − 1) reflects a party’s vote share wins or losses at the last election. The interaction term Party Shift (t − 1) × Vote Change (t − 1) reflects the findings of earlier studies that parties tend to shift their policy position in the same direction as they did at the last election if they managed to gain votes. If they lost votes at the last election, they are expected to shift in the opposite direction.Footnote 53
Party Responsiveness at Different Levels of Female Seat Share, 1973–2012

Note: The table reports estimated coefficients from an OLS regression and robust standard errors in parentheses. The outcome variable is the change in a party’s Left-Right position between the current election and the previous election. The definitions of the explanatory variables are given in the text.
Starting with Columns 1 and 3, two coefficient estimates are of particular importance. First, the Voter Shift x Female Seat Share interaction effect is very close to zero and statistically insignificant in both models, suggesting that the female seat share in parliament has no significant effect on party responsiveness to Left–Right shifts among women or men.Footnote 54 When moving to the more complex model in Columns 2 and 4, the same finding persists: the estimated coefficients for the interaction effect are statistically insignificant and virtually zero. Moreover, the additional variables are insignificant in these model specifications and have no considerable influence on either the vote shift parameter or the interaction effect. This provides support for Hypothesis 4, which states that descriptive representation of women in parliament does not directly enhance their substantive representation.
Secondly, the estimates for Voter Shift are again positive and significant for both women and men. While the effect size was much stronger for men in Table 3, the parameter estimates are now relatively similar for preference changes among both women and men. For a one-unit change in the average position of women along the Left–Right scale, parties are expected to move 0.74 units in the same direction. If men move by one unit, parties, on average, move 0.71 units in the same direction. However, due to the inclusion of an interaction term those interpretations are only correct when considering cases where the female seat share in parliament equals zero. Since all cases included in the study do feature at least one woman in parliament, those numbers become almost meaningless when viewed on their own. Instead, it is important to consider the effect of Voter Shift conditional on Female Seat Share.Footnote 55
This is where the interaction effect becomes important again. It is negative in all model specifications in Table 4, which suggests that as the female seat share in parliament increases, party responsiveness to women and men decreases, on average.Footnote 56 The estimates also suggest that it does so at a faster rate for women (the absolute size of the estimated interaction coefficient for women in Column 2 (−0.0217) is almost twice as large as that for men in Column 4 (−0.0132)), indicating that responsiveness towards women decreases twice as fast as that towards men as more women are elected to parliament.Footnote 57 Therefore, across the different values of female seat share, parties in general appear to be more responsive to preference shifts among men. In fact, the average marginal effect of preference shifts across all 351 observations is 0.439 for men, and only 0.239 for women. This provides additional support for Hypotheses 1 and 2: parties are responsive to preference shifts among both women and men in their electoral programs, but they are more responsive to men.
ROBUSTNESS
In addition to the model specifications and results presented above, I also ran a set of robustness checks (reported in the Appendix) that confirm the substantive findings of the main analysis. Most importantly, I address concerns regarding the Manifesto Project’s Left–Right measure of party positions. The main analysis relies on Manifesto data, because it provides an unparalleled scope of coverage both across countries and over time. However, these data are not free from criticism; chief among them is a long-standing debate surrounding measurement and scaling issues.Footnote 58 To account for this debate, a first set of robustness checks duplicates the previous analyses relying on the rescaled Manifesto Left–Right scores proposed by Lowe et al., which are based on the logarithm of odds ratios.Footnote 59 Results for those model specifications are reported in Tables A4–A5 and confirm the findings of the main analysis.
Moreover, the main analysis operationalizes female descriptive representation as the seat share of female parliamentarians in a given country for a specific election year. This aggregation to the legislative level could potentially mask significant interparty variation, which might bias the analysis towards the reported null result. Unfortunately, little party-level data exist. Table A7 replicates the main analysis using the most comprehensive available dataset of female seat shares at the party level (which has recently been collected by Greene and O’Brien).Footnote 60 The sample size decreases considerably, but the results confirm the findings discussed above.
One possible explanation of the main findings could be the idea of differential party response. More specifically, it could be argued that leftist parties might be more responsive to women and rightist parties more responsive to men. This seems especially likely given recent studies on conservative women, which show that the preferences of female supporters of right-wing parties are further to the left than those of male right-wing supporters and party elites.Footnote 61 To control for this possibility, I ran a separate set of analyses that split the sample into rightist and leftist parties, respectively. The results, presented in Tables A8–A11, suggest that neither rightist nor leftist parties are significantly more responsive to women’s preferences. As an additional check of the link between female descriptive and substantive representation, I ran a set of models that did not include an interaction term, but instead stratified the sample by female seat share in parliament. More specifically, I split the sample into two halves, where one includes all observations with a female seat share of less than the sample median (26.3 per cent), and the other includes all observations with a female seat share of at least 26.3 per cent. The results, presented in Tables A12–A13, support the substantive findings of the analysis including an interaction term.
The main models are also robust to controlling for different levels of socio-economic status. Tables A14–A15 present analyses for which I computed preference shifts separately for women and men who have an above-median income (education) and for those who do not. The results confirm the main findings: parties are more responsive to men and women with higher incomes (education) than their lower-income (lower-education) counterparts. However, even at high income (education) levels, they tend to be more responsive to men than to women. This in turn suggests that parties do not only condition their responsiveness on voters’ socio-economic status; they also exhibit an additional gender bias to the disadvantage of women. Moreover, Tables A16–A18 test whether parties have become more responsive to preference shifts among women over time. This could be due to a number of different factors such as the closing gender gap in education or the idea that parties might have become more aware of the demands of female voters. However, these models do not support the argument that parties have been more responsive to preference shifts among women in more recent years. Instead, parties seem to be more responsive to men throughout the period under study.
Finally, while those additional sets of analyses make changes to the models’ outcome and explanatory variables to address concerns about their measurement and validity, Tables A19–A20 report results from a number of robustness checks that make sensible alternations to the main model discussed above. These changes take into account alternative and commonly used explanations of party movements along the Left–Right dimension over time such as the possibility of systematic party policy moderation over time or niche party-specific effects, while also including party- and country-specific fixed effects. The results in both tables provide additional support for the main findings.
In short, the findings discussed in the previous section are robust to a number of alternative model specifications. Even when meeting concerns about the Manifesto Left–Right estimates, when focusing the analysis more strongly at the party level, when accounting for socio-economic differences among respondents, allowing for time effects or when controlling for additional popular explanations of party movements, the findings reported above hold up. Parties are responsive to the mean voter positions of both women and men, they are slightly more responsive to preference shifts among men, and the responsiveness to women’s preferences does not seem to depend on the female seat share in parliament. In other words, the analyses do not provide any support for the often-assumed link between the substantive and descriptive representation of women in parliament when focusing on Left–Right positioning as a form of substantive representation.
DISCUSSION AND CONCLUSION
The results of this study indicate that parties are not equally responsive to preference shifts among women and men. Moreover, while most studies on the representation of women implicitly assume that an increase in the number of women in parliament will also improve the quality of female representation, my results do not support this conclusion. Parties follow the preference shifts of women and men, but they are more responsive to men’s preferences. The seat share of women in national parliaments does not condition this finding.
The reason is that in multiparty parliamentary democracies, political parties – not individuals – are the focal point for how citizen preferences are expressed.Footnote 62 Parties’ general responsiveness to voter preferences might therefore be best understood as being driven by parties as a whole, instead of individual female or male MPs, who in most cases are bound to the party line. Party discipline and party cohesion take precedence over the personal preferences of single parliamentarians. Gate-keeping and socialization also explain why parties in countries with more female parliamentarians do not respond to women’s preferences any better than those with fewer female parliamentarians. Politicians who are responsible for candidate recruitment influence the number of female candidates who run for office.Footnote 63 Women are rarely found in these gate-keeping positions, further hindering their chances of gaining more powerful positions within parties, which therefore has a stronger effect on the political agenda.
This suggests a number of interesting questions for possible future research. First, a stronger focus on party-specific characteristics such as the proportion of women in leadership roles within parties could improve our understanding of the link between the descriptive and substantive representation of women.Footnote 64 For example, women who are (shadow) cabinet members, prime ministers or part of a party’s manifesto-drafting team can be expected to have a much stronger influence on a party’s agenda than other parliamentarians. Therefore, while a higher number of women in parliament per se might not lead to better substantive representation of women, a higher proportion of women in political leadership roles might very well do so. Alternatively, one might also explore the relationship with specific attention to ‘free votes’, in which parties take no (or only little) interest and where no strict party line is enforced. While the number of such votes is very limited, differences between female and male parliamentarians might be more likely to emerge. Finally, this study’s focus on the Left–Right dimension presents only one possible way of analyzing the link between descriptive and substantive representation of women in parliament. Future research could also focus on women’s issues specifically and how they are being treated differently by parliaments with different shares of female politicians.
By showing parties to be more responsive to preference shifts among men than women, and by finding no evidence that the seat share of women in parliament conditions this effect, the results presented here warrant further analysis of the quality of substantive representation of women, and call into question the existence of a straightforward link between the descriptive and substantive representation of women.