


Introduction
Voting is a two-step process in the United States, requiring voters to first register to vote and then cast their ballot.Footnote 1 Further, US states differ greatly in their registration and voting procedures (Pomante II, Schraufnagel, and Li Reference Pomante, Schraufnagel and Li2023). As such, scholars are increasingly interested in state-level variation in registration and voting (Burden et al. Reference Burden, Canon, Mayer and Moynihan2014; Juelich and Coll Reference Juelich and Coll2020). To this end, recent research has created latent scales of the combined costs of registering and voting by state, such as the Cost of Voting Index (COVI; Pomante II, Schraufnagel, and Li Reference Pomante, Schraufnagel and Li2023). However, doing so masks heterogeneity within each policy domain and their effects, particularly given registration and voting costs may have differential effects (Rigby and Springer Reference Rigby and Springer2011). Further, evidence of policy stability in any combined index may mask counterbalancing shifts in the costs of voting and registration within a state. As such, generating distinct indices for both steps can provide a more accurate and nuanced understanding of state voting laws, while also allowing scholars to test for differential effects of each policy domain, as well as for differential effects of each domain among different groups of voters. Yet, indices measuring registration and voting costs separately on the same scale do not exist.
To fill this gap, we decompose the COVI into separate measures of registration and ballot-casting costs (BCC). In doing so, we (1) demonstrate the multidimensionality of the COVI, (2) create a four-category typology of state-level election access ecosystems, and (3) demonstrate the value of these measures through brief examinations of frequently studied research questions. By disentangling registration and ballot-casting policies, this approach distinguishes each policy arena, allowing scholars to examine key theoretical debates about where institutional barriers matter most. These scores can be applied to a variety of research questions, including voter turnout, citizen confidence in elections, and beyond.
Movements toward comprehensive measures of election access
Recent years have seen a proliferation of election policy reforms, creating complex registration and voting systems across and within states (Jansa, Motta, and Herrick Reference Jansa, Motta and Herrick2022; Merivaki Reference Merivaki2020; Pomante II, Schraufnagel, and Li Reference Pomante, Schraufnagel and Li2023; Ritter and Tolbert Reference Ritter and Tolbert2024). Scholars have sought to examine the causes and consequences of these policy changes. A popular approach to examining election policies is to examine one or a few specific reforms in isolation (Biggers and Hanmer Reference Biggers and Hanmer2017; Bowler and Donovan Reference Bowler and Donovan2016; Burden et al. Reference Burden, Canon, Mayer and Moynihan2014). While single-reform studies have advanced our understanding of state-level election policies, examining individual policies does not adequately consider the multiplicative effect of other state election policies. Election policies do not exist in a vacuum, nor do their effects; instead, election policies interact and their effects compound (Burden et al. Reference Burden, Canon, Mayer and Moynihan2014; Pomante II, Schraufnagel, and Li Reference Pomante, Schraufnagel and Li2023).
With this in mind, scholars have attempted to measure a state’s cumulative election policy ecosystem through measures like the COVI (Pomante II, Schraufnagel, and Li Reference Pomante, Schraufnagel and Li2023).Footnote 2 The COVI uses principal component analysis (PCA) to combine information on registration and voting policies into a single measure of the “costs of voting” in each state, where greater values denote greater costs. The COVI is a widely used measure of election access and has been used to examine various topics from voter turnout (Juelich and Coll Reference Juelich and Coll2020) to perceptions of election integrity (Atkeson, McKown-Dawson, and Stein Reference Atkeson, McKown-Dawson and Stein2024; Coll Reference Coll2024). However, one limitation of the COVI is that it is constrained as a unidimensional index that combines registration and voting policies into a single measure, limiting examination of the relative impact of registration and voting policies, masking heterogeneity within each domain across states and time, while also assuming both sets of policies load onto a single dimension. To confront these assumptions, we disaggregate the COVI into two indices, one measuring the costs of registration and the other measuring the costs of voting.
Decomposing the Cost of Voting Index: Voter registration costs and ballot-casting costs
To decompose the COVI, we follow a similar methodology as used for the COVI, but separate registration and voting policies into measures of voter registration costs (VRC) and ballot casting costs (BCC), respectively. Tables 1 and 2 outline the 55 laws and policies used in the 2024 index, delineated by the step of the voting process they address. See Section B of the Supplementary Material for definitions of key terms. As with the COVI, we use PCA to construct our measures,Footnote 3 with these criteria weighted and combined at each stage of the voting process, and each state’s VRC and BCC scores reflecting a combination of these weighted factor scores. However, because each election year consists of a different number of laws and policies, the factor scores are not comparable between elections.
Voter registration cost indicators

Table 1. Long description
The table is organized into five issue areas.
Issue area 1, Registration deadline, includes the number of days before the election a voter must be registered.
Issue area 2, Voter registration restrictions, lists nine indicators: same-day registration not allowed for all elections, same-day registration not located at polling station, mental competency requirements, no online registration, same-day registration not allowed for presidential elections, felons barred from registering while incarcerated, felons barred after incarceration, online registration deadlines greater than the median, and additional document requirements beyond the federal minimum.
Issue area 3, Registration drive restrictions, lists five indicators: official group certification, state-mandated training, document submission requirements, penalties for rule violations, and total prohibition of registration drives.
Issue area 4, Preregistration, lists seven indicators regarding age thresholds: 16-year-olds, 17-year-olds, 17.5-year-olds, 90 days before 18th birthday, 60 days before 18th birthday, 16-year-old policy with no legal basis, and no state law discussing preregistration.
Issue area 5, Automatic voter registration, lists four indicators: back-end A V R opt-out, automatic registration at more than one state agency, automatic registration at D M V only, and no automatic voter registration.
Ballot-casting cost indicators
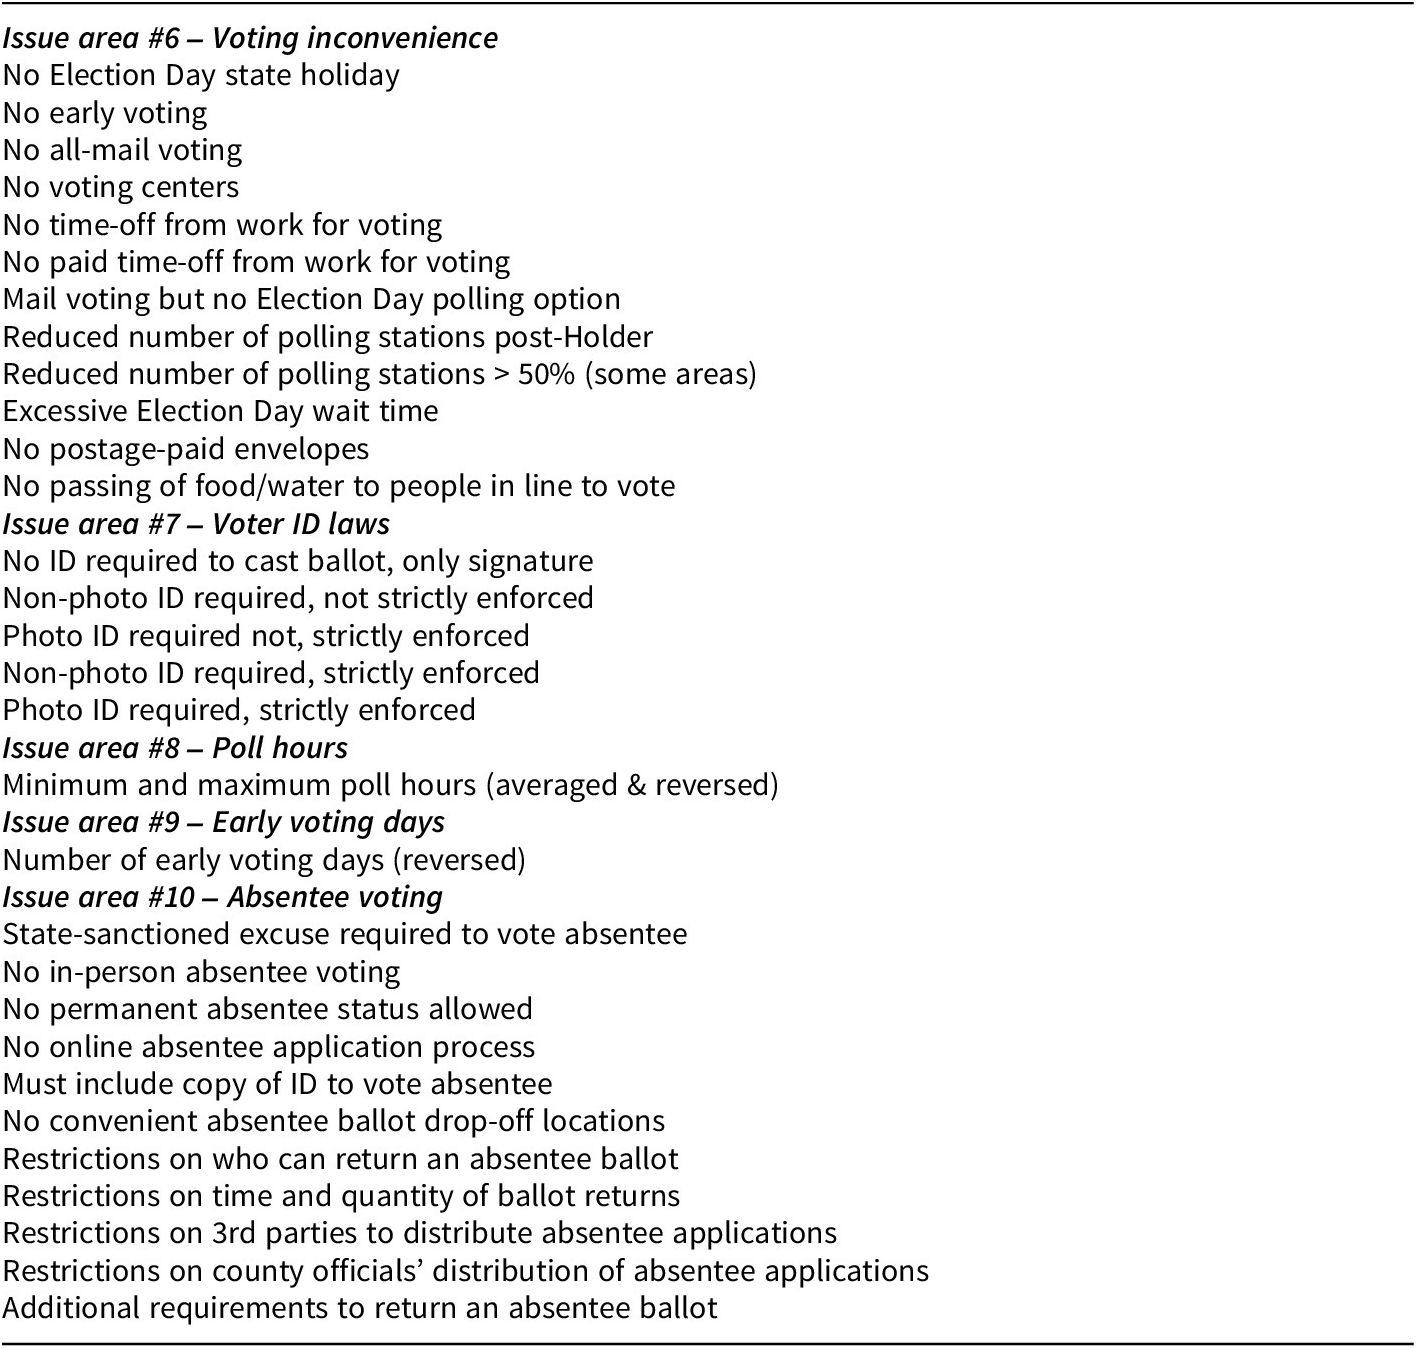
Table 2. Long description
The table is organized into five thematic issue areas.
Issue area number 6, Voting inconvenience, includes indicators such as: No Election Day state holiday, No early voting, No all-mail voting, No voting centers, No time-off from work for voting, No paid time-off from work for voting, Mail voting but no Election Day polling option, Reduced number of polling stations post-Holder, Reduced number of polling stations greater than 50 percent in some areas, Excessive Election Day wait time, No postage-paid envelopes, and No passing of food or water to people in line to vote.
Issue area number 7, Voter I D laws, lists: No I D required to cast ballot, only signature; Non-photo I D required, not strictly enforced; Photo I D required, not strictly enforced; Non-photo I D required, strictly enforced; and Photo I D required, strictly enforced.
Issue area number 8, Poll hours, includes: Minimum and maximum poll hours (averaged and reversed).
Issue area number 9, Early voting days, includes: Number of early voting days (reversed).
Issue area number 10, Absentee voting, includes: State-sanctioned excuse required to vote absentee, No in-person absentee voting, No permanent absentee status allowed, No online absentee application process, Must include copy of I D to vote absentee, No convenient absentee ballot drop-off locations, and Restrictions on who can return an absentee ballot.
See Section B of the Supplementary Material for policy definitions.
The two indices capture the voter registration costs (VRC) and the ballot casting costs (BCC), with higher values representing greater costs. For the VRC, we conceptualize states with lower scores as having more passive registration policies where individuals can register with minimal effort (e.g., automatic registration). States with higher values have more active registration policies that require citizens to take more deliberate steps (e.g., registering in-person and weeks before Election Day). For BCC, states with lower values have more convenient ballot-casting policies (e.g., all-mail voting). States with higher values have more inconvenient voting practices that impose additional barriers (e.g., allowing only one voting day).Footnote 4
Table 3 shows VRC and BCC scores for each state in 2024, where higher values denote greater inconvenience (see Figure A4 in the Supplementary Material for state rankings). Providing face validity,Footnote 5 we find states that are typically thought of as having more (less) restrictive election access are often found among the more (less) restrictively ranked VRC and BCC states. Arkansas, Kentucky, Mississippi, South Carolina, Tennessee, and Texas all rank within the top 10 most restrictive VRC states, while Massachusetts, Maine, Minnesota, and North Dakota (which has no registration) are in the top 10 least restrictive registration states. Examining BCC, states like Alabama, Arkansas, Mississippi, Missouri, and South Carolina top the list of the most restrictive, while California, Colorado, Oregon, Washington, and Utah (states with all-mail voting) are easier to cast a ballot in.
Voter registration cost (VRC) and ballot-casting cost (BCC) by state (2024)
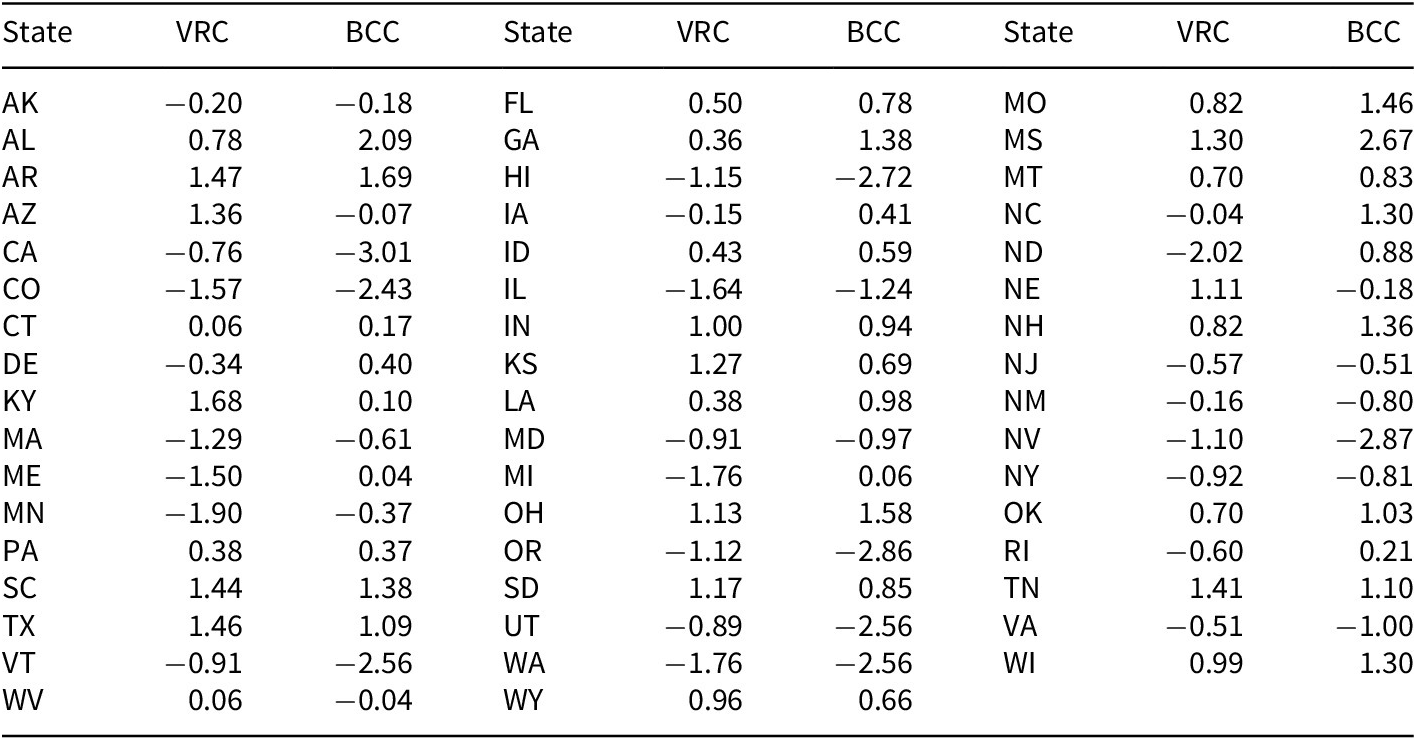
Table 3. Long description
The table presents V R C (Voter Registration Cost) and B C C (Ballot-Casting Cost) values for 50 states.
Section 1 (Left):
- AK: V R C -0.20, B C C -0.18
- AL: V R C 0.78, B C C 2.09
- AR: V R C 1.47, B C C 1.69
- AZ: V R C 1.36, B C C -0.07
- CA: V R C -0.76, B C C -3.01
- CO: V R C -1.57, B C C -2.43
- CT: V R C 0.06, B C C 0.17
- DE: V R C -0.34, B C C 0.40
- KY: V R C 1.68, B C C 0.10
- MA: V R C -1.29, B C C -0.61
- ME: V R C -1.50, B C C 0.04
- MN: V R C -1.90, B C C -0.37
- PA: V R C 0.38, B C C 0.37
- SC: V R C 1.44, B C C 1.38
- TX: V R C 1.46, B C C 1.09
- VT: V R C -0.91, B C C -2.56
- WV: V R C 0.06, B C C -0.04
Section 2 (Middle):
- FL: V R C 0.50, B C C 0.78
- GA: V R C 0.36, B C C 1.38
- HI: V R C -1.15, B C C -2.72
- IA: V R C -0.15, B C C 0.41
- ID: V R C 0.43, B C C 0.59
- IL: V R C -1.64, B C C -1.24
- IN: V R C 1.00, B C C 0.94
- KS: V R C 1.27, B C C 0.69
- LA: V R C 0.38, B C C 0.98
- MD: V R C -0.91, B C C -0.97
- MI: V R C -1.76, B C C 0.06
- OH: V R C 1.13, B C C 1.58
- OR: V R C -1.12, B C C -2.86
- SD: V R C 1.17, B C C 0.85
- UT: V R C -0.89, B C C -2.56
- WA: V R C -1.76, B C C -2.56
- WY: V R C 0.96, B C C 0.66
Section 3 (Right):
- MO: V R C 0.82, B C C 1.46
- MS: V R C 1.30, B C C 2.67
- MT: V R C 0.70, B C C 0.83
- NC: V R C -0.04, B C C 1.30
- ND: V R C -2.02, B C C 0.88
- NE: V R C 1.11, B C C -0.18
- NH: V R C 0.82, B C C 1.36
- NJ: V R C -0.57, B C C -0.51
- NM: V R C -0.16, B C C -0.80
- NV: V R C -1.10, B C C -2.87
- NY: V R C -0.92, B C C -0.81
- OK: V R C 0.70, B C C 1.03
- RI: V R C -0.60, B C C 0.21
- TN: V R C 1.41, B C C 1.10
- VA: V R C -0.51, B C C -1.00
- WI: V R C 0.99, B C C 1.30
We also plot states over time according to their relative ranking to examine changes in restrictiveness (states with identical scores are ranked identically). Examining registration costs (Figure 1a), we see greater similarity across states in early years. Highlighting two states with considerable changes over time, Wisconsin and Washington, Wisconsin went from being one of the most passive registration states pre-2000 to being one of the most active in recent years, while Washington witnessed the opposite trend. We also plot North Dakota, which has no registration and, as such, is consistently the easiest state via the VRC. Turning to BCC, we see much more variation, both within and across years (Figure 1b). Plotting two states with different ballot-casting policy histories, Missouri and Hawaii, reveals that the former went from a convenient state before 2000 to inconvenient by 2024, while the latter experienced the opposite.
Voter registration cost rankings over time. (a) Voter registration costs. (b) Ballot-casting cost rankings over time.

Figure 1. Long description
The image contains two vertically stacked line graphs.
Top graph (a) Voter Registration Costs. The x-axis represents Year from 1996 to 2024 in 4-year increments. The y-axis represents V R C Rank from 0 to 50. A dense web of light gray lines shows the rankings of various states over time. Three lines are highlighted in black with labels at the right margin. N D remains constant at a rank of 1. W A starts at rank 3, peaks at rank 7 in 2008, and drops to rank 3 by 2024. W I starts at rank 41, drops to rank 25 in 2004, rises to rank 33 in 2008, plateaus at rank 22 between 2012 and 2016, and ends at rank 38 in 2024.
Bottom graph (b) Ballot Casting Cost Rankings Over Time. The x-axis represents Year from 1996 to 2024. The y-axis represents B C C Rank from 0 to 50. Similar to the first graph, many light gray lines show state fluctuations. Two lines are highlighted in black. H I starts at rank 5, rises to rank 42 in 2004, drops to rank 25 in 2012, and ends at rank 4 in 2024. M O starts at rank 50, drops to rank 27 in 2004, rises to rank 46 in 2008, and after several fluctuations, ends at rank 46 in 2024.
Next, we map states by both measures simultaneously, creating a typology of election access ecosystems. Figure 2 plots each state based on its VRC (Y-axis) and BCC (X-axis) scores for 2000 (Figure 2a), 2008 (Figure 2b), 2016 (Figure 2c), and 2024 (Figure 2d). States in the bottom left quadrant of each graph have passive registration and convenient voting policies (□). The bottom right quadrant houses states with passive registration but less convenient voting (△). The top left has active registration but convenient voting (♢), and the top right has active registration and inconvenient voting (o). Using these quadrants, we can classify states based on the relative access of their registration and voting policies, while the COVI (and other existing measures) can only classify based on a single axis. Doing so provides a typology for understanding state election policy restrictiveness.
A typology of state election environments by voter registration and ballot-casting costs. (a) 2000, (b) 2008, (c) 2016, and (d) 2024.
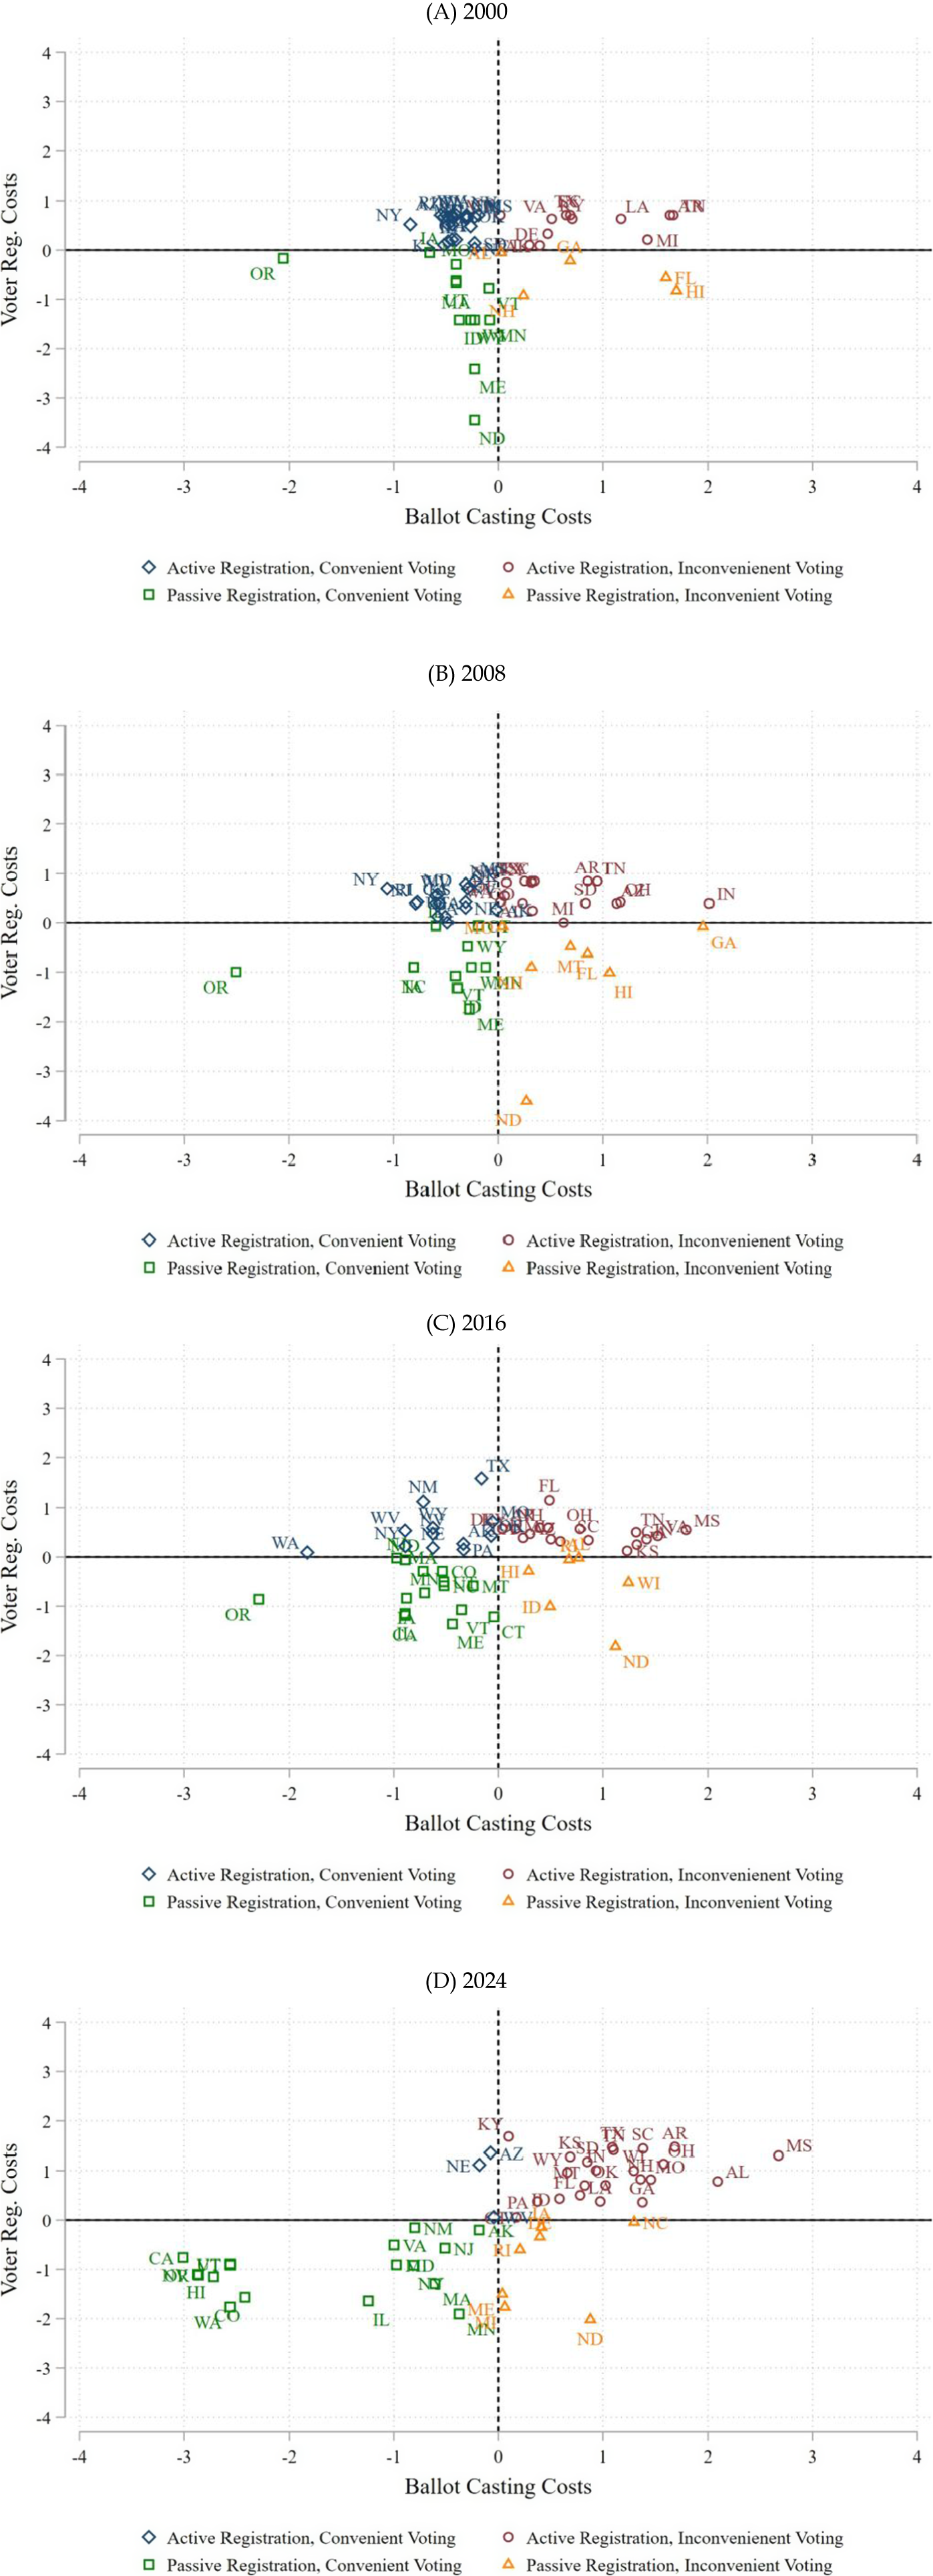
Figure 2. Long description
A four-panel scatter plot series labeled A 2000, B 2008, C 2016, and D 2024. Each plot uses a horizontal x-axis for Ballot Casting Costs and a vertical y-axis for Voter Reg. Costs, both ranging from negative 4 to positive 4. The plots are divided into four quadrants by dashed lines at zero. Data points are categorized into four types. Blue diamonds represent Active Registration, Convenient Voting. Red circles represent Active Registration, Inconvenient Voting. Green squares represent Passive Registration, Convenient Voting. Orange triangles represent Passive Registration, Inconvenient Voting.
* In panel A 2000, most states are clustered near the center. A few outliers like O R are in the bottom-left quadrant, while states like F L and H I are in the bottom-right.
* In panel B 2008, there is a slight expansion. O R remains in the bottom-left. More states begin to move into the bottom-left and bottom-right quadrants.
* In panel C 2016, the distribution spreads further horizontally. W A and O R are far left in the bottom-left quadrant. N D is an outlier in the bottom-right.
* In panel D 2024, a significant shift occurs. A large cluster of green squares including C A, U T, and W A has moved deep into the bottom-left quadrant, indicating lower costs for both registration and ballot casting. Red circles representing higher costs are concentrated in the top-right quadrant, including states like M S and A L.
Interestingly, by 2024 state election policy ecosystems have become more aligned across both registration and voting costs (i.e., fewer ♢ and △ states, more □ and o states). Averaging across all years, there is a moderate and significant correlation between VRC and BCC scores (0.28, p
$ \le $
 0.0001). However, this masks considerable change across time. Before 2020,Footnote
6 there was no significant correlation between VRC and BCC scores. Yet, since 2004, the correlation between the two strengthened. By 2020, the correlation rose to a significant r = 0.49 (p = 0.0003), then r = 0.68 (p
$ \le $
 0.0001) in 2024. Over time, many states have sorted into relatively consistent (in)convenient registration and voting election systems.Footnote
7 Future research should examine the causes and consequences of this cross-election policy domain convergence.
Comparing COVI scores to VRC and BCC scores
Next, we contrast COVI and VRC/BCC scores to further demonstrate the added nuance provided by the updated scores.Footnote 8 Figure 3 takes four states in 2024 (Delaware [DE], Nebraska [NE], New Mexico [NM], and Rhode Island [RI]) with similar COVI scores (all within roughly 1/3rd standard deviation from the mean and 2/3rd standard deviation from each other), plots their position on the unidimensional COVI (blue circles mapped on the diagonal blue line), then plots their position given their VRC and BCC scores (red diamonds mapped by the red vertical and horizontal lines), and identifies the change in position (➔).
Change, COVI to VRC and BCC.

Figure 3. Long description
A scatter plot with a horizontal x-axis labeled Ballot Casting Costs and a vertical y-axis labeled Voter Registration Costs. Both axes range from -1.00 to 1.00. A dashed diagonal line bisects the graph from the bottom-left to the top-right. Red dashed lines mark the zero-intercepts for both axes. Blue circular dots represent C O V I placements, while red diamond shapes represent V R C and B C C placements. Black arrows indicate the change between these two states for four labeled regions.
* N M: A blue dot at approximately x equals -0.35, y equals -0.35 shifts left and slightly up to a red diamond at x equals -0.80, y equals -0.15.
* R I: A blue dot at approximately x equals -0.20, y equals -0.20 shifts right and down to a red diamond at x equals 0.20, y equals -0.60.
* D E: A blue dot at approximately x equals 0.40, y equals 0.40 shifts vertically down to a red diamond at x equals 0.40, y equals -0.35.
* N E: A blue dot at approximately x equals 0.50, y equals 0.50 shifts left and up to a red diamond at x equals -0.15, y equals 1.10.
Although these states have similar COVI scores, they fall in very different positions when we decompose the COVI. Nebraska, identified as the hardest-to-vote state of the four via the COVI, has a relatively low BCC but high VRC. The second most difficult state, Delaware, may be difficult to cast a ballot in, but has permissive registration. Rhode Island, ranked second most permissive by the COVI, makes registration easy but has more voting hurdles. New Mexico, identified by COVI as the most permissive, has passive registration and convenient ballot-casting. While these states are coded nearly identically by COVI, they occupy different areas based on their combined VRC and BCC scores, and these differences shed greater nuance as to the sources of voter difficulty in these states.
Applications
We briefly demonstrate three applications of the VRC and BCC scores above and beyond the added nuance of measuring and classifying election systems discussed above. These applications are examining voter turnout, policy determinants, and public opinion. For brevity, we present correlational analyses below to demonstrate applications, leaving more rigorous analyses for future studies.
First is the canonical participatory examination: do electoral laws affect voter turnout?Footnote
9 In line with prior work suggesting registration costs present the greater barrier (Powell Reference Powell1986), we find a moderately strong, negative, and significant correlation between VRC and voter turnout (r = −0.35, p
$ \le $
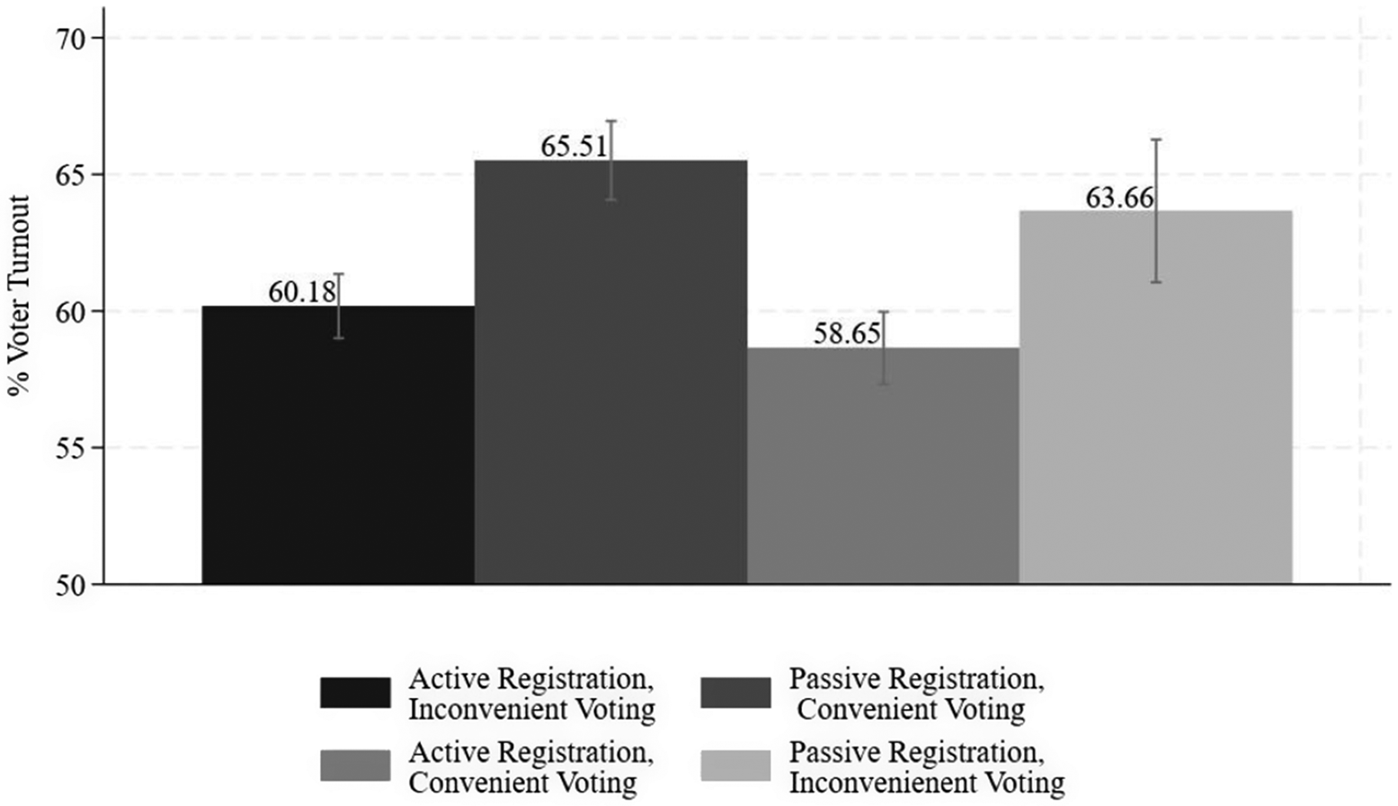
 0.0001), but a weaker correlation between BCC and voter turnout (r = −0.17, p = 0.0029). Turning to Figure 4, we further see that registration costs are more closely tied to voter turnout, as states with passive registration (bars 2 and 4) have higher turnout, regardless of BCC. While it is beyond the scope of this article to causally tie these costs to voter turnout, these results provide correlational evidence that VRC and BCC may reduce voter turnout but to differing extents, relationships ripe for future investigation.
Voter registration costs, ballot-casting costs, and voter turnout.

Figure 4. Long description
The Y axis is labeled percent Voter Turnout and ranges from 50 to 70 in increments of 5. The X axis contains four adjacent bars of different shades of gray.
* The first bar on the left is black and represents Active Registration, Inconvenient Voting with a value of 60.18.
* The second bar is dark gray and represents Active Registration, Convenient Voting with a value of 65.51.
* The third bar is medium gray and represents Passive Registration, Convenient Voting with a value of 58.65.
* The fourth bar is light gray and represents Passive Registration, Inconvenient Voting with a value of 63.66.
Each bar includes a vertical error bar at the top. The highest turnout is associated with Active Registration and Convenient Voting, while the lowest is associated with Passive Registration and Convenient Voting.
Second, scholars are often concerned with state policy ecosystems (e.g., public policy scores) (Caughey and Warshaw Reference Caughey and Warshaw2016), including understanding the structure, changes, and determinants of those ecosystems. We have already used the VRC and BCC scores to measure the structure of election systems (e.g., Table 3), created a typology of state election systems (Figure 2), and discussed how they have changed over time (Figure 1), but we can also examine the correlates of those changes. For example, whether government partisanship predicts voter registration and ballot-casting costs, as often found in studies examining individual policies (Biggers and Hanmer Reference Biggers and Hanmer2017). We correlated each state’s VRC and BCC scores with a lagged measure of partisan government control (percent Democrat in state legislature).Footnote
10 Interestingly, we find partisan control is not statistically correlated with VRC scores (r = −0.05, p = 0.4380), but that government partisanship is correlated with BCC scores (r = −0.31, p
$ \le $
 0.0001). These results suggest partisanship may affect registration policy adoption differently than voting policy adoption, a finding not identifiable using existing measures and worthy of additional investigation.
Last, we test for public opinion effects. Conventional wisdom argues restricting voter access increases confidence, as individuals view elections as more secure, while more recent work argues the effects are conditional, increasing confidence for some (e.g., Republicans and white Americans) while decreasing it for others (e.g., Democrats and non-white Americans) (Bowler and Donovan Reference Bowler and Donovan2016; Coll Reference Coll2024). Merging the VRC and BCC scores with confidence in state vote counts,Footnote
11 we find, among the full sample, registration difficulty is negatively correlated with confidence (r = −0.03, p
$ \le $
 0.0001) but ballot-casting costs are not significantly tied to confidence (r = 0.002, p = 0.7438). These results suggest registration costs weigh more heavily on election integrity considerations.
At the same time, these correlations mask partisan patterns. VRC and BCC are significantly and negatively related to confidence among Democrats (VRC: r = −0.11, p
$ \le $
 0.0001; BCC: r = −0.08, p
$ \le $
 0.0001) but significantly and positively related to confidence for Republicans (VRC: r = 0.09, p
$ \le $
 0.0001; BCC: r = 0.12, p
$ \le $
 0.0001). These patterns are shown starkly in Figure 5, which demonstrates little differences in confidence among all respondents (Figure 5a), Democrats more (less) confident in states with lower (greater) registration and voting costs (Figure 5b), and Republicans much more confident in states with both high registration and high voting costs (Figure 5c).
Voter registration costs, ballot-casting costs, and voter confidence. (a) Full sample. (b) Democrats. (c) Republicans.
Source: Survey of the Performance of American Elections (2012–2024). 95% confidence intervals shown.

Figure 5. Long description
Three vertical bar charts arranged in a column. Each chart shares the same Y-axis labeled percent Very Confident in State Vote Counts, ranging from point 25 to point 75. The X-axis represents four categories of voting systems.
Panel a, Full Sample. The bars show relatively uniform confidence levels. Active Registration, Inconvenient Voting is point 53. Active Registration, Convenient Voting is point 55. Passive Registration, Convenient Voting is point 52. Passive Registration, Inconvenient Voting is point 55.
Panel b, Democrats. Confidence is higher overall compared to the full sample. Active Registration, Inconvenient Voting is point 56. Active Registration, Convenient Voting is point 69. Passive Registration, Convenient Voting is point 62. Passive Registration, Inconvenient Voting is point 69.
Panel c, Republicans. Confidence is lower overall compared to the full sample. Active Registration, Inconvenient Voting is point 51. Active Registration, Convenient Voting is point 36. Passive Registration, Convenient Voting is point 40. Passive Registration, Inconvenient Voting is point 37.
All bars include small vertical error bars representing 95 percent confidence intervals.
Future steps
The VRC and BCC measures developed here offer several concrete avenues for future research. First, scholars should reexamine the correlations provided above through causal inference frameworks. Second, the analyses on registration and turnout should be extended to examine differential effects on specific political and demographic groups. Third, if there are differential effects, are these differential effects large enough to alter election outcomes? Fourth, scholars can examine whether these policies affect public opinion, including perceptions of registration and voting ease. Fifth, to what extent are these effects conditional, such as on the quality of election administration and voter mobilization? Sixth, do these policies affect election administration, such as through wait times and provisional voting? Seventh, future scholars should examine the value of a sub-state measure. Lastly, the purpose of this paper was to decompose the existing COVI measure, which included both direct and indirect costs (e.g., mail voting versus third-party voter registration drives). Future research should reexamine the COVI, VRC, and BCC scores, separating direct and indirect costs.
Supplementary material
The supplementary material for this article can be found at http://doi.org/10.1017/spq.2026.10033.
Data availability statement
Replication materials are available on SPPQ Dataverse at https://dataverse.harvard.edu/dataset.xhtml?persistentId=doi:10.7910/DVN/ELZ5RTfaces-redirect=true (Pomante et al. 2026).
Funding statement
The authors received no financial support for the research, authorship, and/or publication of this article.
Competing interests
The authors declared no potential competing interests with respect to the research, authorship, and/or publication of this article.
Author biographies
Michael J. Pomante II is a Lecturer at the University of Michigan and a Research Fellow at Claremont Graduate University. His research focuses on election policy, voter access, and the Cost of Voting Index.
Joseph A. Coll is an Assistant Professor of Political Science at Texas Tech University. His work examines electoral access, integrity, and backsliding in the United States.
Scott J. LaCombe is an Assistant Professor at the Truman School of Government and Public Affairs and Kinder Institute on Constitutional Democracy at the University of Missouri. His research focuses on policy responsiveness, policy diffusion, and direct democracy in the American states.






 Open access

