Introduction
Donations to charities working for overseas causes are an important source of funding of development assistance from rich industrialised countries. In the UK, charities focusing on overseas development and emergency relief that are among the top 500 fundraisers received nearly £1bn in donations and legacies in 2004–5. This is well short of the £4bn that is spent by the UK government in official development assistance (ODA), but the public appears to allot greater importance to the charities' work.Footnote 1 Two-thirds of UK adults believe that international charities make a ‘major contribution’ to the reduction of poverty in developing countries while less than a fifth view the governments of rich countries in the same light (O'Brien, Reference O'Brien2004: 49).
Surprisingly, in view of their actual and perceived importance, relatively little is known about the pattern or determinants of charitable donations to development causes. There are large empirical and theoretical literatures on charitable giving but they focus on total donations, and in general do not identify separately giving by cause. Donations to overseas charities made up only about a fifth of all donations to the top 500 fundraising charities in the UK in 2004–5. The motives to give for human welfare in poor countries may differ in a variety of ways from those that drive giving to domestic causes such as animal welfare, health or the arts (Micklewright and Wright, Reference Micklewright, Wright and Atkinson2004; Atkinson, Reference Atkinson2008).
An increase in charitable giving to further overseas development would help fund the attainment of the Millennium Development Goals, to which the world's nations are committed. This would be alongside other methods of finance discussed in Atkinson (Reference Atkinson2004). As this illustrates, private philanthropy has an important role to play in the delivery of social policy. Social policy, viewed as a discipline, has paid mixed attention to charitable giving. (There are many contributions to the literatures referred to above from within economics, summarised in Andreoni, Reference Andreoni, Gerard-Varet, Kolm and Ythier2006 and Vesterlund, Reference Vesterlund, Powell and Steinberg2006.) Richard Titmuss's classic work on blood donation (Reference Titmuss1970) is a notable example. Like Titmuss, we focus in this article on just one part of charitable giving: gifts of money to help those in need in poor countries.
If charitable donations are to contribute to the funding of progress towards the Millennium Development Goals, then more information is needed about their determinants. We need to know whether and how giving to development differs from giving to other causes, and how, for example, overseas giving varies with income. In this article, we investigate giving using UK survey microdata that do record individuals' donations to different types of charity. We aim to discover stylised facts about giving to overseas development, showing ways in which overseas giving resembles giving to other causes and ways in which it differs. In doing so, we provide new information on patterns of giving to all causes.Footnote 2
We begin by describing the data and by summarising some of the problems in measuring charitable giving. The data are drawn from several rounds of the ONS Omnibus Survey. The next section documents how common is giving to development and the amounts given, contrasting the situation with giving to other, or ‘domestic’, causes, and exploring the differences by gender, marital status, occupation and education. We also investigate whether giving to overseas and domestic causes tend to go together, or whether people making overseas donations are a quite separate group.
The section that follows compares people's attitudes to poverty in developing countries and its relief with their actual giving to overseas causes. Are those who do not give unconcerned about the plight of poor countries or do they show their concern in ways other than charitable giving?
The last substantive section of the article investigates the relationship of giving to overseas and to domestic causes with personal income. Do those on higher incomes give a greater share of their income to charity or is giving regressive, with the shares being higher for those on lower incomes? And how does the picture differ for overseas giving? The final section concludes, summarising similarities and differences between giving for overseas causes and for domestic causes.
Data on charitable giving by cause
Empirical research into the pattern and correlates of giving by cause has been hampered by a lack of survey data that distinguish different charitable causes. In the UK, the annual ONS Expenditure and Food Survey (EFS) and its forerunner the Family Expenditure Survey (FES) have long collected data on charitable giving. These have been used to good effect (for example, Jones and Posnett, Reference Jones and Posnett1991; Banks and Tanner, Reference Banks and Tanner1997; Pharoah and Tanner, Reference Pharaoh and Tanner1997). But the survey does not identify the types of charities to which the gifts are made.Footnote 3
Our research uses data from another ONS survey, the monthly Omnibus, which does collect information on donations by cause. Starting in 2004/5, the Charities Aid Foundation (CAF) and the National Council for Voluntary Organisations (NCVO) have sponsored a module of questions on giving that has been included in the survey three times a year (CAF and NCVO, 2005, 2006, 2007). The Omnibus survey has a conventional multi-stage random probability design.Footnote 4 One adult (defined as age 16 or over) is selected at random in each sampled household. Interviewing is face-to-face. The response rate is typically around 65 per cent, which is reasonable by the standards of other ONS surveys, for example the EFS. We pool data for the six survey rounds in which the CAF/NCVO module was included in the survey in the April–March tax years 2004/5 and 2005/6: July (2004), June (2005), October and February (both tax years). This provides a sample of 9,050 individuals.Footnote 5
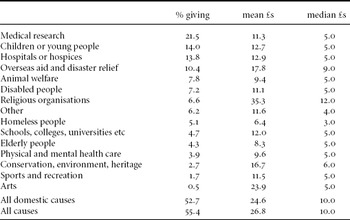
The CAF/NCVO module probes charitable giving in detail, seeking information on the amounts given and the methods of giving for donations to each of a range of causes in the four weeks prior to the interview. People are asked whether they have given to charity through any of nine methods listed on a showcard. For each method used, respondents are asked which of 15 possible causes they have given to, of which ‘Overseas aid and disaster relief’ is one. (Table 1 shows the different causes identified in the survey.) Then, for each cause given to by each method, respondents are asked how much they gave. The design of the module was carefully chosen to provide greater detail and higher-quality data than in previous efforts by CAF and NCVO to collect survey data on charitable giving.Footnote 6
Frequency of giving in the four weeks prior to interview and average amounts per donor

Notes: ‘Religious organisations’ include churches, mosques and synagogues. ‘Disabled people’ include blind and deaf people. ‘Other’ include rescue services, human rights (other than Amnesty International which we have included in ‘Overseas aid and disaster relief’), benevolent funds and refugees. ‘Homeless people’ includes housing and refuge shelters in the UK. ‘Schools, colleges, universities’ include other education. (These are the terms used in the ONS Omnibus Survey to refer to the different causes.)
The data collected through the CAF/NCVO module in the ONS Omnibus survey marks a major step forward in information on charitable giving in the UK. But there are features of the data that are not ideal. (Some of these features, and more detail on the information collected, are discussed further in the Appendix.) The classification of donations by cause is not absolutely certain. The information on giving for married or cohabiting respondents is somewhat hard to interpret on account of the potential public good nature of giving within the household (an individual might report the couple's total giving). Information was not collected on what in charity fundraising parlance is often called ‘the ask’: the stimulus or encounter that led the donor to give (such as an approach by a fundraiser in a high street or an advertisement on the radio). Respondents may feel that charitable giving is socially desirable and could exaggerate their giving behaviour as a result (especially since the Omnibus has face-to-face interviews). Even with two years of pooled data, sample sizes are small for some causes, for people on high incomes, and for people making large gifts. Changes to the CAF/NCVO module could address some of the problems. But its presence in an Omnibus, which is intended to obtain information ‘on a variety of topics too brief to warrant a survey of their own’ (ONS, 2007), means that there are limits in practice to what can be achieved with the interviewing time available. Inevitably, the module cannot give the detail that a dedicated survey of individual and household giving could provide.
The core questionnaire included every month in the Omnibus survey collects a range of demographic and socio-economic information that we use to analyse the correlates of giving, including age, marital status, number of children, household composition, education, occupation and personal income. These characteristics may be associated with the degree of exposure to ‘the ask’, and are likely to be correlated with attitudes towards giving to different causes, including overseas development and disaster relief. For one month in the pooled data set, July 2004, we have direct information about respondents' attitudes towards development that we can link to their giving behaviour. The Omnibus survey in this month included a module of questions sponsored by the Department for International Development (DfID) on respondents' attitudes towards poverty in developing countries and towards the roles of charities, governments and international organisations in its reduction. (The data are the basis for the figures on public attitudes cited in the opening paragraph of the Introduction.)
Giving to overseas and to domestic causes
Table 1 shows the percentages of persons in our pooled sample giving to each of the causes identified in the CAF/NCVO module, together with the mean and median amounts given. Just over half the sample gave to at least one cause in the four weeks prior to interview, with a mean amount given to all causes taken together of nearly £27 per donor.
What about development? One in ten persons gave to overseas aid and disaster relief. Only medical research, children/young people and hospitals/hospices attract more donors than overseas causes, and only religious organisations have both higher mean and median amounts. (The high mean for the arts is subject to large sampling error, being based on only 47 donors.) Overseas charities' position as a leading cause stems from both the high frequency of giving and the large average amounts donated relative to other causes: something not shown in aggregate statistics on the charitable sector. Both the frequency and the average are ahead of the figures for animal welfare, the cause sometimes seen as the most popular target for charitable donations in the UK. The overseas mean is nearly three-quarters of that for all domestic causes taken together and the medians are even closer, underlining how big the size of overseas donations are in relative terms.
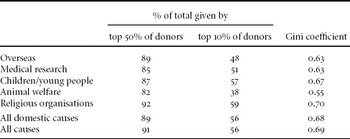
For all causes, including overseas, the distributions of the amounts given show very high positive skew: the means are far higher than the medians, often by a factor of more than two. The well-known skew in the distribution of household incomes provides a benchmark. Incomes are much less skewed than charitable donations: mean UK weekly household income is less than 1.275 times the median.Footnote 7Table 2 gives more information on the distributions of donations to overseas and other leading causes. A half of all donors provide about 90 per cent of all overseas donations; and a half of all overseas donations are given by only one in ten donors. These figures differ somewhat for other causes, but sampling variation means that not too much should be read into the differences.Footnote 8 When allowing for the frequency of giving in Table 1, this pattern means that a half of all overseas donations are made by only 1 per cent of the adult population.
Distribution of amounts given

Note: In each case the distribution is of positive amounts given.
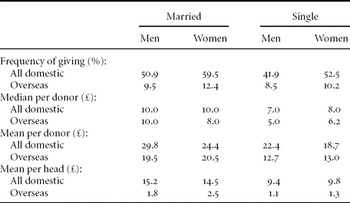
It is a common belief that women give more to charity than do men. CAF and NCVO's own analysis of the Omnibus data show that more women than men indeed make donations, but the average amount given per donor is higher for men (CAF and NCVO, 2006: Table 3). Does this picture hold for overseas giving? In view of the uncertainty surrounding responses of couples to the survey, Table 3 shows figures separately for married and cohabiting people and people who are single. (For brevity, we include cohabitees among ‘married’ in the rest of the article.) As with all domestic causes taken together, more women give to overseas causes than do men. In fact, this is also true of almost all other causes when taken individually (not shown in the table). Only sports, the arts and the residual ‘other causes’ category attract more men than women, and the higher frequency of giving among women is found for both single and married respondents. The higher figures for married people are consistent with donations being a public good within marriage (leading each partner to be more likely to report giving), but other explanations based on systematic differences between single and married people could also explain this pattern.
Frequency of giving by cause, marital status and sex

Note: Married includes co-habiting persons; single includes married people living apart.
What of the amounts given? For domestic causes, the pattern of the means per donor reflect the CAF/NCVO findings of higher amounts for men (which were based on only three waves of data), although the difference is not statistically significant for single people. For overseas giving, however, we cannot reject the hypothesis that the means for men and women are the same. The comparison of means is strongly influenced by high values right at the top of the male distribution (Piper and Schnepf, Reference Piper and Schnepf2008). The medians, which are not affected by outliers, give a mixed picture: for single people the female figures are higher. The mean donations per head, which take account of both frequency of giving and amounts given, are generally higher for women, although none of the differences from the male figures is statistically significant.
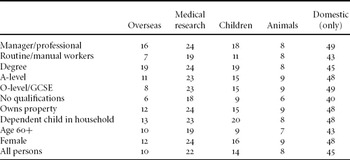
The literature from both the USA and the UK has shown occupation and education to be important correlates of giving (Jencks, Reference Jencks, Powell and Steinberg1987; Banks and Tanner, Reference Banks and Tanner1997; Havens et al., Reference Havens, O'Herlihy, Schervish, Powell and Steinberg2006). Table 4 investigates how these and a number of other socio-economic characteristics are associated with differences in overseas and several types of domestic giving. People with a managerial or professional background are over twice as likely to give to overseas as a routine or manual worker, a differential that is notably larger than for the other causes. The change in giving to overseas with increased education is also greater. By contrast, giving to medical research and, especially, animal welfare varies little with any of the characteristics in the table. Older people are slightly less likely to give to all the causes illustrated. Giving to child welfare is notably more common among those with dependent children. Owner-occupation, a proxy for wealth, is associated with only a slightly higher frequency of giving compared to the average person, with the difference varying little across the causes. (The relationship of giving with income is considered later in the article.)
Probability of giving to different causes by individual characteristics (%)

Notes: The final column refers to giving to just domestic causes. The ‘owns property’ category includes only actual home owners and not for example adult children living in a home owned by their parents. The table should be read as follows: e.g. a manager or professional has a 0.16 probability of giving to overseas causes.
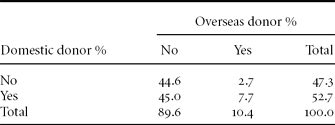
In theory, people giving to development might be a completely separate group from those giving to domestic causes. But Table 4 suggests that this is not the case in practice. For example, higher levels of occupation and education are associated both with giving to overseas and to domestic causes, albeit to a different extent. Table 5 shows that three-quarters of overseas donors also give to at least one domestic cause.Footnote 9 In other words, the probability of giving to domestic causes, conditional on being an overseas donor, is higher than the unconditional probability of domestic giving (0.74 compared to 0.53).Footnote 10 A half of overseas donors give to two or more other causes and nearly a third to three or more (this is not shown in the table). These figures turn out to be very similar to the average pattern for other major causes. Many people spread their charitable giving.
Association between overseas and domestic giving
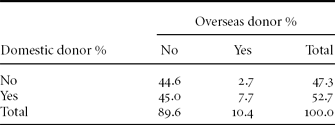
Note: The table classifies the pooled sample of 9,050 persons into domestic and overseas donors and shows the percentage in each combination.
Further analysis reveals that overseas donors have a higher probability of giving to each and every one of the 14 separate domestic causes in the data than do the sample as a whole. Conservation and the environment, religious organisations, arts, and the homeless attract disproportionate numbers of overseas donors − in each case, they are over 2.5 times more likely to give to the cause in question than the average personFootnote 11 − or, restricting the comparison just to people who do give to charity, they are about 1.5 times more likely to give to these causes than the average donor.
However, the clustering of overseas giving with other giving is not unique; whatever cause we consider, the data show that the probability of a donor to that cause giving to one of the other 14 causes in the data is higher than the unconditional probability of giving to the other cause. In broad terms, giving to one charitable cause tends to go hand in hand with giving to other causes, notwithstanding the differences we have emphasised from Table 4.Footnote 12
With most causes, the clustering is in fact higher than it is for overseas giving. The figure of 26 per cent for the percentage of overseas donors who give just to that cause is surpassed only by the percentages for giving to children (27 per cent), medical research (32 per cent) and ‘other’ (38 per cent). Children and medical research, like overseas, are among the most popular causes. It is for the less popular causes – such as arts, sports, and conservation – where clustering is greatest and where the percentage of ‘unique’ donors to that particular cause is lowest.
Who cares about overseas causes but does not give?
We would like to probe beneath the Omnibus numbers and learn more about motives. Normally we cannot do this, but the July 2004 survey round offers us a great opportunity to do so, as we can link responses to the CAF/NCVO module to those about attitudes towards poverty in the developing world and its alleviation in the DfID module that was also in the questionnaire that month.
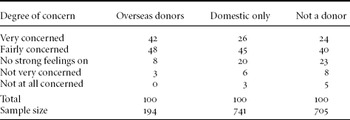
Table 6 classifies donor status against responses to a question on concern about levels of poverty in developing countries. The great majority of overseas donors reported that they were ‘fairly concerned’ or ‘very concerned’. (That one in ten did not express any concern is clearly surprising.) But, strikingly, the same applies to the majority of most other people: 71 per cent of those giving to domestic causes only and 64 per cent of non-donors, although many fewer were ‘very concerned’ than among the overseas donors.
Attitudes to poverty in developing countries and charitable giving, July 2004 (%)

Notes: The table shows responses to the question ‘Which item on this card best describes how you feel about levels of poverty in developing countries?’. Domestic donors are defined here to give only to domestic causes, while overseas donors include those also giving to domestic causes. Figures do not always sum to 100 due to rounding.
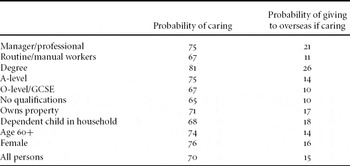
This suggests that there is considerable potential for expansion of overseas giving. Who are the people who express concern about poverty in developing countries but do not give? Some may be people who have an annual direct debit to an overseas charity which did not fall due in the four weeks prior to interview, the period covered by the questions on giving. This is the ‘infrequency of purchase’ problem described in the Appendix. But there are also systematic differences between the ‘caring donors’ and the ‘caring non-donors’. Table 7 shows the percentages of people of different characteristics who ‘care’ (defined as ‘fairly’ or ‘very’ concerned about developing world poverty) and, among those who do care, the percentages who then actually give to overseas causes. In this way, we delve beneath the surface of the patterns of overseas giving shown earlier in Table 4 (although the data in Table 7 refer to only one survey round). For example, we see that the positive association of degree level education with overseas donations reflects both a higher probability of caring about developing world poverty and a higher probability of actually making a donation given that one cares. (This is seen by comparing the figures for ‘degree’ with those for ‘all persons’.) It is still the case, however, that three-quarters of people with degrees who care are not recorded as giving. The same pattern is found for managers/professionals, while those with only O-level or GCSE qualifications are both less likely to care and less likely to make a donation given that they do care. On the other hand, women have a higher probability of caring, but their probability of giving if they do care is little different from the average.
Probability of caring (all persons) and of giving to overseas (persons caring only) by individual characteristics (%), July 2004

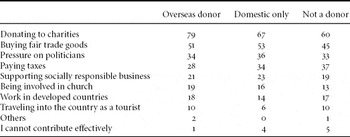
One explanation for caring but not given is that the individual has not been asked to donate. Encountering ‘the ask’ may vary systematically across individual characteristics. Another explanation is that a person may favour other methods of helping the poor in developing countries. The DfID Omnibus survey module asks respondents about the ways they think they could, as individuals, ‘most effectively contribute to the reduction of poverty in developing countries’. Table 8 shows the percentages of persons mentioning different methods among the maximum of up to three that may be given (the methods were presented to respondents on a showcard). We restrict attention again to those persons expressing concern about developing country poverty.
Methods by which people think they can contribute effectively to reducing poverty in developing countries (persons concerned about poverty only), July 2004 (%)

Note: The table refers to 1,158 persons ‘fairly’ or ‘very’ concerned about poverty in developing countries (171 overseas donors, 536 domestic (only) donors and 451 persons giving neither to overseas nor domestic causes).
It is striking that charitable giving comes top irrespective of donor status. It is not the case that giving is viewed as ineffective by those who do not make overseas donations, and, in general, it is the similarities rather than the differences between the sets of figures for the three groups that is perhaps most striking. People making only domestic donations or those not giving at all are somewhat more likely to cite paying taxes, but the differences are not great.Footnote 13 Further analysis (not shown) reveals women in all three groups to be more likely than men to cite buying fair trade goods, involvement in the church and (except among overseas donors) making charitable donations. Overall, these results can be seen as encouraging for international charities: charitable giving finds very widespread support, including among those not giving in the recent past.
Income and charitable donations
If overseas donations increase more than proportionately as income rises, then higher real incomes over time will produce disproportionately large increases in charitable giving. In this case, overseas giving is classified as a ‘luxury’ in economic terms. If, on the other hand, overseas giving rises less than proportionately, then it is a ‘necessity’. The growth in overseas donations over time would lag behind growth in incomes. In both cases, the funding of the Millennium Development Goals is helped. But the funding benefits much more if overseas giving is a luxury. However, if overseas giving is a luxury, it is more sensitive to economic downturns.
The future path of overseas donations provides one motivation for investigating the link between donations and income. Another comes from contrasting the incidence of taxation to fund government spending on ODA with the incidence of private individuals' overseas giving. The overall tax burden is progressive, the rich paying a higher proportion of their income in tax than the poor (Jones, Reference Jones2006). But if charitable donations to overseas causes are a necessity, as just defined, then by contrast they are regressive: the share of income given falls as income rises. This type of comparison may seem invalid: donations are voluntary while taxes are obligatory. However, the concept of a tithe – a tax levied by a church on its members and a traditional feature of several religions – suggests that this comparison is not unnatural. Tithes to fund good works are typically proportional (a constant share of income) or mildly progressive (achieved through a tithe-free allowance followed by a constant marginal rate). They are not regressive. An analogy may also be made with the voluntary participation in the UK National Lottery. One of the concerns with the Lottery is that it is regressive: the good causes that the lottery contributes to are disproportionately funded by the gambling of low-income people.
The existing UK literature on the relationship of giving to income is sparse, even if we restrict attention to total donations. The standard reference is Banks and Tanner's (Reference Banks and Tanner1997) analysis of Family Expenditure Survey (FES). Using 1993–4 data, they found the share of total household expenditure going on charitable donations to all causes to fall from about 2.5 per cent for the bottom 20 per cent of households, ranked by total income, to less than 1 per cent for the eighth and ninth deciles, before rising slightly to just over 1 per cent for the top 10 per cent of households (Banks and Tanner, Reference Banks and Tanner1997, Figure 2.4). However, these figures refer only to those households that do actually give; they show how the share given varies for donor households only. In addition, Banks and Tanner found that the proportion of households making donations rose notably with income, from about 15 per cent for the bottom fifth to over 40 per cent for the top fifth (ibid, Figure 2.3). Regression models were also estimated both for the probability of giving and for amounts given. The results implied that, holding other factors constant, donations are (just) a luxury.Footnote 14 The much larger US literature is reviewed by Havens et al. (Reference Havens, O'Herlihy, Schervish, Powell and Steinberg2006) who argue that, contrary to popular belief, a reverse J-shaped relationship of a falling and then slightly rising income share (suggested also by Banks and Tanner's descriptive evidence for donor households) does not hold. They argue that the income share changes little across the income distribution, before rising sharply at very high income levels (around US $300,000 pa).
The UK literature is almost silent on how donations to overseas causes vary with income. The notion that ‘charity begins at home’ suggests that overseas giving is a luxury and hence progressive in incidence: people give mainly to domestic causes at lower levels of income but add-on giving to overseas causes as their income rises. This would be consistent with Jencks' suggestion that people both ‘pay their dues’ and ‘give away surplus’ (Reference Jencks, Powell and Steinberg1987: 324). Breeze's novel study (Reference Breeze2006) does explore the relationship between giving by cause and income. She argues that the J-shaped relationship referred to above applies to all causes. However, the data refer to a purposive sample of current donors known to several major UK charities. By contrast, the Omnibus survey has a probability design that generates a sample representative of the population as a whole, including both non-donors as well as donors (so that the change with income in the propensity to give anything at all can be studied, as well as the change in amounts given).
In building on the existing results, we need to recognise that the Omnibus data on both giving and income differ markedly from what is available in the FES or its successor, the EFS. The Omnibus survey has a broader definition of a gift and covers giving over a longer period (the expenditure diary in the EFS covers only two weeks), and it records the individual giving of one person per household rather than household giving, although we have noted that the two might be the same for couples due to the public good nature of donations. The survey also provides information only on individuals' own incomes, and not on the incomes of people with whom they may live. Hence, we can relate individual giving to individual income, but not household giving to household income. For someone in a couple, individual income may not be a good indication of access to resources from which to make donations. If couples pool their income, the partner with lower income will be able to fund more donations than can a single person with the same personal income. We may find sizeable donations made by people with virtually no personal income of their own. For these reasons, we focus in particular on the results for single people.
It is also the case that the Omnibus survey's data on income are much less detailed than those from the FES, where respondents are asked for exact amounts from each separate source. The Omnibus survey contains a single question that asks respondents to indicate from a list the band of annual income containing their gross income from all sources. There are 33 bands in the 2004/5 data (including zero income) and 39 bands in 2005/6, with top open-ended bands in the two years of £36,400+ and £52,000+ respectively. (In 2005/6 the top band contains only 3 per cent of people providing data on income.) About 8 per cent of people in our pooled sample declined to respond to the income question and they are excluded from the analysis of this section.Footnote 15 The limits of our sample size and the lack of detail for high incomes means that we can say nothing about the donations of the very rich (see, for example, Lloyd, Reference Lloyd2004). The upturn in any ‘J-shaped’ relationship may simply not be covered by our data.
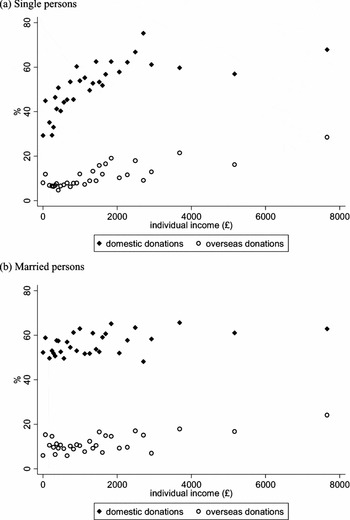
Figure 1 shows how the percentage of people giving to overseas causes changes across the income bands, expressed in monthly terms. We compare these figures with those for all domestic causes taken together (turning later in the section to look at several different causes separately). The percentages given are plotted against the mid-points of the relevant bands. For the top open-ended band, we use the mean of gross individual income in the 2004/5 Family Resources Survey. Several data points are based on only small sample sizes, entailing high sampling error, and it is the general patterns in the data that should be the focus rather than particular values.Footnote 16 The frequency of both overseas and domestic giving rises with income for single people. Around 10 per cent of single people in the lowest income bands make overseas donations, the figure then falling somewhat before rising to levels of 15–20 per cent at incomes of £1,500 per month or more. The rise is clearer for domestic giving, although the proportional rise is in fact not dissimilar to that for overseas giving in the bottom half of the distribution: the percentage rises by a factor of about 1.5 to about 60 per cent at levels of about £1,700 or more. For both overseas and domestic giving there seems to be a flattening out of the relationship with income at high levels. (In the case of domestic giving this has to be the case, since the percentage giving cannot rise above 100 per cent.) The lower half of the figure shows the picture for married people. This is quite different, especially at low incomes, and especially for domestic giving where the relationship appears fairly flat.
Frequency of giving (per cent) by level of monthly income.
Notes: The graphs show the percentage giving in each income interval, plotted against the mid-point of the interval. See also note 16.

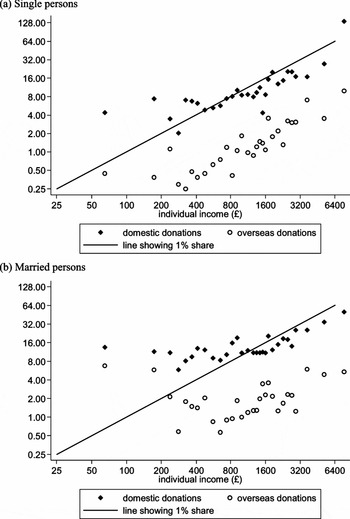
Figure 2 plots the mean donations per head (averaging across both donors and non-donors) against income, obtained by multiplying the frequencies in Figure 1 (expressed as proportions rather than percentages) by the mean donations per donor in each income band. The data are plotted on log scales. This makes it easier to compare the proportional changes for overseas giving and domestic giving and hence to judge whether the former is more or less responsive to changes in income. The proportional changes are also the basis for the classification of the two types of giving as luxuries or necessities in economic terms. The line drawn on the diagrams shows the case where the donations represent 1 per cent of monthly income. In this case, where the share of income given to charity is constant, donations rise hand-in-hand with income: that is, a 10 per cent rise in income leads to a 10 per cent rise in donations. The same is true of any other line that could be drawn which is parallel to the 1 per cent share line: a constant share and an equi-proportional increase in income and donations. If the data points rise more steeply than the line on the diagram (or any parallel line), then the cause in question can be classified as a luxury (share rising with income); if they rise less steeply, then giving is a necessity (share falling with income).
Mean amount given per head by level of monthly income.
Note: The graphs plot on log scales average amounts per head (averaging over donors and non-donors) by monthly income level. People with zero income are excluded. See also note 16.

In broad terms, if we set aside people with incomes below about £250 (about one in six of the sample), the two data series for single people appear roughly parallel to the line. A given percentage increase in income leads to about the same percentage increase for both overseas and domestic giving. This is the border between classification as a luxury and as a necessity, or between donations being labelled as progressive or regressive. There is some suggestion that the data series for overseas giving rises slightly more steeply than that for domestic giving, where (bar the final point) the slope of the data appears slightly less than that of the 1 per cent share line. For married people, giving rises less than proportionately with income, and at lower levels does not rise at all, reflecting in part what was already seen in Figure 1.
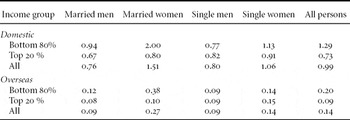
Taking all married and single people together, 1 per cent of monthly income is given to domestic causes and another one seventh of a per cent to overseas causes. Table 9 summarises how these shares differ for people in the top fifth of the income distribution (with individual annual incomes of about £23,000 or more).Footnote 17 The shares for married people are clearly lower in the top fifth for both causes – domestic and overseas – reflecting the pattern in Figure 2. This is particularly notable for women and especially for overseas giving. The situation is very different for single men: the domestic giving share is slightly higher for the top fifth than for those on lower incomes, while the overseas share is the same. Single women also have overseas giving shares that are essentially the same for the top fifth and for the other four-fifths, and domestic shares that differ little. Note that our income measure refers to gross income before deductions due to tax and National Insurance contributions. If the data were to measure net incomes, after deductions, the shares in Table 9 would be higher. Moreover, since people with higher incomes pay higher taxes as a proportion of their income, the figures would rise more for the top quintile group. In the case of single people, the change could result in overseas giving appearing as a luxury in economic terms for both men and women, and the share for domestic giving for men appearing even higher for the top income group.Footnote 18
Donations to domestic and overseas causes as a share of gross monthly personal income (%)

Notes: The income groups refer to the distributions of income among all persons. In order to estimate the denominator in these calculations, we assign people to the mid-point of their income band in the Omnibus survey. Persons in the top unbounded range are assigned the mean in this range recorded for their gender in the 2004−5 Family Resources Survey (gender-specific means are not used in Figures 1 and 2).
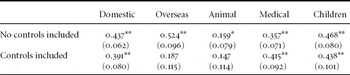
Do the increases in charitable giving with income largely reflect the correlation of income with other factors that we have shown to be positively associated with giving: occupation, education and home ownership? We focus on single people, for whom the interpretation of individual income is clearer, and restrict attention to the probability of giving (leaving aside the amounts given). We also now compare overseas giving with several separate domestic causes. Table 10 shows the results of estimating logistic regression models of the probability of giving as a function of the natural logarithm of income.Footnote 19 We exclude from the regressions people with annual incomes below £2,600 in order to get a better fit of the model to the data. (We want only a simple specification for income.) We first include no controls for other factors and then see the impact on the income coefficients of including the controls (these include gender, which is negatively correlated with income).
Logistic regression models for probability of giving: coefficient of log income (single persons only)

Notes: Robust standard errors in parentheses; * significant at 5%; ** significant at 1%. The models are estimated on single persons with annual income above £2,600 (which leads to 18% of single people being excluded); n = 3,478 individuals. The first set of results are from models with no other variables included. The second set are from models including dummy variables for female, property owner, manager/professional, routine/manual, degree, A-level and O-level or GCSE.
With no controls, the coefficient for overseas giving and that for all domestic causes taken together are similar, although the former is somewhat larger, reflecting the pattern described in Figure 1. But giving to medical research and, especially, animal welfare is less strongly associated with income. With the other factors controlled for, the most marked change is for overseas giving. The income coefficient falls sharply and becomes statistically insignificant at conventional levels. By contrast, it changes little for the other causes.Footnote 20 The results for the control variables (not reported) confirm the strong impact of education on overseas giving that we highlighted earlier in Table 4, and in particular higher education. For the other causes, there is no significant difference in the probability of giving between persons with higher education and persons with no formal qualifications, once income and the other factors in the model are controlled for.
These results may suggest that the recent expansion of higher education in the UK could be favourable for overseas giving, but they also warn against a simple view that rising real incomes will bring forth more donations. However, caution is needed here. Findings based on a cross-section survey that measure differences in income and education at one point in time may not be a reliable guide to the impact of changes over time.
Conclusions
We have established a picture of charitable giving to overseas causes and have shown whether this giving differs from that to other, ‘domestic’, causes. In doing so we have found out quite a bit more about patterns of charitable giving in general.
Overseas development and emergency relief is one of the leading charitable causes. This is due both to a relatively high frequency of giving compared to many other causes – one in ten persons in the four weeks before interview – and high average amounts given by donors. The distribution of overseas giving is very highly skewed (far more so than household income), so that a half of all donations are given by the top 10 per cent of donors, or 1 per cent of the adult population.
The skew in the distribution of amounts given is one of the similarities that overseas donations share with giving to other causes. And people who are more likely to give to overseas causes are more likely to give to domestic causes as well: women, married people, and (in the case of several other leading causes) people with higher socio-economic backgrounds in terms of education and occupation. The relationship of giving with income seems similar for overseas donations and for donations to domestic causes, at least when the domestic causes are taken together. Focusing on single people, we find shares of gross income given to charity that are broadly constant (other than at lower levels of income). In crude terms, giving is distributionally neutral for large parts of the individual income distribution: neither progressive nor regressive. The similarities in characteristics of overseas and domestic donors mean that most people who make overseas donations also give to domestic causes as well.
But there are also some clear differences between overseas and domestic giving, especially when we look at giving to particular domestic causes. Higher education and a managerial or professional background have a much stronger association with the probability of overseas giving than with giving to medical research and animal welfare, for example. (Giving for animals varied little with individual characteristics.) When we control for other factors correlated with income, the income ‘effect’ on the probability of overseas giving drops away, in marked contrast to giving for children's charities, for example, and also all domestic causes taken together. Although overseas giving in general goes hand in hand with other giving, there are particular causes – for example, conservation and the environment, and religious organisations – with which it is most associated.
The great majority of people do not give to overseas causes (at least over the four-week period covered in the data), but most people do express concern over poverty in developing countries. And most people who do not make overseas donations report that they see charitable giving as an effective method by which they can contribute to the alleviation of this poverty – more so than for any other method. There is encouragement here for international charities' fundraising efforts.
Appendix: The Omnibus Data on Charitable Giving
This Appendix gives more information on several aspects of the Omnibus data and the problems they present.
1 Seasonality. Although the months in which the CAF/NCVO module is included in the Omnibus survey are spread reasonably evenly through the year, there may still be problems of seasonality that affect what we can say with the data. Suppose that there was a regular seasonal dip in charitable giving following Christmas. This would be reflected in the donations recorded in the four weeks prior to the February round of the Omnibus survey and, since the CAF/NCVO module is included in the survey only three times a year, the pooled data would be disproportionately affected by this dip. Comic Relief, a large charity that spends 60 per cent of its income overseas, gathers most of its donations through a ‘telethon’ and associated events in March, once every two years. Most of these donations will be missing from the data collected by the survey since the period concerned falls outside the survey months. And where donations to any charity are given by regular annual gifts (or membership subscriptions – see below), there will be the standard ‘infrequency of purchase’ problem suffered by budget surveys, with fewer donors recorded than would be the case if information on annual donations were collected.
2 Giving by couples. The survey's restriction to one individual in each sampled household means that we cannot observe the total of each household's donations. Respondents are asked about their own donations but not those of other household members. There is a potential problem of measurement of individual donations where married or cohabiting couples make decisions jointly about their charitable giving, funding their donations from their joint income. In this case, giving can be thought of as a public good within the household (Andreoni et al., Reference Andreoni, Brown and Rischall2003). An individual respondent may therefore lay claim to all the giving done by the couple. Although there would be no double-counting within surveyed households, since only one household member is interviewed, this situation would imply that aggregate amounts given are overestimated by the Omnibus survey.
3 The definition of a ‘charitable gift’. There are ambiguities in the concept of charitable giving that must be addressed in any survey that collects data on donations (Lee et al., Reference Lee, Halfpenny, Jones and Elliot1995). First, there is the definition of a charity. Not all voluntary organisations are charities, including some that may be perceived by the public as being so. Several organisations with charitable aims decline to seek charitable status since they feel it would restrict their ability to campaign as a pressure group. Amnesty International is an example. Other organisations are formal charities despite not obviously existing to provide benefit that is charitable in the public perception. This is illustrated by the recent debate in the UK on the charitable status of private schools. The CAF/NCVO module in the Omnibus survey in effect allows the respondent to decide whether a gift was to a charity or not. Second, there is the concept of a gift. Giving may take various forms, and one important method, the donation of time or ‘volunteering’, is not covered by the Omnibus survey (see Office of the Third Sector, 2007, for recent survey information on this). But even with gifts of money there is room for different interpretations. Lee et al. (Reference Lee, Halfpenny, Jones and Elliot1995: 41) draw attention to the status of membership subscriptions to charitable organisations (such as to the National Trust or the Royal Society for the Protection of Birds), ticket purchases in raffles on behalf of charities and purchases at charitable shops. These are three of the nine methods covered by the CAF/NCVO module, which also includes fundraising events (such as purchases or entrance fees to jumble sales, fêtes and charity dinners).Footnote 21 In each case, the respondent is asked for the full amount paid or transferred, all of which is treated as a donation. The survey therefore casts its net wide, although data for donations by each method are separately recorded so the user can choose to focus on a sub-set.
4 The definition of ‘overseas aid and disaster relief’. There are 15 charitable causes identified in the CAF/NCVO module, of which ‘overseas aid and disaster relief’ is one. Several points about the definition of this cause arise. First, the inclusion of disaster relief, which is standard for such classifications, means that the data for giving in each Omnibus round will be affected by any recent large international emergencies. The Asian Tsunami at the end of 2004 is the most obvious case. This disaster occurred shortly before the Omnibus round in February 2005, and the CAF/NCVO module for that month was adjusted to include giving for Tsunami relief as a separate additional category of donations in the four weeks prior to the interviews. A further question was also included to cover all giving to the Tsunami appeal since the tidal wave struck on 26 December. The earthquake in Pakistan in early October 2005 is another example of a large emergency appeal, although in this case the CAF/NCVO module that month did not identify donations for the earthquake victims' relief as a separate cause. We do not include the February 2005 data on giving for the Tsunami appeal in our analysis, treating it as an exceptional episode. Two-thirds of the February sample reported making a donation since the Tsunami actually occurred, a figure that accords reasonably well with one from an NOP Omnibus quota sample from mid-January 2005 (CAF, 2005). We find no detectable change in frequency of giving to overseas causes or mean amounts in the later survey rounds. Second, giving to overseas causes does not necessarily imply giving for the benefit of people in poor countries. For example, donations to charitable causes in Israel would presumably be included by Omnibus respondents under the ‘Overseas’ heading. However, in the UK, the great majority of overseas giving is in fact aimed at poor countries. It is also the case that some charities have both domestic as well as overseas aims, and have significant programme expenditure in the UK. The Red Cross, which is explicitly mentioned in guidance to Omnibus interviewers as an example of an overseas charity, falls into this category. Third, some respondents may report donations for development under another heading. Is a donation to Save the Children or to UNICEF one that benefits an overseas cause or one that benefits children? Do donations to the Catholic Agency for Overseas Development (CAFOD), to Christian Aid, or to Islamic Relief represent giving to development or giving to a religious organisation? The CAF classification of top 500 fundraising charities in Charity Trends treats all these as overseas charities. Our presumption is that respondents to the Omnibus survey will also do so, but it is difficult to rule out all such problems of classification in respondents' minds.
5 Cleaning of the data. We follow the rules established by CAF and NCVO for their analysis of the data in CAF and NCVO (2005, 2006). These rules set donations to zero if they exceed a threshold that varies with the method of giving. More details and checks of sensitivity of results to other rules are given in Micklewright and Schnepf (Reference Micklewright and Schnepf2007b).
Acknowledgements
This research was supported by ESRC project grant ‘Giving to Development’ (RES-155–25-0061), which forms part of the Non-Governmental Public Action programme. We thank Tony Atkinson and Cathy Pharoah for very useful suggestions, the Charities Aid Foundation and the National Council for Voluntary Organisations for access to the data on donations from the ONS Omnibus survey, and Charles Lound of ONS for clarification of the survey stratification and clustering. Useful comments were made by seminar and conference participants at University College Dublin, the ESRC WeD Group at Bath, the Voluntary Sector Studies Network, the Royal Statistical Society, and International Society for Third-Sector Research, and by two referees.