Implications
Including sunflower seed (SS) in a red clover silage (RCS)-based diet increases the proportions of vaccenic and rumenic acids in beef, which have potential human health benefits, but can negatively affect aspects of both beef production and quality. Inclusion of SS in RCS-based diets along with dried distillers’ grain with solubles improved beef production and quality without negatively influencing the profiles of potentially healthful fatty acids.
Introduction
Grain-fed beef in North America has been surveyed and shown to have more trans t10-18:1 than t11-18:1 (vaccenic acid; Aldai et al., Reference Aldai, Dugan, Rolland and Kramer2009). This is attributed to feeding high levels of small grains like barley or wheat with rapidly fermentable starch, which causes rumen pH depression and a shift in the rumen bacterial population from vaccenic acid to t10-18:1 producing species (Zened et al., Reference Zened, Enjalbert, Nicot and Troegeler-Meynadier2013). Animal models for humans and human studies strongly suggest that increased consumption of most trans fatty acids (FA; Brouwer et al., Reference Brouwer, Wanders and Katan2013) including t10-18:1 pose a higher risk of developing cardiovascular disease (CVD) by a mechanism related to an increased ratio of plasma low-density lipoproteins to high-density lipoproteins. Vaccenic acid and its derivative rumenic acid (c9,t11-18:2), however, potentially possess independent bioactivity in reducing CVD risk and normalising metabolic abnormalities associated with dyslipidemic and pre-diabetic conditions (Wang et al., Reference Wang, Jacome-Sosa and Proctor2012). Research on nutritional strategies that reduce the levels of t10-18:1 and increase levels of vaccenic and rumenic acids in beef have, therefore, been undertaken.
Previously, we found that feeding ground flaxseed with grass hay v. barley silage enhanced levels of beef polyunsaturated FA biohydrogenation products (PUFA-BHP) including vaccenic acid, rumenic acid and t11,c15-18:2, the major non-CLA 18:2 BHP (i.e. atypical dienes, AD; Nassu et al., Reference Nassu, Dugan, He, McAllister, Aalhus, Aldai and Kramer2011). We have also found that adding flaxseed to a red clover silage (RCS)-based diet promotes even greater proportions of PUFA-BHP in total FA with rumenic acid reaching a maximum level of 2.9% in backfat, and vaccenic acid and t11,c15-18:2 reaching maximum levels of 9.5% and 1.9% in kidney fat, respectively (Mapiye et al., Reference Mapiye, Turner, Rolland, Basarab, Baron, McAllister, Block, Uttaro, Aalhus and Dugan2013b). In a follow-up study, we fed 70 : 30 forage : concentrate diets, with either grass hay or RCS as the forage source, and flaxseed or sunflower seed (SS) as sources of linolenic (18:3n-3) and linoleic (18:2n-6) acids, respectively. We found that feeding the RCS-SS diet yielded the largest proportions of vaccenic and rumenic acids, and the smallest proportions of BHP with either detrimental or unknown effects on human health (Mapiye et al., Reference Mapiye, Aalhus, Turner, Rolland, Basarab, Baron, McAllister, Block, Uttaro, Lopez-Campos, Proctor and Dugan2013a). Feeding diets containing RCS v. grass hay, however, resulted in lower growth rates, smaller carcases and meat with a less desirable appearance. It was, therefore, of interest to determine if an alternative feed ingredient could be found that could partially replace RCS and improve beef production and quality while retaining high levels healthful PUFA-BHP.
Wheat dried distillers’ grains with solubles (DDGS; i.e. products remaining after starch removed during bioethanol production) is becoming abundantly available and a lower-cost source of energy in beef diets as whole grain prices increase (Dugan et al., Reference Dugan, Aldai, Kramer, Gibb, Juárez and McAllister2010; He et al., Reference He, Yang, Dugan, Beauchemin, McKinnon and McAllister2012). Previous research demonstrated that partly replacing barley grain or silage with DDGS in feedlot diets have little or no impact on animal performance, carcass traits (Gibb et al., Reference Gibb, Hao and McAllister2008) or meat quality (Aldai et al., Reference Aldai, Aalhus, Dugan, Robertson, McAllister, Walter and McKinnon2010a) but enhances the deposition of healthful FA including 18:3n-3 (He et al., Reference He, Yang, Dugan, Beauchemin, McKinnon and McAllister2012), vaccenic and rumenic acids (Aldai et al., Reference Aldai, Dugan, Aalhus, McAllister, Walter and McKinnon2010b; Dugan et al., Reference Dugan, Aldai, Kramer, Gibb, Juárez and McAllister2010). The objective of the current study was, therefore, to determine if finishing steers on diets containing SS in a RCS-based diet along with inclusion of DDGS could increase beef production and quality while maintaining high levels of healthful PUFA-BHP.
Material and methods
Animals and dietary treatments
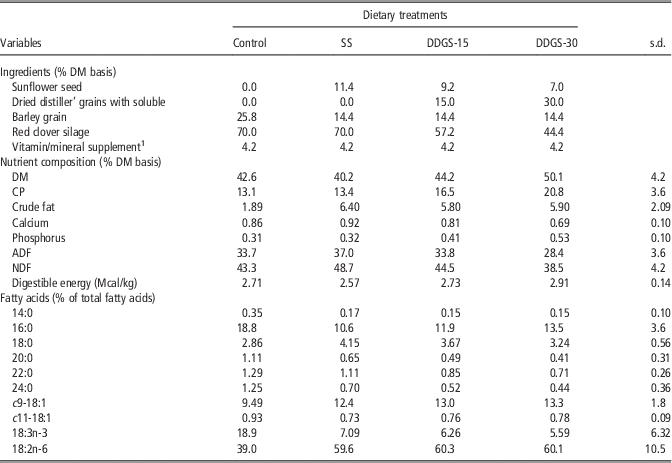
Procedures for the care and handling of animals used in this study were approved by the Lacombe Research Centre Animal Care Committee in compliance with the principles and guidelines established by the Canadian Council on Animal Care (CCAC, 1993). In all, 64 12-month-old British×Continental cross-bred steers with an initial mean BW of 362.7±4.50 kg were stratified by weight to four experimental diets (control; SS, DDGS-15 and DDGS-30), with two pens of eight steers/diet. The control diet was composed of 70% RCS, 25.8% barley grain and 4.2% vitamin–mineral supplement on dry matter (DM) basis (Table 1). The SS diet contained 11.4% SS substituted for barley grain, and the DDGS-15 and DDGS-30 diets contained 15% and 30% DDGS substituted for RCS and SS to maintain ~5% added oil in the diets from either SS or DDGS (DM basis; Table 1). Steers in each pen were group fed to appetite and were all capable of feeding at the feed bunk at the same time (0.8 m of space at the bunk/steer). During the study period one steer from the DDGS-15 diet died from a ruptured abdominal abscess.
Ingredient, nutrient and fatty acid composition of the dietary treatments

SS= sunflower seed; DDGS-15= 15% wheat dried distillers’ grain with solubles+sunflower seed; DDGS-30=30% wheat dried distillers’ grain with solubles+sunflower seed; DM=dry matter.
1 Vitamin/mineral supplement per kg DM contained 1.86% calcium, 0.93% phosphorous, 0.56% potassium, 0.21% sulphur, 0.33% magnesium, 0.92% sodium, 265 ppm iron, 314 ppm manganese, 156 ppm copper, 517 ppm zinc, 10.05 ppm iodine, 5.04 ppm cobalt, 2.98 ppm selenium, 49 722 IU/kg vitamin A, 9944 IU/kg vitamin D3 and 3222 IU/kg vitamin E.
Feed analysis
Feed samples were collected weekly and stored at −40°C, then pooled monthly before determination of DM, minerals, crude fat, CP, NDF, ADF and FA as described previoulsy by Mapiye et al. (Reference Mapiye, Aalhus, Turner, Rolland, Basarab, Baron, McAllister, Block, Uttaro, Lopez-Campos, Proctor and Dugan2013a).
Growth measurements and slaughter procedure
Feed was provided at ~2.5% of BW once daily, which resulted in 10% to 15% orts after 18 h and complete consumption by 24 h. Individual steer weights were measured monthly and average daily gain (ADG) was calculated by dividing each animal’s BW gain by days on-test. Feed conversion efficiency (gain : feed) was computed by dividing ADG against average daily DM intake (DMI) and reported on a per pen basis. Backfat thickness was measured monthly by a certified ultrasound technician using an Aloka 500 V diagnostic real-time ultrasound with a 17 cm 3.5 MHz linear array transducer (Overseas Monitor Corporation Ltd, Richmond, BC, Canada). Steers were slaughtered at the Lacombe Research Centre abattoir over 4 consecutive weeks from 30 October to 20 November 2012 (i.e. on days 192, 207, 214 and 220 on feed; two steers/pen per diet per slaughter day). Initial ultrasound backfat thickness was similar among treatment groups. At slaughter, ultrasound backfat depths for control, SS, DDGS-15 and DDGS-30 treatments were 6.4, 5.8, 9.5 and 10.6 mm, respectively.
On mornings of slaughter, animals were transported 2 km to the Lacombe Research Centre abbatoir. At slaughter, final live weights were recorded and steers were stunned, exsanguinated and dressed in a commercial manner. Following carcass splitting, trimmed side weights were recorded and initial (45 min) pH and temperature were recorded caudal to the Canadian grade site (between 12th and 13th ribs) on the left longissimus thoracis (LT) using a Hanna HI99163 pH metre equipped with a Hanna Smart electrode FC232 for meat (Hanna Instruments, Laval, QC, Canada). Upon entry into the cooler, stainless steel thermocouples (10 cm) were placed into the right LT ~2.5 cm anterior to the 12th vertebrae of all animals, and temperatures were recorded every 15 min for 24 h using data temperature loggers (Mark III, MC4000; Sumaq Wholesalers, Toronto, ON, Canada).
Meat quality
Carcass sides were chilled overnight in a cooler set at 2°C, with an average wind speed of 1.4 m/s. At 24 h post-slaughter, the left and right carcass sides were weighed to determine cooler shrinkage losses. The left carcass sides were knife-ribbed at the Canadian grade site and the muscle surface exposed to atmospheric oxygen for 20 min. Full Canadian grade data were collected (fat thickness, estimated lean yield, rib-eye area and marbling score) along with objective colour measurements from three surface locations (CIE L* (brightness), a* (red–green axis), b* (yellow–blue axis) values; Commission Internationale de l’Eclairage, 1978) using the Minolta CR-300 with Spectra QC-300 Software (Minolta Canada Inc., Mississauga, ON, Canada). Colour measurements were converted to hue angle (hab=arctan(b*/a*)) and chroma (C*ab=(a*2+b*2)0.5). Grade data were assessed according to the Livestock and Poultry Carcass Grading Regulations (Canadian Food Inspection Agency, 1992) by two certified graders. Temperature and pH of the LT were again measured at 24 h caudal to the grade site. The left LT was dissected from the carcass at 24 h and a 5.0 cm steak removed from the grade site (caudal end of the LT), trimmed of s.c. and intermuscular fat, and epimysium and comminuted using a Robot Coupe Blixir BX3 (Robot Coupe USA Inc.; Ridgeland, MS, USA), and subsamples were frozen at −80°C for subsequent FA analyses. The remainder of the muscle was trimmed of all extraneous fat to the epimysium, weighed, vacuum packaged (Multivac AGW; Multivac Inc., Kansas City, MO, USA) and aged for 6 days at 2°C.
After aging, four 2.5 cm thick steaks were removed from the caudal end of the LT. The first steak was pre-weighed onto a polystyrene tray with a dri-loc pad, over-wrapped with oxygen permeable film (8000 cm3/m2 per 24 h vitafilm choice wrap; Goodyear Canada Inc., Toronto, ON, Canada) and placed in a fan assisted, horizontal (chest type) retail display case (Hill Refrigeration of Canada Ltd, Barrie, ON, Canada). Steaks were exposed to fluorescent room lighting (GE deluxe cool white; General Electric Canada, Oakville, ON, Canada), supplemented with incandescent lighting directly above the display case (GE clear cool beam 150 W/120 V spaced 91.5 cm apart; General Electric Canada) to provide an intensity of 1076 lux at the meat surface for 12 h/day. The average temperature in the retail display case was 3.5°C. Following 0, 2 and 4 days of retail display, three objective colour measurements (L*, a* and b*) were collected across the steak and converted to hue angle and chroma as reported previously. Spectral reflectance readings were also collected concurrently and converted to reflex attenuance (A), which is the logarithm of the reciprocal of reflectance (R) (Shibata, Reference Shibata1966). Interpolation of isobestic points for 473, 525, 572 and 700 nm were determined to calculate the relative contents of metmyoglobin (MetMb), deoxymyoglobin (Mb) and oxymyoglobin (MbO2) using the following formulae: (i) MetMb (%)=[1.395−((A572−A730)/(A525−A730))]×100, (ii) Mb (%)=2.375×[1−((A473−A730)/(A525−A730))]×100 and (iii) MbO2 (%)=100−(MetMb (%)+Mb (%)) described by Krzywicki (Reference Krzywicki1979). There is a high correlation (r=0.96) between calculated values and actual content of Mb species in meat. Changes in L*, hue, chroma, %MetMb, %Mb and %MbO2 over the retail display period were calculated as differences between 0 and 4 days values. Following the 4th day of objective colour measurements, steaks were removed from retail display and final weights were recorded to determine drip loss.
Raw steak weights were recorded on the second steak and a 10-cm spear point Type T thermocouple probe (Wika Instruments, Edmonton, AB, Canada) was inserted into the mid-point of each steak before cooking. Steaks were then cooked, on a Garland grill (Model ED30B; Condon Barr Food Equipment Ltd, Edmonton, AB, Canada) pre-heated to 210°C, to an internal temperature of 35.5°C, turned and cooked to a final temperature of 71°C. Internal temperature during cooking was monitored with a Hewlett Packard HP34970A Data Logger (Hewlett Packard Co., Boise, ID, USA). Upon removal from the grill, steaks were placed into polyethylene bags, sealed and immediately immersed in an ice/water bath to prevent further cooking. Steaks were then transferred to a 2°C cooler for 24 h. Final steak weights were recorded and six cores, 1.9 cm in diameter, were removed from each steak parallel to the fibre grain. Peak shear force was determined on each core perpendicular to the fiber grain (TA-XT Plus Texture Analyzer equipped with a Warner–Bratzler shear head at a cross-head speed of 200 mm/min and a 30 kg load cell using Texture Exponent 32 Software; Texture Technologies Corp., Hamilton, MA, USA). Warner–Bratzler shear force (WBSF) was recorded as the average of all six cores/steak. Raw and final steak weights were used to determine cooking losses, and cooking times were also recorded.
The third steak was individually vacuum packaged, placed into a 2°C cooler, and aged for 16 days before shear force determination as previously described. The fourth steak was labelled, vacuum packaged, placed into a 2°C cooler and aged for 16 days. Following aging, steaks were placed into a −35°C freezer until used for sensory evaluation.
The remaining portion of the LT was trimmed of epimysium and comminuted using Robot Coupe Blixir BX3 and analysed for protein (Whitesell et al., Reference Whitesell, Aalhus, Larsen and Juárez2014), moisture and fat using a CEM rapid analyzer system (Sprint Protein Analyzer Model 558000, Smart Turbo Moisture Analyzer Model 907990 and Smart Trac Fat Analyzer Model 907955; CEM Corporation, Matthews, NC, USA).
LT FA analysis
I.m. lipids were extracted from LT samples using a mixture of chloroform–methanol (2 : 1, v/v) according to Folch et al. (Reference Folch, Lees and Sloane Stanley1957). Aliquots of muscle lipids (10 mg) were methylated separately using acid (5% methanolic HCl) and base (0.5 N sodium methoxide) reagents (Kramer et al. Reference Kramer, Hernandez, Cruz-Hernandez, Kraft and Dugan2008). Internal standard, 1 ml of 1 mg c10-17:1 methyl ester/ml toluene (standard no. U-42 M form; Nu-Chek Prep Inc., Elysian, MN, USA) was added before addition of methylating reagents. Fatty acid methyl esters (FAME) were analysed by gas chromatography using a CP-Sil88 column (100 m, 25 µm ID, 0.2 µm film thickness) in a CP-3800 gas chromatograph equipped with an 8400-series autosampler (Varian Inc., Walnut Creek, CA, USA). Hydrogen was used as the carrier gas under constant pressure (25 psi, initial flow rate of 1 ml/min) and injector and flame ionisation detector temperatures were held at 250°C. A total of two GLC analyses were conducted per sample using complementary temperature programs with 150°C and 175°C plateaus according to Kramer et al.( Reference Kramer, Hernandez, Cruz-Hernandez, Kraft and Dugan2008). CLAs not separated by GLC were further analysed using Ag+-HPLC as described by Cruz-Hernandez et al. (Reference Cruz-Hernandez, Deng, Zhou, Hill, Yurawecz, Delmonte, Mossoba, Dugan and Kramer2004).
For the identification of FAME by GLC, reference standard no. 601 from Nu-Chek Prep Inc. was used. Branched-chain FAME were identified using a GLC reference standard BC-Mix1 purchased previously from Applied Science (State College, PA, USA). For CLA isomers, the UC-59M standard from Nu-Chek Prep Inc. was used, which contains all four positional CLA isomers. Trans-18:1 CLA isomers and other PUFA-BHP not included in the standard mixtures were identified by their retention times and elution orders as reported in literature (Cruz-Hernandez et al., Reference Cruz-Hernandez, Deng, Zhou, Hill, Yurawecz, Delmonte, Mossoba, Dugan and Kramer2004; Kramer et al., Reference Kramer, Hernandez, Cruz-Hernandez, Kraft and Dugan2008; Gómez-Cortés et al., Reference Gómez-Cortés, Bach, Luna, Juárez and de la Fuente2009). The FAME were quantified using chromatographic peak area and internal standard-based calculations (mg FA=FA peak area×relative response factor×mg internal standard added/internal standard peak area). Total FA were expressed on a mg/g basis, and individual FA were reported as a percentage of total FA identified. Only FA representing ⩾0.01% of total FA were included in tables and figures.
Sensory analysis
Before taste panel assessments, steaks were sorted by treatment to allow a balanced presentation of treatments to panellists. Steaks for each session were removed from the freezer and placed in a refrigerator to thaw for 24 h. Before 15 min of grilling at 210°C (Garland Grill ED30B), the steaks were removed from the refrigerator and weighed (Ohaus Balance GT4100; Ohaus Corp., Pine Brook, NJ, USA) to determine thaw losses and raw muscle weights. Type T copper-constantan spear point stainless steel thermocouple temperature probes (AllTemp Sensors Inc., Edmonton, AB, Canada) were inserted horizontally to the mid-point along the long axis of the steak. Steaks were cooked to an internal temperature of 35.5°C, turned and cooked to a final temperature of 71°C monitored using a Hewlett Packard HP34970A Data Logger. After cooling for 5 min and patting dry with a paper towel, cooking losses were determined by weight difference. Each steak was cut into 1.3 cm cubes, avoiding connective tissue and large areas of fat. A total of eight cubes from each sample were randomly assigned to an eight-member trained taste panel in a balanced design assigned by Compusense 5 Software, version 4.6 (Compusense Inc., Guelph, ON, Canada). In all, six samples were evaluated per session over 11 sessions. Blank (spare) samples were included as necessary to complete the design. Samples were placed in glass jars in a circulating water bath (Lindberg/Blue model WB1120A-1; Kendro Laboratory Products, Asheville, NC, USA) and allowed to equilibrate in 68°C circulating water baths (Blue M Electric MW-1120 A-1; Blue M Electric, Blue Island, IL, USA) for 7 min before serving. Each panellist placed their rack of sample jars into a Pyrex dish of pre-heated water (Cimarec Hot Plate, Model HP131225; Barnstead International, Dubuque, IA, USA) set to 52°C. Attribute ratings were collected electronically (Compusense Inc.) using nine-point descriptive scales for initial and overall tenderness (1=extremely tough and 9=extremely tender), initial and sustainable juiciness (1=extremely dry and 9=extremely juicy), beef flavour intensity (1=extremely bland and 9=extremely intense), off-flavour intensity (1=extremely intense off flavour and 9=no off flavour) and amount of connective tissue (1=abundant and 9=none detected). Initial tenderness was rated on the first bite through the cut centre surface with the incisors; initial juiciness was rated after three to five chews with the molars; beef flavour intensity, off-flavour intensity and amount of connective tissue were rated between 10 and 20 chews, and overall tenderness, and sustainable juiciness were rated before expelling. All panel evaluations were conducted in well-ventilated partitioned booths, under red lighting (124 lux). Distilled water and unsalted soda crackers were provided to purge the palate of residual flavour notes between samples.
Statistical analysis
Data were analysed using the PROC MIXED procedure of SAS (2009). The statistical model used for animal performance data included diet as the fixed effect, and pen nested within diet as the random effect. Data analysis for carcass traits, meat quality, FA profiles included the fixed effect of diet and random effects of slaughter date and pen nested within diet. For the sensory attributes the model also included panellist as a random effect. The LT WBSF and retail display data were analysed with a repeated measures design, with diet, day and their interactions as main effects, slaughter date and pen nested within diet as random effects, and day as the repeated factor. When the random effect of pen nested within diet was not significant, it was removed from carcass traits, meat quality, sensory attributes and FA models and individual animal was used as the experimental unit (Gill et al., Reference Gill, VanOverbeke, Depenbusch, Drouillard and DiCostanzo2008). Treatment means were generated and separated using the LSMeans and PDIFF options, respectively. The significance threshold for all statistical analyses was set at P<0.05.
Results and discussion
Composition of the experimental diets
The SS diet had increased amounts of ADF, NDF, crude fat, calcium content and reduced digestible energy compared with the control diet (Table 1). The DDGS-15 diet had similar ADF, NDF, calcium content and digestible energy compared with the control diet and the DGGS-30 had less ADF, NDF, calcium and greater digestible energy. The DDGS-15 and DDGS-30 diets had higher CP and phosphorus content compared with the SS and control diets. The SS diet had larger proportions of 18:2n-6, c9-18:1 and smaller proportions of 18:3n-3 and 16:0 than the control diet. Overall, the DDGS-15, DDGS-30 and SS diets had similar FA proportions.
Animal performance
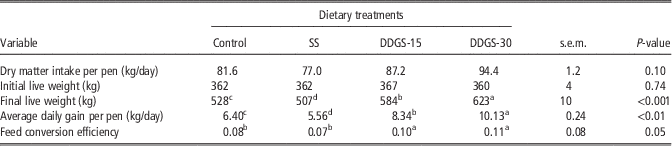
During the feeding period, steers fed the DDGS-30 diet tended (P=0.10) to have the highest DMI, followed by steers fed DDGS-15, control and SS diets (Table 2). These results could be related to the fibre (NDF and ADF) content reported for the respective diets. High fibre content increases physical rumen fill, which in turn depresses DMI (Allen and Grant, Reference Allen and Grant2000). In addition, the inclusion of DDGS, a non-forage fibre source as a partial replacement for forage (RCS) probably reduced dietary particle size and increased DMI because of a faster passage rate (Allen and Grant, Reference Allen and Grant2000).
Effects of diet on dry matter intake and growth performance of yearling steers
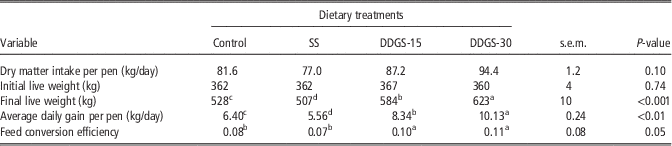
SS=sunflower seed; DDGS-15=15% wheat dried distillers’ grain with solubles+sunflower seed; DDGS-30=30% wheat dried distillers’ grain with solubles+sunflower seed.
a,b,c,dMeans with different superscripts for a particular animal performance trait are significantly different (P<0.05).
Steers fed the DDGS-30 diet had the greatest final live weights and ADG followed by steers fed the DDGS-15, control and SS diets (P<0.05; Table 2). The finding that growth performance of steers fed the SS diet was inferior to those fed the control diet could be related to relatively lower digestible energy and a trend for decreasing DMI reported for the former diet. The improvements in growth performance observed when feeding DDGS-15 and DDGS-30 diets as opposed to the diet containing SS may be in part explained by increasing levels of digestible energy and dietary CP as DDGS inclusion rate increased. The superior growth performance reported for steers fed the DDGS-15 and DDGS-30 diets relative to those fed the SS diet could also be related to increases in the digestible fibre fraction, which positively affects ruminal and post-ruminal fibre digestion (Schoonmaker et al., Reference Schoonmaker, Trenkle and Beitz2010) and consequently glucose absorption and utilisation. Feeding diets containing DDGS increased feed conversion efficiency compared with the SS and control diets (P<0.05; Table 2).
Carcass attributes and LT quality
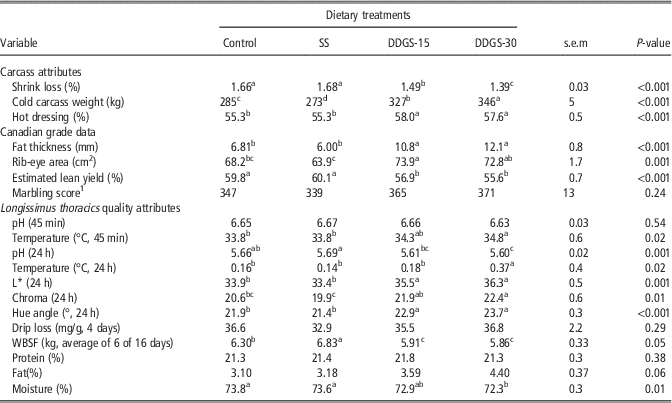
At 24 h postmortem, steers fed the DDGS-30 diet had the heaviest cold carcass weights followed by steers fed the DDGS-15, control and SS diets (P<0.05; Table 3). Steers fed the SS and control diets had similar (P>0.05) hot dressing percentage, fat thickness, rib-eye area and lean yield percentage. However, steers fed the DDGS-15 and DDGS-30 diets had greater (P<0.05) hot dressing percentage, fat thickness, rib-eye area and lower (P<0.05) lean yield percentage relative to steers fed the SS diet. These results are a reflection of the growth performance results reported for the respective diets. Steers fed the SS and control diets had the greatest shrink losses followed by steers fed the DDGS-15 and DDGS-30 diets (P<0.05). Although marbling scores were not influenced (P>0.05) by diet, a trend for increased i.m. fat content (P=0.06) was noted. The observation that feeding DDGS reduced shrink losses and lean yield could be associated with greater fat thickness reported for these diets. Relative to muscle, fat has low water content and thermal conductivity (Baghe-Khandan et al., Reference Baghe-Khandan, Okos and Sweat1982), which makes it less susceptible to water loss.
Effects of diet on carcass and meat quality attributes of yearling steers
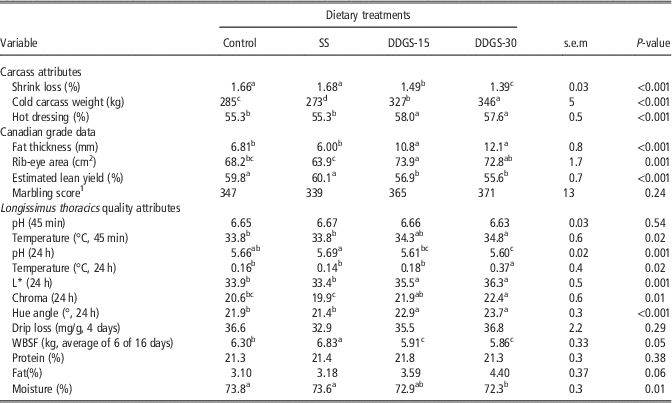
SS=sunflower seed; DDGS-15=15% wheat dried distillers’ grain with solubles+sunflower seed; DDGS-30=30% wheat dried distillers’ grain with solubles+sunflower seed; WBSF=Warner–Bratzler shear force.
a,b,cMeans with different superscripts for a particular variable are significantly different (P<0.05).
1 Marbling score terminology: 100, devoid; 200, practically devoid; 300, trace; 400, slight; 500, small; 600, modest; 700, moderate; 800, slightly abundant; 900, moderately abundant; 1000, abundant; 1100, very abundant.
Steers fed the DDGS-30 diet had the highest LT temperature at 45 min followed by steers fed the DDGS-15 diet, and steers fed the SS and control diets had the lowest temperatures (P<0.05). At 24 h, steers fed the DDGS-30 diet had higher LT temperatures compared with steers fed other diets (P<0.05). Diet had no effect on LT pH at 45 min (P>0.05) but influenced LT pH at 24 h. Overall, steers fed the SS and control diets had higher (P<0.05) LT pH values at 24 h than steers fed DDGS-15 and DDGS-30 diets. Feeding diets containing DDGS produced meat with lighter, more yellow–red and a more saturated colour (higher L*, hue angle, chroma; P<0.05) compared with meat from steers fed the SS and control diets. The higher ADG and carcasses weight when feeding increasing levels of DDGS led to slower chilling rates and likely maintained glycolytic activity resulting in lower pH, and lighter and more yellow–red colour (Aalhus et al., Reference Aalhus, Janz, Tong, Jones and Robertson2001). A tendency for increased i.m. fat content (P=0.06) observed for steers fed diets containing DDGS partly accounts for the higher L* and shift towards a more yellow–red meat colour reported for these steers (Aalhus et al., Reference Aalhus, Janz, Tong, Jones and Robertson2001). Changes in the composition of muscle fibre types owing to differences in live weight and rates of BW gain could also be responsible for the observed disparities in meat colour. Increased muscling (Greenwood et al., Reference Greenwood, Harden and Hopkins2007) has been shown to increase expression of ‘white’ (type II) glycolytic myofibres as opposed to ‘red’ (type I) oxidative myofibres. During postmortem metabolism, type II fibres yield high concentrations of lactic acid that accelerates the meat acidification process and as a result produce meat with a lighter colour.
The LT WBSF at 6 or 16 days post-slaughter was affected by day and diet (P<0.05) but their interaction was not significant (P>0.05). As expected, average shear force decreased over time from 7.0 kg on day 6 to 5.5 on day 16 (P<0.05). Steers fed the SS diet had the greatest WBSF values, followed by steers fed the control diet, and steers fed the DDGS-15 and DDGS-30 diets had the lowest values (P<0.05). These findings could be a result of the differences in LT pH, chilling rates and LT fat content observed across treatments and agree with earlier findings by Aalhus et al. (Reference Aalhus, Janz, Tong, Jones and Robertson2001). At pH below 6.0, increased tenderness as a result of slower chilling rates in beef are related to increased protease activity, sarcomere length and calcium-induced weakening of myofibrillar protein structures (Aalhus et al., Reference Aalhus, Janz, Tong, Jones and Robertson2001).
No effect (P>0.05) of diet was observed on drip loss and LT protein content, but as previously mentioned i.m. fat content tended to increase (P=0.06) with increasing levels of DDGS. These findings may in part be associated with the observed differences in dietary fat, which influence post-ruminal starch digestibility and consequently affect glucose absorption and i.m. fat deposition (Schoonmaker et al., Reference Schoonmaker, Claeys and Lemenager2013). Overall, LT from steers fed the DDGS containing diets had lower (P<0.05) moisture content compared with steers fed the SS and control diets (Table 3). These findings may be explained by low LT pH and a trend for increased LT fat content observed for these diets. Low muscle pH largely reduces muscle moisture content by reducing water holding capacity (Byrne et al., Reference Byrne, Bredie, Bak, Bertelsen, Martens and Martens2001).
LT steak retail display
Overall, changes in LT L*, chroma, hue angle, MetMb, Mb and MbO2 occurring over 4 days of retail display were not different between treatments (P>0.05).
LT FAs
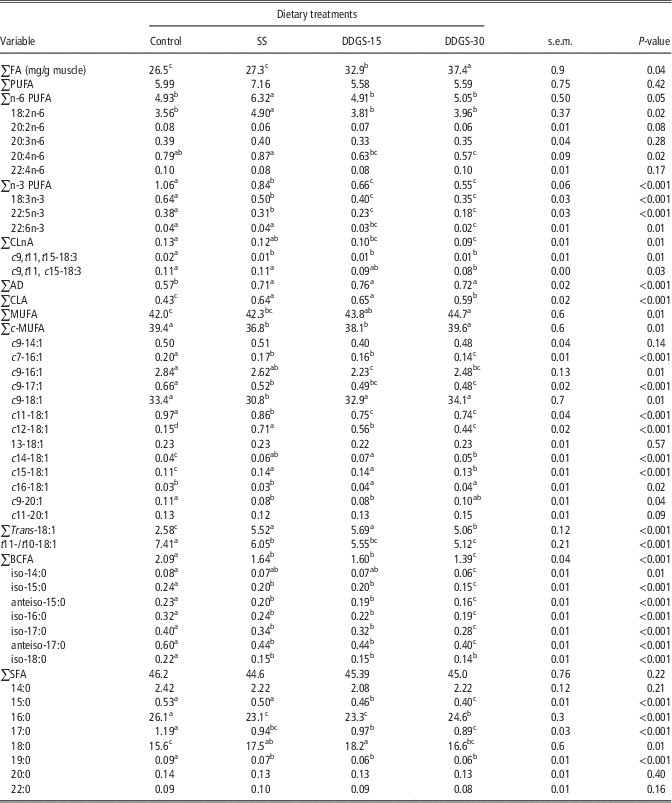
Total LT FA content for steers fed the SS and control diets was similar (P>0.05; Table 4). However, steers fed the DDGS-30 and DDGS-15 had greater (P<0.05) total FA content than steers fed the SS diet. These findings correspond to a tendency for LT fat to increase with increasing levels of DDGS observed in the current study. As reported previously, these results could be a result of the observed differences in digestible energy and DMI across treatments.
Effects of diet on i.m. fatty acid profiles of yearling steers

SS=sunflower seed; DDGS-15=15% wheat dried distillers’ grain with solubles+sunflower seed; DDGS-30=30% wheat dried distillers’ grain with solubles+sunflower seed.
a,b,c,dMeans with different superscripts for a particular fatty acid profile are significantly different (P<0.05).
∑FA, total fatty acids in mg/g of meat; ∑PUFA, sum of polyunsaturated fatty acids=∑n-6 PUFA+∑n-3 PUFA; ∑n-6 PUFA=sum of 18:2n-6, 20:2n-6, 20:3n-6, 20:4n-6, 22:4n-6; ∑n-3 sum of 18:3n-3, 22:5n-3, 22:6n-3; ∑CLnA, sum of CLnA =c9,t11,t15-, c9,t11,c15-; ∑AD, atypical dienes=sum of t8,c12-, t8,c13-, c9,t12-, t9,c12-, t9,t12-/c9,t13-, c9,c15-, t11,c15-; ∑CLA, CLA=sum of t7,c9-, c9,t11-, t9,t11-, t11,c13-; ∑MUFA, sum of monosaturated fatty acids=∑c-MUFA+∑t-18:1; ∑c-MUFA=sum of c9-14:1, c7-16:1, c9-16:1, c9-17:1, c9-18:1, c11-18:1, c12-18:1, c13-18:1, c14-18:1, c15-18:1, c16-18:1, c9-20:1, c11-20:1; ∑t-18:1, sum of trans-18:1 isomers=t6-/t7/-t8-, t9-, t10-, t11-, t12-, t13-/t14-, t15-, t16-; t11-/t10-18:1, ratio of t11-18:1 to t10-18:1; ∑BCFA, branched-chain fatty acids=sum of iso-14:0, iso-15:0, anteiso-15:0, iso-16, iso-17:0, anteiso-17:0, iso-18:0; ∑SFA=sum of 14:0, 16:0, 18:0, 20:0; 22:0.
There was no treatment effect (P>0.05) on the proportions of total PUFA. For all the diets, 18:2n-6 and 18:3n-3 were the major n-6 and n-3 PUFA isomers accounting for 70% to 80% and 60% to 65% of total n-6 and n-3 PUFA, respectively. Overall, feeding the SS diet resulted in greater (P<0.05) LT proportions of total and individual (18:2n-6, 20:4n-6) n-6 PUFA compared with other diets (Table 4). These findings may be explained by a combination of high dietary 18:2n-6 and low total LT FA content observed when feeding the SS diet. Overall, the levels of PUFA in meat increases with decreasing i.m. fat content owing to less dilution with de novo synthesised FA (De Smet et al., Reference De Smet, Raes and Demeyer2004).
Barley grain as opposed to SS (Gibb et al., Reference Gibb, Owens, Mir, Mir, Ivan and McAllister2004), and RCS as opposed to DDGS (Glasser et al., Reference Glasser, Doreau, Maxin and Baumont2013) have relatively higher concentrations of 18:3n-3. On the whole, the proportions of total and individual n-3 PUFA were greatest in steers fed the control diet, followed by steers fed the SS diet and steers fed the DDGS-15 and DDGS-30 diets had the lowest proportions (P<0.05; Table 4). These findings could, therefore, be linked to the replacement of barley grain with SS and RCS with DDGS in the control diet. In contrast to current findings, substituting DDGS for barley silage (He et al., Reference He, Yang, Dugan, Beauchemin, McKinnon and McAllister2012) or grain (Aldai et al., Reference Aldai, Dugan, Aalhus, McAllister, Walter and McKinnon2010b) has been found to increase the level of 18:3n-3 in beef tissues. The disparities between these studies could be mainly because 18:3n-3 in DDGS is higher than that in barley silage or grain but lower than that in RCS. The n-3 PUFA, particularly 18:3n-3, 20:5n-3 (EPA) and 22:6n-3 (DHA) have the ability to moderate CVD, cancer and immune system disorders, and improve maternal and offspring health, growth and development, cognitive function and psychological status in humans (Pelliccia et al., Reference Pelliccia, Marazzi, Greco, Franzoni, Speziale and Gaudio2014). Consequently, changes in their amounts in foods such as beef can have important nutritional and health implications, particularly in regions where long chain n-3 FA from marine sources are not consumed.
The first step leading to 18:3n-3 biohydrogenation is isomerisation to conjugated linolenic acid (CLnA), and of the CLnA isomers found in LT, c9,t11, c15-18:3 was the major isomer constituting 85% to 90% of total CLnA across the diets and this is consistent with the study of Nassu et al. (Reference Nassu, Dugan, He, McAllister, Aalhus, Aldai and Kramer2011). Similar to 18:3n-3, the proportions of total and individual CLnA isomers were generally greater (P<0.05; Table 4) in steers fed the control diet than in steers fed diets containing SS and DDGS. Cell culture and animal model studies have revealed that plant-derived CLnA isomers have anti-inflammatory, immune-modulatory, anti-obesity and anti-carcinogenic properties (Hennessy et al., Reference Hennessy, Ross, Devery and Stanton2011). Reductions in CLnA when adding SS and DDGS to diets might, therefore, be viewed as negative.
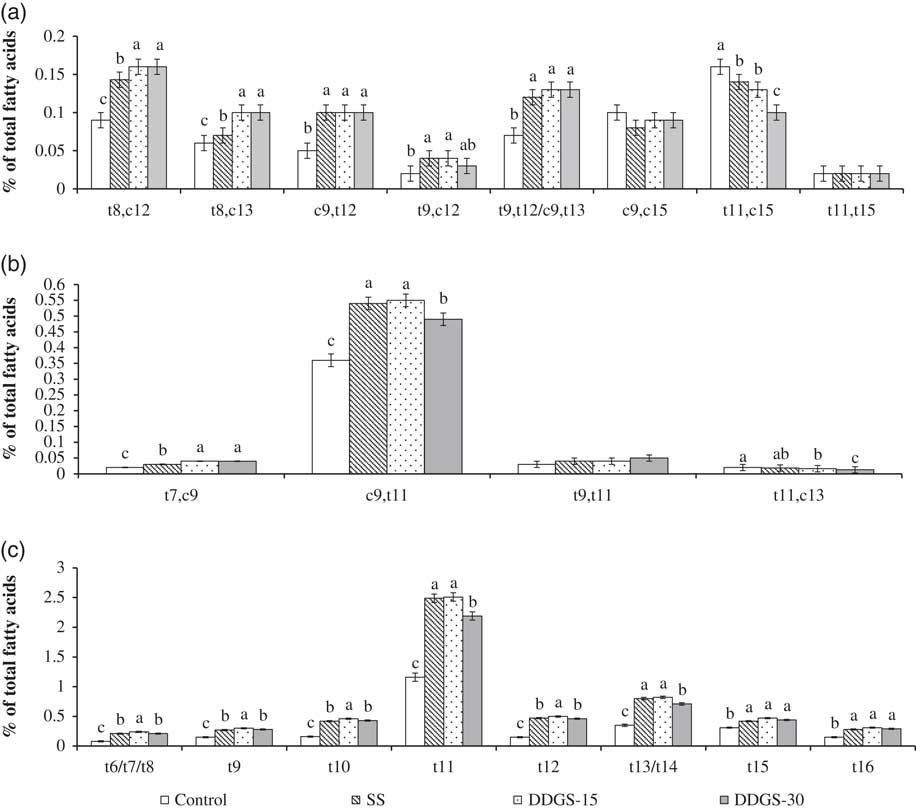
After the isomerisation of 18:3n-3 to CLnA, the next step in its ruminal metabolism is hydrogenation to t11,c15-18:2 as its major AD. Adding SS and then increasing amounts of DDGS in the diet, and thus lower proportions of dietary 18:3n-3, led to reductions in LT proportions of t11,c15-18:2 (P<0.05, Figure 1a). On the contrary, t8,c12-18:2 was also a dominant isomer found across all diets, but its proportions were increased by addition of SS and then increasing amounts of DDGS (P<0.05). In parallel, proportions of several other AD isomers with the first double bond at carbon 8 or 9 from the carboxyl end (t8,c12-, t8,c13-; c9,t12-, t9,c12-, t9,t12-/c9,t13-18:2; Figure 1a) were also increased when SS and DDGS were added to diets, as these are likely 18:2n-6 BHP. These results mirror previous studies when feeding diets containing RCS plus SS (Mapiye et al., Reference Mapiye, Aalhus, Turner, Rolland, Basarab, Baron, McAllister, Block, Uttaro, Lopez-Campos, Proctor and Dugan2013a) or wheat DDGS (Aldai et al., Reference Aldai, Dugan, Aalhus, McAllister, Walter and McKinnon2010b; Dugan et al., Reference Dugan, Aldai, Kramer, Gibb, Juárez and McAllister2010). The greater (P<0.05) proportions of t8,c12- and t8,c13-18:2 found when feeding DDGS-15 and DDGS-30 diets as opposed to the SS diet may be ascribed to higher DMI and passage rates associated with DDGS (Allen and Grant, Reference Allen and Grant2000). The relative benefit or risk to human health of consuming the individual AD isomers are yet to be elucidated, and thus recommendations to either enrich or deplete these isomers should be reserved until their effects are known.
Effects diet on atypical dienes (a), CLAs (b) and trans-18:1 isomers (c) from i.m. fat of yearling steers. Each bar represents mean±s.e.m.
a,b,cMeans with different superscripts for a particular fatty acid profile are significantly different (P<0.05).
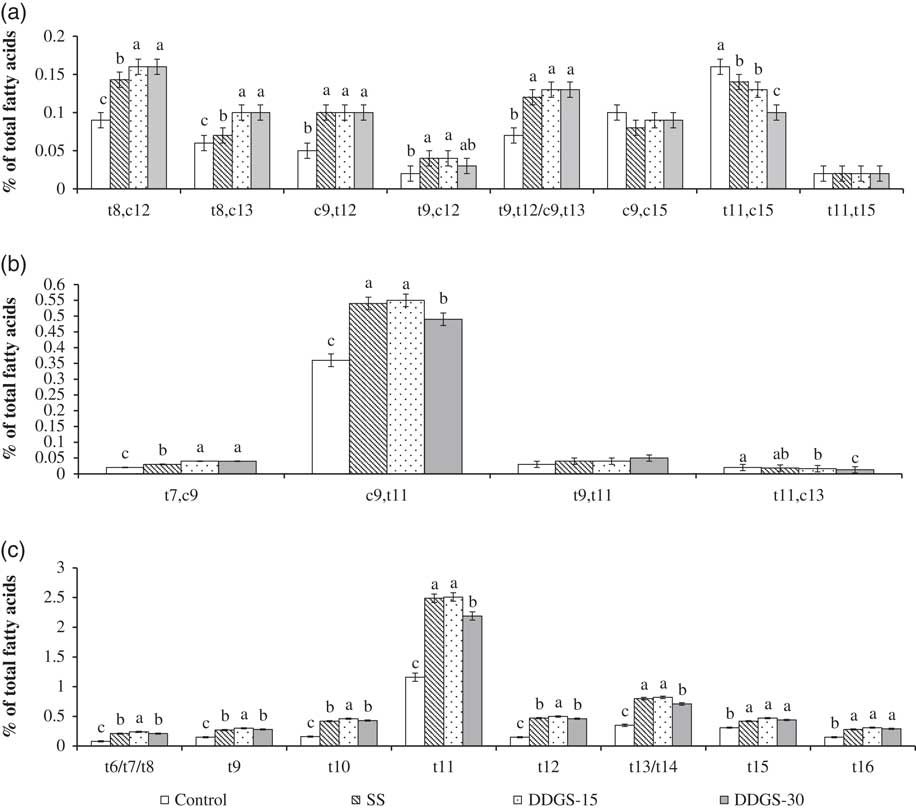
Rumenic acid was the major CLA isomer representing 80% to 85% of total CLA in all the diets (Figure 1b). Like AD isomers likely derived from 18:2n-6, the proportions of total CLA (Table 4), t7,c9-, c9,t11- (rumenic acid) and t9,t11-CLA (Figure 1b) were elevated (P<0.05) by feeding SS and DDGS containing diets. As reported for other BHP likely derived largely from 18:3n-3, the proportions of t11,c13-CLA were greatest in the control diet and declined with addition of SS and increasing levels of DDGS in the diet (P<0.05; Figure 1b). This parallels changes in t11,c15-18:2 and is consistent with findings of Hino and Fukuda (Reference Hino and Fukuda2006), who demonstrated t11,c13-CLA can be formed by isomerisation of t11,c15-18:2, the major AD isomerisation product of 18:3n-3. Considering all diene BHP together (i.e. AD and CLA), feeding SS as a source of 18:2n-6 resulted in rumenic acid as the major BH product, increasing its content 0.5 fold over control. The proportion was, however, lower (1.5%) than previously attained when feeding a similar diet (Mapiye et al., Reference Mapiye, Aalhus, Turner, Rolland, Basarab, Baron, McAllister, Block, Uttaro, Lopez-Campos, Proctor and Dugan2013a). Differences may relate to a slightly lower crude fat level in the diet, or perhaps differences in composition or quality of other dietary components. At any rate, being able to consistently accumulate high contents of rumenic acid in beef will not only require the right dietary ingredients, but their consistent composition and quality. A positive aspect of the present study, however, was that additions of DDGS to the SS diet improved aspects of meat quality while maintaining relatively high proportions of rumenic acid.
The amount of total monounsaturated FA (MUFA) in LT was affected by diet, with substituting SS for barley in the control diet resulting in no change, but further substitutions to include DDGS resulting in greater proportions of total MUFA (P<0.05, Table 4). Changes in total c-MUFA and t-18:1 did not, however, parallel changes in total MUFA. Substituting SS in the control diet reduced (P<0.05) total c-MUFA and further substitutions with DDGS brought the proportion of total c-MUFA back up to equal proportions compared with the control diet (P>0.05). The proportion of total t-18:1 in LT, however, increased when substituting SS in the control diet, and additions of DDGS led to a lowering of t-18:1, but still greater proportions compared with the control diet (P<0.05). Increases in proportions of total t-18:1 when substituting SS in the control diet, and when including additional DDGS almost certainly result from PUFA additions to the diet, and their BH through to t-18:1. Changes in c-MUFA are more difficult to explain because of the potential dietary/ruminal and endogenous origin for many isomers.
Changes in total c-MUFA were paralleled by changes in c9-18:1 as the major c-MUFA, with substituting SS in the control diet resulting in a reduced proportion, and feeding the DDGS-15 increased the proportions but DDGS-30 led to no further changes. This was inversely related to the proportion of total PUFA, which may have displaced c-MUFA or suppressed Δ-9 desaturase activity and c9-18:1 synthesis. In general, for the remaining c-MUFA, when the double bond was located at carbon 11 or closer to the carboxyl end, substituting SS in the diet reduced (P<0.05) their proportions and further substitutions with DDGS either resulted in no further changes or increases back to control levels. Cis-MUFA with double bonds at carbon 12, 14, 15 or 16, however, were increased (P<0.05) by substituting SS in the control diet, with reductions, but not back to control proportions with further addition of DDGS to the diet. Changes in individual c-MUFA with double bonds from carbon 7 to 11 thus appear to be influenced more by diet and endogenous FA synthesis, while c-MUFA with double bonds from carbons 12 to 16 are likely more influenced by diet alone and their accumulation is proportional to the PUFA level in the diet. In support of this, it is known that increasing PUFA in the diet is able to suppress BH leading to accumulation of intermediate products (Shingfield et al., Reference Shingfield, Bonnet and Scollan2013).
Changes in total t-18:1 (Table 4) were paralleled by most individual isomers, with substitution of SS in the control diet increasing proportions and progressive additions of DDGS to the diet leading to further change or slightly reducing their proportions (Figure 1c). Across diets, t11-18:1 was the dominant t-18:1 isomer representing 45% of total isomers. As we had anticipated, adding SS to the control diet led to a sizeable increase (1.2-fold) in vaccenic acid, but the response was not as dramatic as we had achieved previously when feeding a similar diet (Mapiye et al., Reference Mapiye, Aalhus, Turner, Rolland, Basarab, Baron, McAllister, Block, Uttaro, Lopez-Campos, Proctor and Dugan2013a). Again, as for rumenic acid, differences may relate to a slightly lower crude fat level in diets with added PUFA, or perhaps because of differences in composition or quality of other dietary components. Again, being able to consistently accumulate high contents of vaccenic acid in beef will not only require the right dietary ingredients, but their consistent composition and quality. On the positive side again, the additions of DDGS to the diet improved meat quality while maintaining relatively high proportions of vaccenic acid, which is another targeted BH product for increase as it is a precursor for rumenic acid and may have independent beneficial health effects including reducing pro-inflammatory cytokines and platelet aggregation in humans (Wang et al., Reference Wang, Jacome-Sosa and Proctor2012).
Steers fed the control diet had the greatest proportions of total and individual (iso-14, iso-/anteiso-15, iso-16, iso-/anteiso-17; iso-18) branched-chain FA (BCFA) and individual odd-chain saturated FA, and in general substituting SS in the control diet reduced their contents (P<0.05), and further addition of DDGS to the 30% level led to further reductions (P<0.05; Table 4). This could be because of the differences in amount and proportion of dietary 18:2n-6. Overall, odd-chain FA and BCFA in animal fat are primarily derived from rumen microbes compared with de novo synthesis (Vlaeminck et al., Reference Vlaeminck, Fievez, Cabrita, Fonseca and Dewhurst2006). The decrease in odd-chain FA and BCFA in the current study may, therefore, largely related to a direct inhibition of 18:2n-6 on rumen microbes (Vlaeminck et al., Reference Vlaeminck, Fievez, Cabrita, Fonseca and Dewhurst2006) and the reduction of propionate production from readily fermentable starch in the rumen (Pethick et al., Reference Pethick, Harper and Oddy2004). Propionate and its carboxylation product methylmalonate are primers for the biosynthesis of odd-chain FA and BCFA, respectively (Vlaeminck et al., Reference Vlaeminck, Fievez, Cabrita, Fonseca and Dewhurst2006). Interest in evaluating BCFA in beef largely relates to its potential to reduce cancer in humans (Wongtangtintharn et al., Reference Wongtangtintharn, Oku, Iwasaki and Toda2004).
There were no differences in proportions of total saturated fatty acids (SFA) in LT across diets (P<0.05). The most abundant SFA was 16:0, which constituted about 50% to 55% of the total SFA (Table 4). The proportions of 16:0 were greatest in steers fed the control diet, and substituting SS in the control diet reduced its proportion (P<0.05), and further substitution with DDGS increased the proportion but not back to control levels. These results could be related to the dietary proportions of 16:0 that exhibited similar trends or may also in part be related to depression of de novo FA synthesis by increased levels of 18:2n-6 (Shingfield et al., Reference Shingfield, Bonnet and Scollan2013). The proportions of 18:0 were increased when substituting SS in the control diet (P<0.05), and is consistent with higher proportions found in the SS diet. A further increase in 18:0 when feeding the DDGS-15 diet, and decrease when feeding the DDGS-30 are difficult to interpret, and likely relate to influences of both dietary contents and rates of complete BH of PUFA to 18:0. Overall, the substitution of SS in the control diet, and further additions of DDGS would be seen as positive as reduced proportions of 16:0 in beef are desirable from a consumer’s point of view because it has been reported to increase CVD risk while 18:0 effects are neutral (Shingfield et al., Reference Shingfield, Bonnet and Scollan2013).
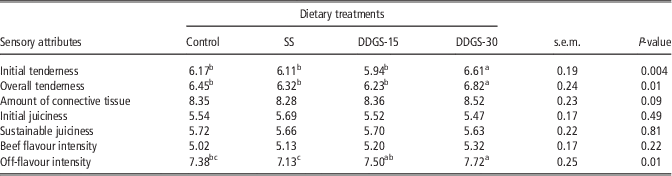
Sensory attributes
The substitution of SS in the control diet did not influence (P>0.05) any measured sensory attributes of LT (Table 5). Further substitution of DDGS into the diet at the 30% level improved initial tenderness, overall tenderness and reduced off-flavour intensity compared with the SS diet (P<0.05). Changes in tenderness may be related to lower muscle pH and a trend for increased LT fat content reported for the DDGS-30 diet. Differences in off-flavour intensity ratings may be associated with lower proportions of n-3 PUFA in LT when feeding DDGS. Overall, PUFA have been related to off flavours in beef, but these are typically associated with the oxidation products of n-3 PUFA because they have more double bonds and are more readily oxidised compared with n-6 and n-9 PUFA (Elmore et al., Reference Elmore, Campo, Enser and Mottram2002). It should be noted, however, that absolute changes in sensory attributes were small (<1 panel unit) and would not likely be detectable by the untrained consumer.
Effects of diet on sensory attributes of meat from yearling steers

SS=sunflower seed; DDGS-15=15% wheat dried distillers’ grain with solubles+sunflower seed; DDGS-30=30% wheat dried distillers’ grain with solubles+sunflower seed.
a,b,cMeans with different superscripts for a particular sensory attribute are significantly different (P<0.05).
Attribute scores followed a nine-point descriptive scale for initial and overall tenderness (9=extremely tender; 1=extremely tough), initial and sustainable juiciness (9=extremely juicy; 1=extremely dry), beef flavour (9=extremely intense; 1=extremely bland/none), off-flavour intensity (9=extremely bland/none; 1=extremely intense) and residual mouth coating (9=no mouth coating; 1=extreme mouth coating).
Conclusions
Feeding the SS diet as opposed to the control diet had no effect on carcass and meat quality traits but increased growth rates, proportions of t-18:1 isomers, AD and CLA isomers with the first double bond from carbon 7 to 10 from the carboxyl end, n-6 PUFA and reduced proportions of n-3 PUFA, CLnA, BCFA, odd-chain SFA and 16:0. Substituting DDGS into the SS diet improved growth performance, carcass traits, meat quality and yielded similar proportions of FA. Feeding a combination of SS and DGGS in RCS-based diets, therefore, presents an opportunity to enhance beef production and quality while maintaining large proportions of healthful FA, especially vaccenic and rumenic acids in beef.
Acknowledgements
This research was funded by the Alberta Meat and Livestock Agency (ALMA). Drs C. Mapiye and T.D. Turner acknowledge the receipt of NSERC Fellowships funded through ALMA. Special thanks are extended to staff at the Lacombe Research Centre (LRC) Beef Unit of AAFC for animal care, animal management and sample collection. The slaughter and processing of the cattle by the LRC abattoir staff is gratefully acknowledged. Contributions of the meat grading and quality staff at the LRC to the results are appreciated. Ms I.L. Larsen is acknowledged for her valuable assistance in statistical analysis.