I. INTRODUCTION
Metal oxide-based nanostructured thin films have engrossed broad attention due to their exceptional properties such as large band gap, quantum confinements, high active surface area, and stability. The size and shape of nanostructures strongly influence the properties of materials.Reference Ahmad, Khatoon and Coolahan1 Zinc oxide (ZnO) is the n-type semiconductor holding large band gap (3.37 eV) and having large free exciton binding energy 60 meV. It has found potential applications in various fields due to its high reflectivity in infrared and high transparency in visible spectrum, superior gas sensing properties, and low resistance compared to other nanostructured thin films.Reference Özgür, Alivov, Liu, Teke, Reshchikov, Doğan, Avrutin, Cho and Morkoc2 Normally, the doping of the semiconductor with alkaline earth metals such as Mg, Ca, Sr, Ba, etc. could be used to modify its structural and optical properties according to the specific requirements. The investigations on alkaline earth metal doped ZnO thin films are on achieving enhanced room temperature ferromagnetism with huge magnetic moment.Reference Mahadeva, Quan, Fan, Albargi, Gehring, Riazanova, Belova and Rao3
Numerous reports by eminent researchers on various physical and chemical techniques are available in the literature for the growth of Mg-doped ZnO thin films, which include atomic layer deposition,Reference Li, Cho and Kwon4 PLD,Reference Park, Song, Ha and Park5 MBE,Reference Park, Yi and Jang6 sol–gel spin coating,Reference Hashim, Subramani, Devarajan and Ibrahim7 sputtering,Reference Karthick, Srinivasan and Christopher8 electrochemical deposition,Reference Han, Jeong, Heo, Shin, Ryu, Park, Lee, Yoon, Yang and Choi9 thermal evaporator,Reference Zhang, Lu, Ye, Zeng, Zhu and Huang10 CVD,Reference Peng, Guo, Ding, Xu, Li, Tan and Zhao11 spray pyrolysis,Reference Kurtaran, Aldag, Ofofoglu, Akyuz and Atay12 etc.
Mg-doped ZnO thin films have found numerous potential applications in photovoltaic cells, gas sensors, memory devices, etc. Rod-shaped Mg-doped ZnO thin films showed gas sensing properties prepared by radio frequency sputtering technique, deposited on the sapphire substrate.Reference Karthick, Srinivasan and Christopher8 Spherical-shaped Mg-doped ZnO grains prepared by spray pyrolysis have reported selective gas sensing behavior to detect ammonia.Reference Kulandaisamy, Reddy, Srinivasan, Babu, Mani, Shankar and Rayappan13 Amir et al. reported the very effective carbon monoxide chemical sensor-based on Mg-doped ZnO nanobelts.Reference Amin, Shah, Bhatti and Malik14 Recently, Mg added ZnO nanocomposite films were synthesized by the PLD method, which proposed to be used as the window layer of solar cells.Reference Kaushal and Kaur15 Also, the Mg-doped ZnO interface shows excellent activity for ultraviolet exciting time resolved photoluminescence.Reference Shimakawa, Hashimoto, Hayashi, Satoh and Negami16 It is sound recognized that the optical band gap of a semiconductor is strongly influenced by the particle sizes where an increase in energy gap is expected with the reduction of the grain size due to quantum confinement effects. The grain size in the nanostructured thin films can be easily tuned during the synthesis process by varying the growth parameters. Accordingly, we preferred the novel sol–gel process to achieve ZnO films in the presence of Mg by the spin coating method. In recent times, this technique has been adopted for the preparation of Mg & Al co-doped ZnO films of enhanced photocurrent.Reference Das, Roy, Dutta, Sen, Pramanik, Das, Banerjee and Bhattacharyya17
In the present article, pristine ZnO and Zn1−xMgxO (x = 0.00, 0.01, 0.05, 0.10, and 0.15) nanostructured films are synthesized on FTO by the sol–gel spin coating procedure. Numerous key properties were examined such as structure by X-ray diffraction, vibrational by Raman spectroscopy, surface morphology, elemental composition, and mapping by scanning electron microscopy/energy dispersive X-ray spectroscopy (SEM/EDX), optical properties by UV-Vis-NIR spectroscopy, and nonlinear optical properties by Z-scan technique.
II. EXPERIMENTAL METHOD
The synthesis of Zn1−xMgxO (x = 0.00, 0.01, 0.05, 0.10, and 0.15) (MZO) nanostructure films was carried out using the sol–gel spin coating method on FTO substrates. Identified quantity of 0.5 M zinc acetate dihydrate (Sigma Aldrich, St. Louis, Missouri) and magnesium acetate tetrahydrate (Sigma Aldrich) have been dissolved in 20 mL 2-methoxy ethanol (Sigma Aldrich). The resultant solution was magnetically stirred for 1 h at 60 °C to acquire consistent and light-yellow color gel. Finally, 299 μmL of mono ethanolamine was added into the above prepared solutions as the stabilizer and continued the stirring at previous temperature for additional 1 h to get more inclusive fraternization of additive into the freshly prepared solution. These solutions of Zn1−xMgxO (x = 0.00, 0.01, 0.05, 0.10, and 0.15) were filtered and reserved in light-free area for 48 h to acquire gel.
Pristine and Mg-doped ZnO (MZO) nanostructure films were coated on substrates of FTO coated glass by the spin coater unit (Brewer Science, Cee, Rolla, Missouri, precision spin coaters), at ∼2500 rpm for 30 s. After the deposition, films were kept on a hot plate at 120 °C for about ten minutes to eliminate the organic solvents in the deposited film, and this overall process was repeated 15 times to conquer anticipated thickness of films. Furthermore, all deposited Zn1−xMgxO (x = 1, 5, 10, and 15 wt%) films were consequently annealed at 450 °C for 2 h inside a furnace of high stability under oxygen flow.
The structural analysis of pristine/FTO and MZO/FTO films was examined by using a Shimadzu LabX XRD-6000X-ray diffractometer (Kyoto, Japan). Vibrational analysis was carried out through FT-Raman spectroscopy in the wave number range from 50 to 1500 cm−1 using a Thermo Scientific, DXR FTRAMAN spectrometer (Waltham, Massachusetts). The evaluation of nanostructure growth and surface morphology of prepared films was carried out using SEM (JSM 6360 LA, JEOL, Ltd., Tokyo, Japan) and AFM [NT-MDT (Type Next, Russia)] and studied grain magnitude and roughness by devoted NT-MDT software. The measurements of optical properties over a wide wavelength range, i.e., 200–1000 nm, were performed on a JASCO V-570 UV-Vis-NIR spectrophotometer. Third-order nonlinear and optical limiting investigations were performed through Z-scan measurements.
III. RESULTS AND DISCUSSION
A. Structural analysis
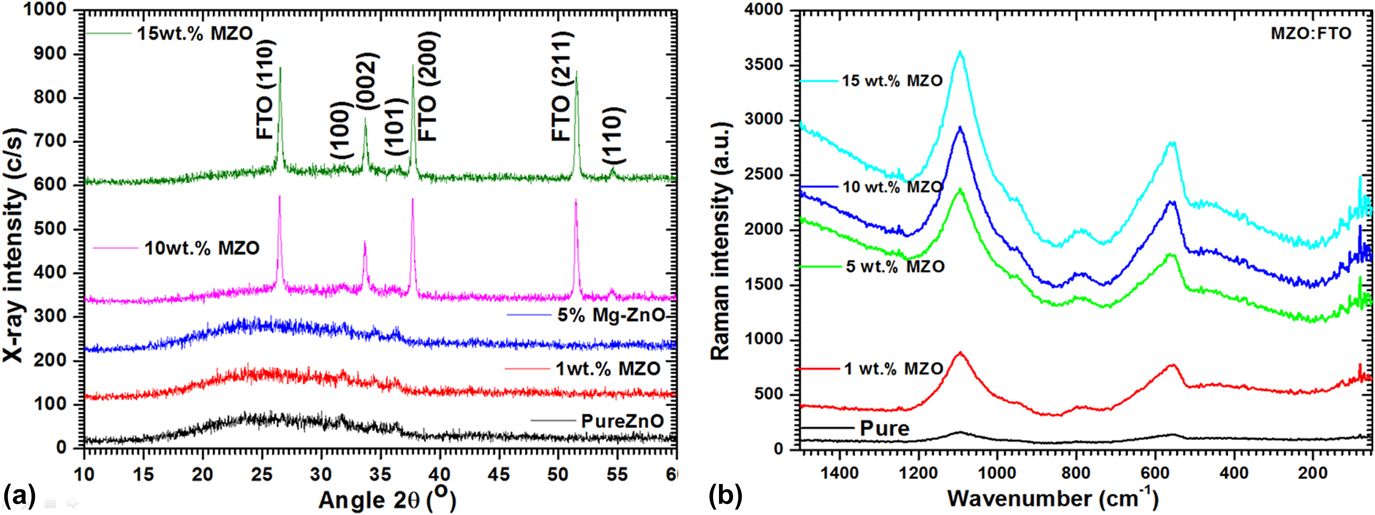
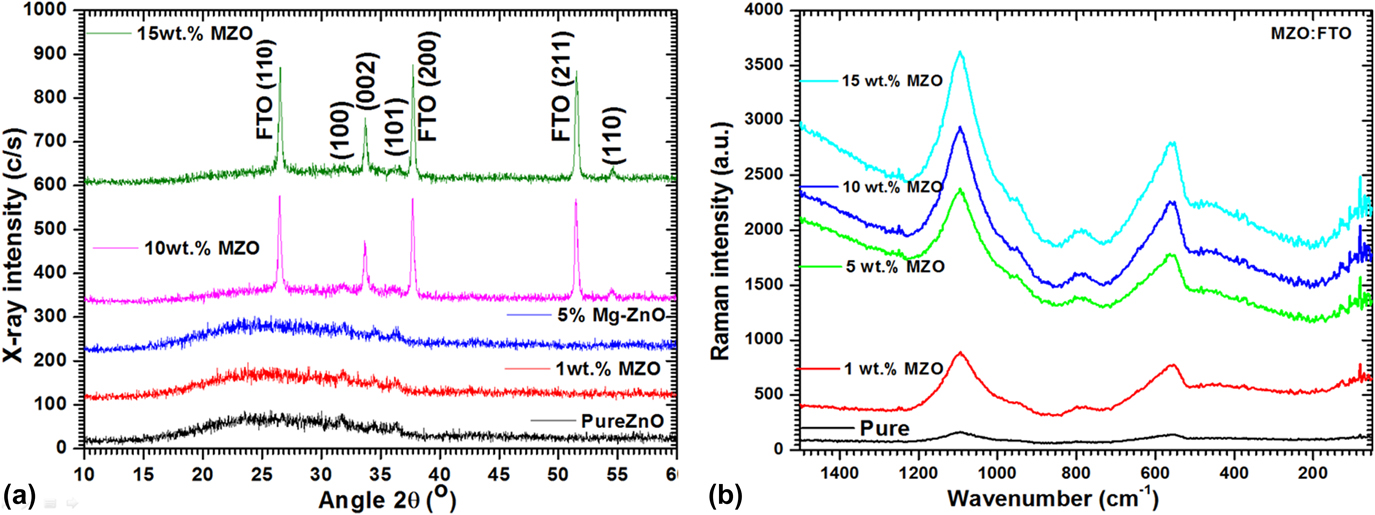
XRD diffractogram of pristine and MZO thin films is shown in Fig. 1(a). The respective positions of ZnO major peaks (100), (002), (001), and (110) (Zincite, JCPDS 36-1451) were observed from the recorded XRD patterns, which show that all the synthesized thin films were polycrystalline. The XRD peak (002) at 34.4° is dominant plane along with hexagonal wurtzite structure. Apart from the above observed peaks, supplementary peaks (110), (200), and (211) were observed at 2θ = 26.7°, 37°, and 52°, which correspond to the FTO substrate such as tin dioxide phase (JCPDS# 00-041-1445), the intensity of the FTO substrate peak increases with increasing Mg+2 doping concentrations.
(a) XRD patterns and (b) vibrational spectra for all deposited ZnO films.
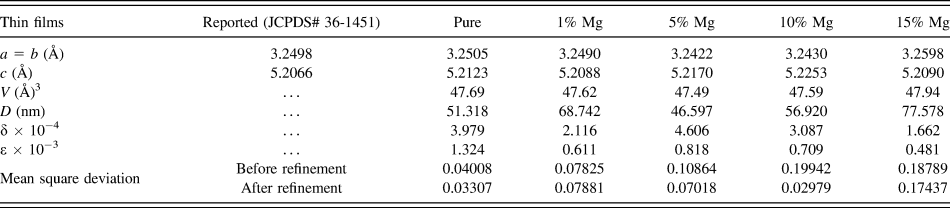
The grain sizes for the prepared pristine/FTO and MZO/FTO films were determined form the recorded XRD patterns by applying Debye Scherer formulaReference Shkir and AlFaify18–Reference Shkir, Yahia, Ganesh, Algarni and AlFaify20:  $D = {{k\lambda } \over {{\beta _{2\theta }}\cos \theta }}$, where β2θ is the FWHM, k is the coupling constant taken to be 0.9, λ is the wavelength used (1.5406 Å), and θ is the Bragg’s angle. The calculated values of lattice parameters and crystallite size of pristine/FTO and MZO/FTO films are found to be varying with Mg concentration and are given in Table I. This difference is attributed to diversity in relative ionic size of Mg2+ (0.72 Å) and Zn2+ (0.60 Å). Moreover, the density of dislocations and microstrain were also estimated through well-known relationsReference Shkir, Kilany and Yahia21,Reference Yahia, Shkir, AlFaify, Ganesh, Zahran and Kilany22 and are tabulated in Table I. The highest value of D was estimated for 15% MZO, and also values of dislocation density and lattice strain are reduced, which indicates good quality of deposited films.
POWDERX refined structural parameters of pristine/FTO and MZO/FTO films.

B. FT Raman analysis
FT-Raman spectra of pristine/FTO and MZO/FTO films are depicted in Fig. 1(b). The presence of vibrational bands at ∼1095 ± 2 cm−1, 950 ± 5 cm−1, and 790 ± 3 cm−1 are might be for the substrate. The Raman peak situated at ∼557 ± 3 cm−1 is allocated to A1 (LO) asymmetric mode, and this might be recognized to the contributions of lower and higher wavenumbers.Reference Bundesmann, Ashkenov, Schubert, Spemann, Butz, Kaidashev, Lorenz and Grundmann23,Reference Decremps, Pellicer-Porres, Saitta, Chervin and Polian24 However, this Raman peak is slightly shifted to the low wave number region compare to the bulk one. The Raman peak situated at ∼470 ± 5 cm−1 (E2 mode) is the fundamental mode of vibration for the ZnO hexagonal phase and also have shift in its position to higher wave number in contrast to films and bulk ZnO.Reference Decremps, Pellicer-Porres, Saitta, Chervin and Polian24,Reference Kumar, Valanarasu, Kathalingam, Ganesh, Shkir and AlFaify25 The possible reason behind this shift in position is the development of stress in films when deposited on the substrate, or may be due to variation in grain size due to doping. It can be visibly seen in the figure that the intensity and sharpness of Raman peaks are increased with Mg doping concentration, which indicates high crystallinity of films. All Raman peaks are found to be in well-agreement with previous reports.Reference Wei, Man, Liu, Xue, Zhuang and Yang26–Reference Ganesh, Yahia, AlFaify and Shkir28
C. Microstructure and EDX analysis
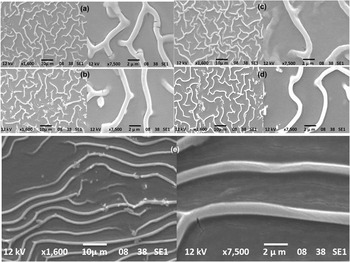
Figures 2(a)–2(e) exhibit the SEM micrographs of all pristine/FTO and MZO/FTO films. SEM images showed that the whole FTO substrate is roofed by uniformly grown smaller grains, revealing the smoothness of the surface for all pure and MZO/FTO thin films. The low-magnification image clearly shows the uniformity of the microstructure without any creaks and holes. On the other hand, at higher magnification, it can be detected that thin films are self-possessed of strongly packed and randomly arranged wire-like structures. Conferring to EDX elemental mapping results [see Fig. S1 (Supplementary Material)], magnesium is uniformly distributed over the entire surface of the prepared thin films on the FTO substrate.
SEM micrographs of (a) pristine/FTO, (b) 1%, (c) 5%, (d) 10%, and (e) 15% MZO/FTO films.

D. Linear optical properties
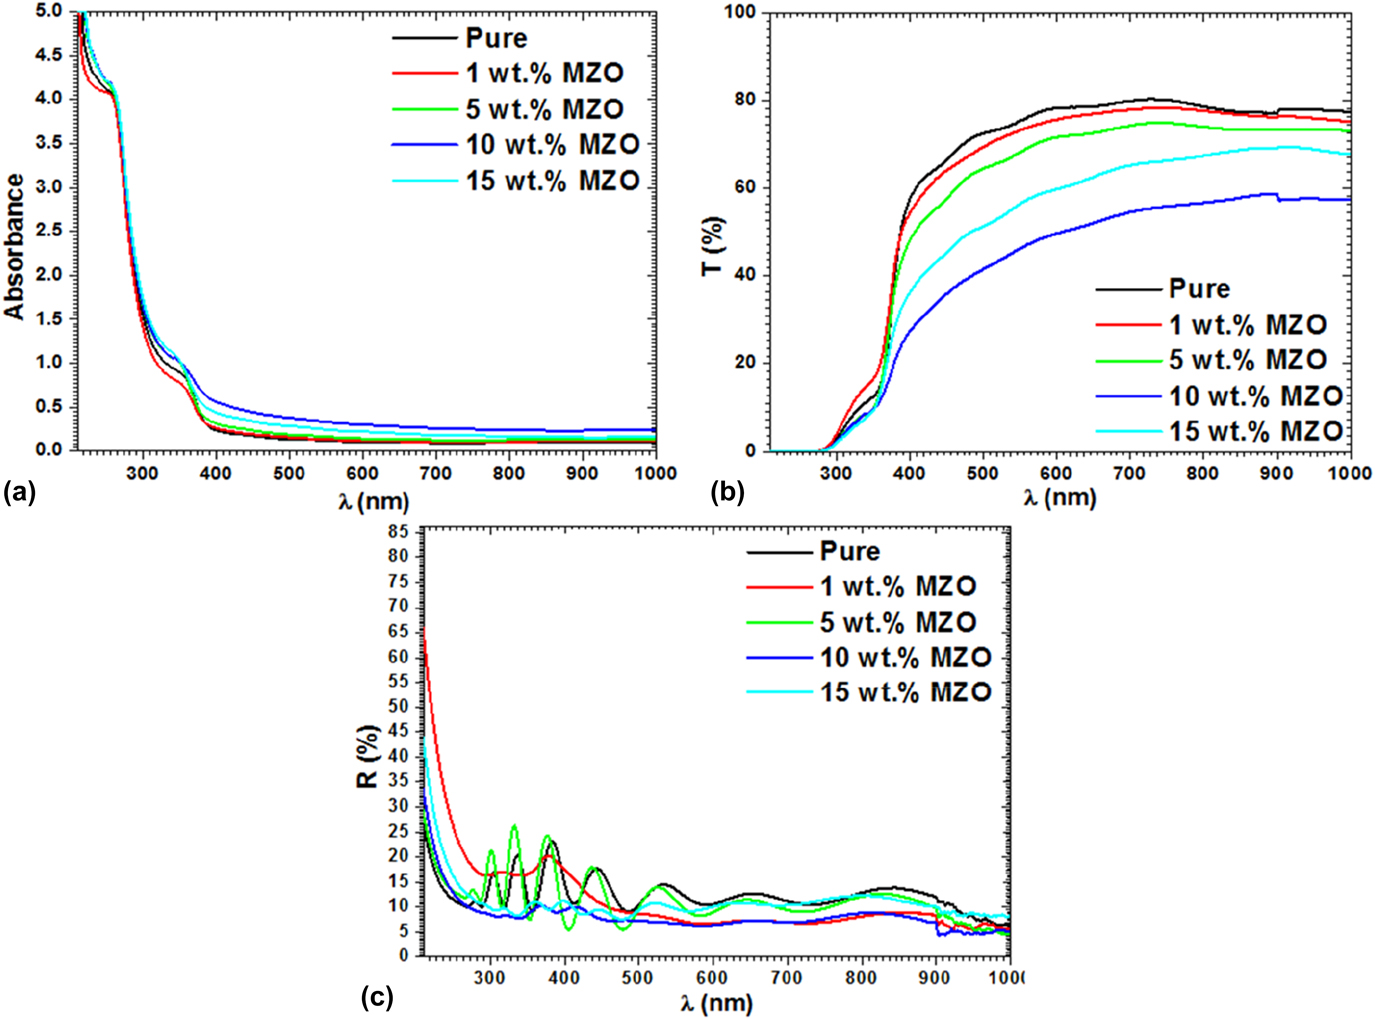
Figures 3(a)–3(c) exhibit absorption, transmittance, and reflectance plots of pristine/FTO and MZO/FTO films. The nanostructure films hold higher transparency in the visible range. Pristine ZnO displays transmittance ∼80% in the visible region, whereas this value is decreased for MZO films. Correspondingly, the absorption for pure ZnO film on FTO was found to be lower than that of MZO films. The transmittance spectra of films consist of interference fringes in the higher wavelength region, which might be due to manifold reflections at two film edges deposited on different substrates.Reference Springer, Rech, Reetz, Müller and Vanecek29 The films exhibited strong absorption in the UV, which is beneficial for various device fabrications. Analogous behaviors are detected in many metal oxide nanostructured films along with diverse dopants.Reference Shkir, Ganesh, AlFaify, Yahia and Zahran30
(a) Absorbance, (b) transmittance, and (c) reflectance of pristine and MZO films.

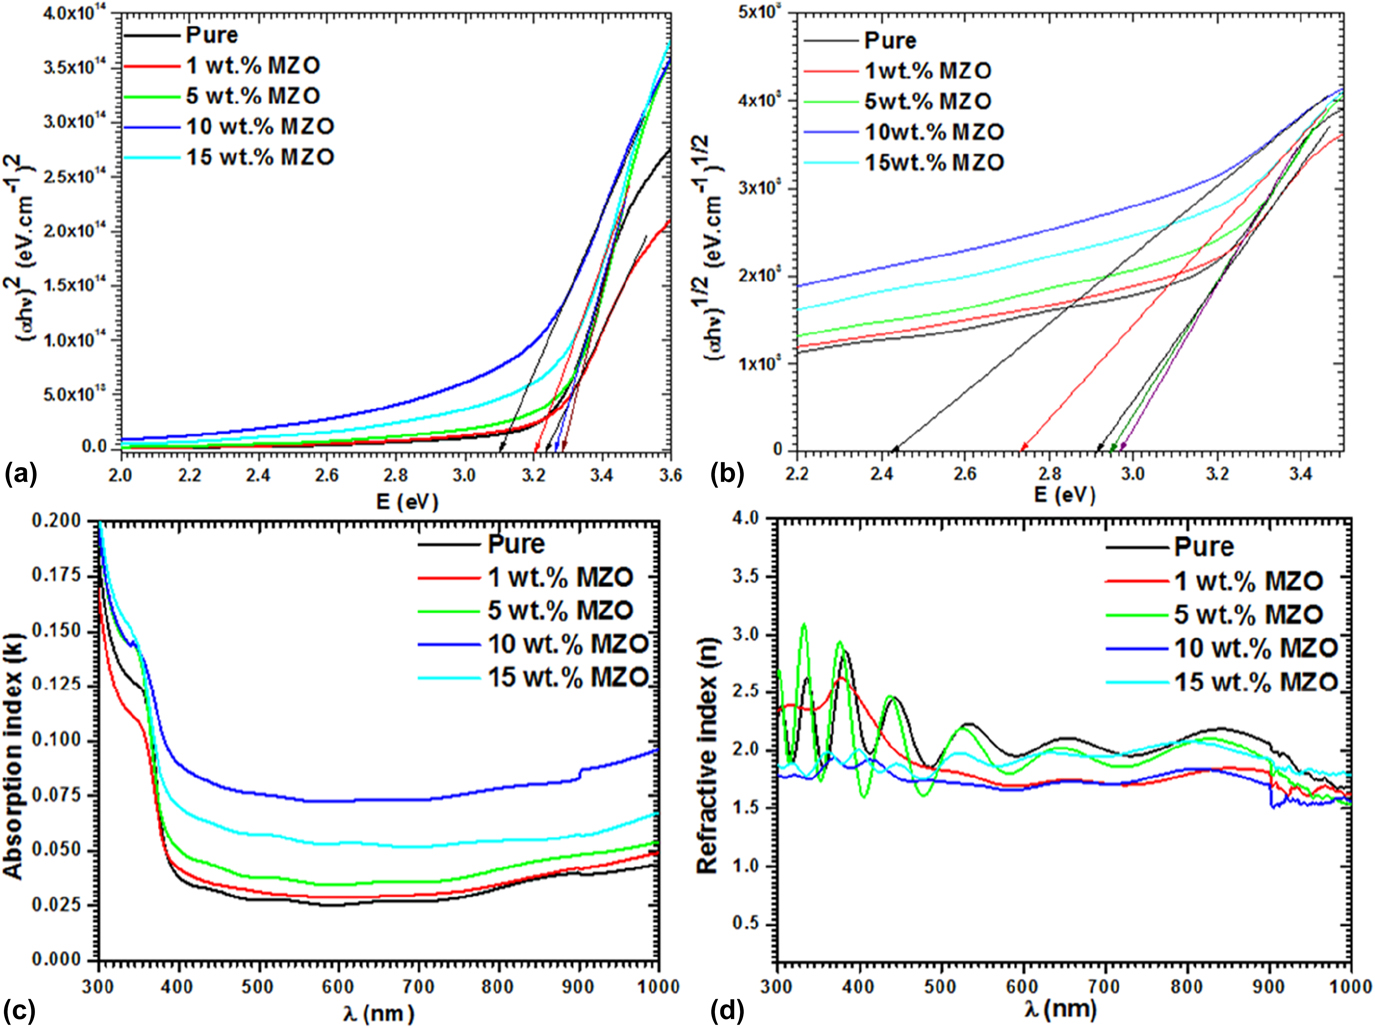
Direct and indirect band gap values of pristine/FTO and MZO/FTO films were obtained through Tauc’s relationReference Tauc, Grigorovici and Vancu31,Reference Shakir, Kushwaha, Maurya, Bhagavannarayana and Wahab32 : (αhν)1/m = A(hν − E g), where A is the fundamental constant, h is the plank’s constant, ν is the frequency, α is the absorbance coefficient, E g is the energy gap, and m characterizes the transition process involved. Here, α was estimated from absorbance (A) and thickness (t) by equationReference Shkir, AlFaify, Ganesh and Yahia33 α = 2.303A/t. The value of m equals to 2 corresponds to an allowed direct transition and 1/2 for an indirect transition.
Figures 4(a) and 4(b) represent the graphs of direct and indirect energy transitions of pristine and MZO/FTO nanostructured films. The E g values are calculated by inducing the rectilinear area of (αhν)m versus hν plot. Energy gap values corresponding to both the transitions were found to be decreasing with Mg doping (5, 10, and 15%). The measured direct and indirect energy gaps are found between 3.103 and 3.283 eV for pristine and 2.423 and 2.968 eV for MZO/FTO films and are in line with earlier studies.Reference Ajili, Castagné and Turki34–Reference Shkir, Arif, Ganesh, Manthrammel, Singh, Yahia, Maidur, Patil and AlFaify38
(a) Direct and (b) indirect transition, (c) absorption index, and (d) refractive index of MZO/FTO films.

Decisive optical characteristics such as index of absorption and refraction, k, and n films are work out using k = αλ/4π and 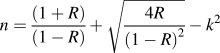 $n = {{\left( {1 + R} \right)} \over {\left( {1 - R} \right)}} + \sqrt {{{4R} \over {{{\left( {1 - R} \right)}^2}}}} - {k^2}$, where R is the function of refractive index (n) Reference Shkir, Ganesh, AlFaify and Yahia39 and plotted in Figs. 4(c) and 4(d), respectively.
It has been observed from these plots that both n and k are displaying analogous tendency with wavelength, i.e., on increasing the wavelength, and the values of n, k are decreasing first and reach the steady state at higher wavelengths. This kind of tendency is a clear indication of defect-free growth of the synthesized nanostructure thin films. Some trivial increases in refractive index (n) are observed after 400 nm and these increases in the value of n at higher wavelengths are attributed to the consequence of magnesium doping. Moreover, similar behaviors are also reported for other metal oxide semiconductor nanostructured thin films with different dopants.Reference Ali Omar40
In an application point of view, the variation of polarization with the energy of incident wavelength is very significant for the fabrication and optimization of an optoelectronic device. Dielectric correlated factors such as real (ε1) and imaginary (ε2) components of dielectric constant describe the electronic excitation spectra of any nanocrystalline films. In view of this, ε1 and ε2 for pristine/FTO and MZO/FTO nanostructured films are calculated by applying formulaeReference Khatibani and Rozati41,Reference Yahia, Ganesh, Shkir, AlFaify, Zahran, Algarni, Abutalib, Al-Ghamdi, El-Naggar and AlBassam42 : ε1 = n 2 − k 2 and ε2 = 2nk, respectively, and depicted in Figs. S2(a) and S2(b) [see the Supplementary Material]. Through these plots, it was seen that ε1 and ε2 are varying from 2 to 10 and 0.1 to 0.9 in the energy range of 1.25–3.75 eV with the Mg doping, indicating the substantial influence of Mg on dielectric properties of nanostructured ZnO. These values of MZO/FTO are better than those previously reported on MZO/Glass in the mentioned energy region.Reference Shkir, Khan, Ganesh, Yahia, Ul Haq, Almohammedi, Patil, Maidur and AlFaify43 Fig. S2(b) [see the Supplementary Material] also denotes the dielectric loss with respect to the energy of incident photon. From the figure, the trend of dielectric loss with Mg doping in ZnO is similar to that of dielectric constant and indicates that the addition of Mg helps to reduce the defects in the film.
Figures S2(c) and S2(d) [see the Supplementary Material] display the plots for volume energy loss (VELF) and surface energy loss (SELF) functions of pristine and MZO films with respect to photon energy (hν). These are key parameters to estimate energy decay rate occurring when electrons pass over any material and are obtained from ε1 and ε2 using the following equationReference Sussman44:
 $${\rm{VELF}} = - {\mathop{\rm Im}\nolimits} \left( {{1 \over {{\varepsilon ^ * }}}} \right) = {{{\varepsilon _2}} \over {\varepsilon _1^2 + \varepsilon _2^2}}\;{\rm{and}}\;{\rm{SELF}} = - {\mathop{\rm Im}\nolimits} \left( {{1 \over {{\varepsilon ^ * } + 1}}} \right) = {{{\varepsilon _2}} \over {{{\left( {{\varepsilon _1} + 1} \right)}^2} + \varepsilon _2^2}}\quad .$$
From the graphs, the VELF and SELF plots follow almost similar trend without much noteworthy differences at higher and lower energies except that the VELF values are comparatively higher than that of SELF in the entire energy level, giving a sign about the journey of radiation from inner and upper levels is the same.
E. Nonlinear studies using optical and Z-scan measurements
The inference of light rays on doped materials having high susceptibilities is very significant in several optoelectronic device applications due to the great nonlinear susceptibilities they possess, which in turn provides extensive details of the preferred sample to defy high laser beats in the course of second- and third-order effects.Reference Shkir, Ganesh, AlFaify and Yahia39 Many research teams have been trying to apply various methodologies to assess the polarizability and refractive index and a reliable formulation is achieved as followsReference Shkir, Ganesh, AlFaify, Yahia and Zahran30,Reference Frumar, Jedelský, Frumarova, Wagner and Hrdlička45 : polarizability, P = χ(1)E (1) + P NL, where P NL = χ(2)E 2 + χ(3)E 3, where χ(1), χ(2), & χ(3) are termed as susceptibilities as linear, second-, and third-order nonlinear, respectively.
Congruently, linear refractive index n(λ) is obtained usingReference Xia, Liu, Qiu, Mao, He and Chen46 n(λ) = n 0(λ) + n 2(E 2), where n 0 and n 2 are the components of n and E 2 is the square mean of electric field, with n 0(λ) ≫ n 2(λ) eventually resulting in n(λ) = n 0(λ). The χ(1) for a given medium follows the relationReference Ticha and Tichy47: χ(1) = (n 2 − 1)/4π, while the χ(3) followsReference Yahia, Ganesh, Shkir, AlFaify, Zahran, Algarni, Abutalib, Al-Ghamdi, El-Naggar and AlBassam42,Reference Adair, Chase and Payne48,Reference Farag49 : χ(3) = Aχ(1). On the other hand, 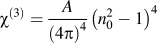 ${\chi ^{\left( 3 \right)}} = {A \over {{{\left( {4\pi } \right)}^4}}}{\left( {n_0^2 - 1} \right)^4}$, where A = 1.7 × 10⁻¹⁰ (in e.s.u).Reference Farag49 The value of n 2 is governed byReference Shkir, Ganesh, AlFaify and Yahia39
 ${n_2} = {{12\pi {\chi ^{\left( 3 \right)}}} \over {{n_0}}}$.
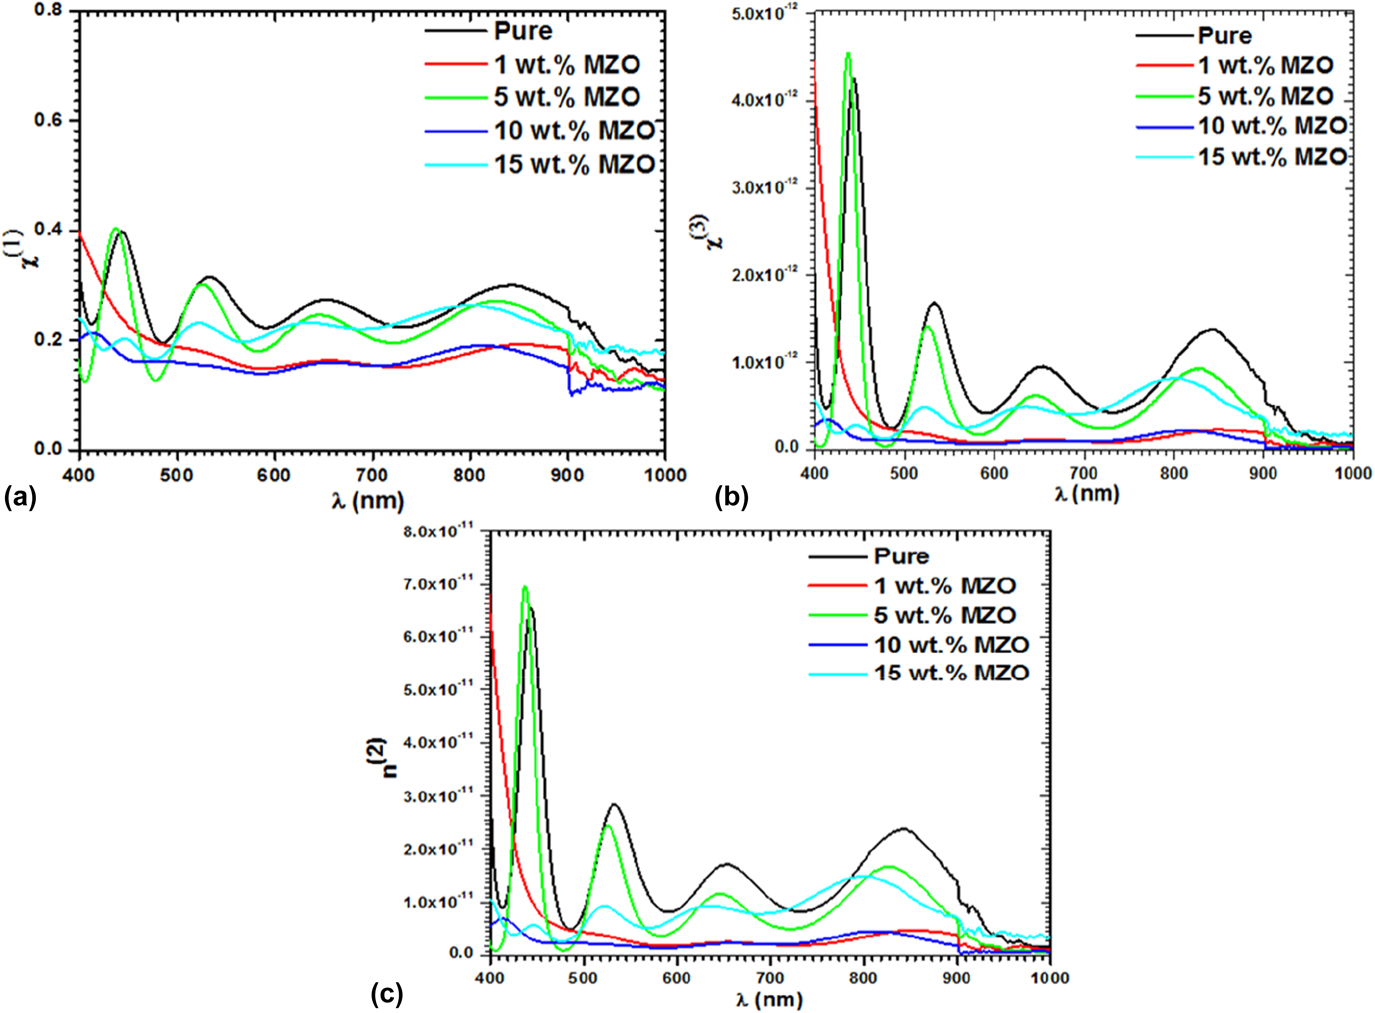
Figures 5(a) and 5(b) display the trends of χ(1) and χ(3) of the pristine/FTO as well as MZO/FTO films in terms of wavelength. From these graphs, it has been found that χ(1) and χ(3) values increase with growing concentration of Mg, particularly at higher wt%. This shows that doping of Mg increased the crystallinity of ZnO and also reduced the defects. At higher concentration, the overall particles’ interaction with the incident photons improves and thereby improves the optical susceptibilities. The values of χ(1) and χ(3) are found to be from 0.1 to 0.4 and 0.023 × 10⁻¹² to 4.59 × 10⁻¹², respectively, in the wavelength region 400–1000 nm. The stable values are observed compared to the previous report on MZO/glass films.Reference Shkir, Arif, Ganesh, Manthrammel, Singh, Yahia, Maidur, Patil and AlFaify38
(a) χ(1), (b) χ(3), and (c) n 2 for pristine/FTO and MZO/FTO films.

Nonlinear refractive index (n 2) is also considered as a very important quantity of the material, which gives significant information regarding the capacity of the material to gather enough light when it interacts with light. Figure 5(c) represents the plot of n 2 versus wavelength for pristine/FTO and MZO/FTO thin films. The graph clearly shows an analogous trend of n 2 with χ(3) and demonstrates the strong dependency of n 2 and χ(3).
F. Z-scan measurement
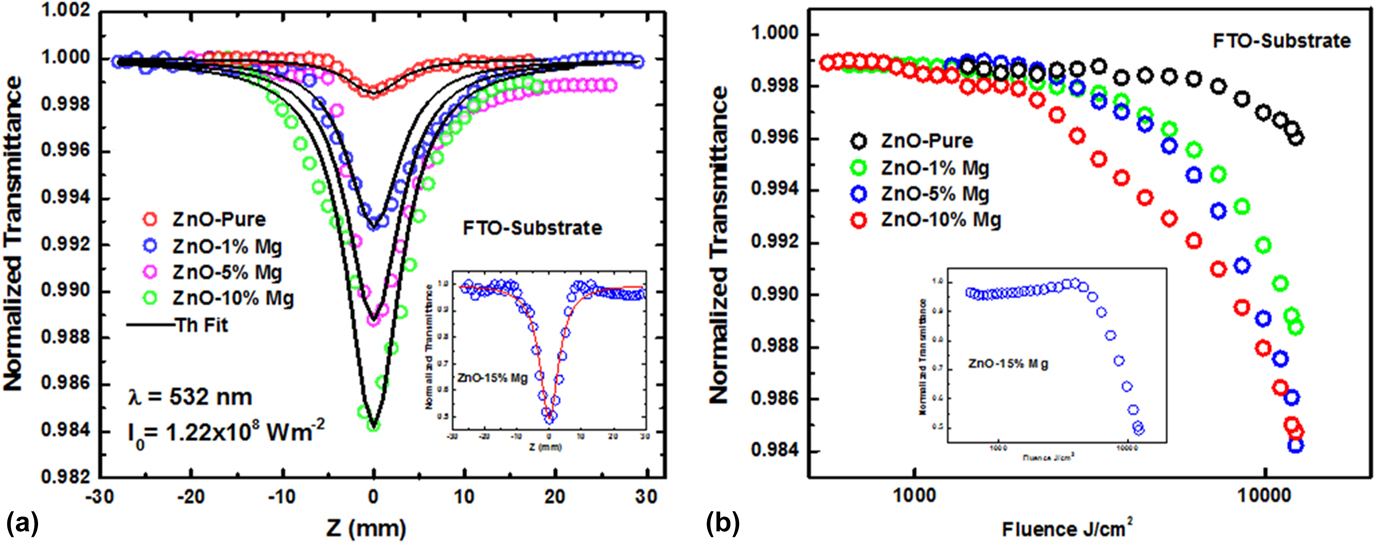
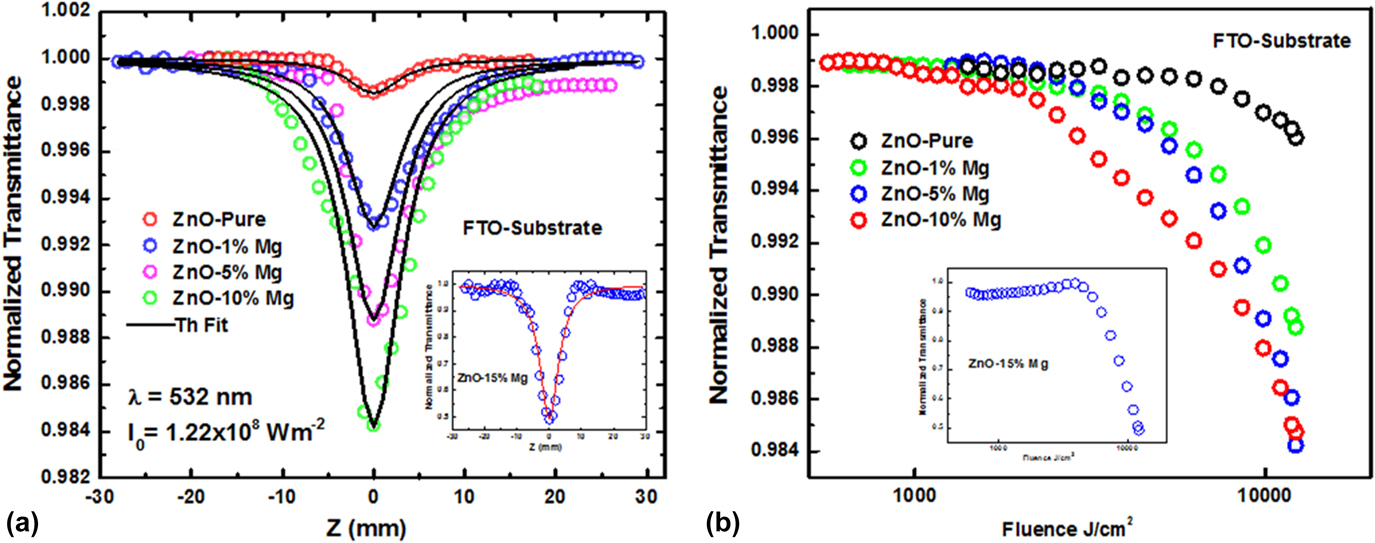
The measured absorption of nonlinearity and limiting of optic performance of all films are demonstrated in Figs. 6(a) and 6(b). The open aperture plot displays a reverse saturation absorption process by means of a stout nonlinear absorption at the origin (focal point). This is accredited to a 2 PA nonlinear absorption procedure occurring in films. By growing the doping concentration, nonlinear absorption increased. The theoretical fitting for the experimental data was done using 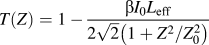 $T\left( Z \right) = 1 - {{\beta {I_0}{L_{{\rm{eff}}}}} \over {2\sqrt 2 \left( {{{1 + {Z^2}} / {Z_0^2}}} \right)}}$, where I 0 is the intensity of the CW laser at the focal Point and L eff is the effective span of the materialReference Patil, Shkir, Maidur, AlFaify, Arora, Rao, Abbas and Ganesh50 used to obtain the nonlinear absorption coefficient (β). The β values are found in the range 0.35–123 (×10−5) cm/W, and these values are comparatively higher than ZnO/glass films reported previously.Reference Shkir, Khan, Ganesh, Yahia, Ul Haq, Almohammedi, Patil, Maidur and AlFaify43
Plots of Z-scan measurements for (a) absorption and (b) optical limiting.
A direct relation has been found to exist between χ(3) with β and n 2 via the relationReference Maidur, Patil, Rao, Shkir and Dharmaprakash51  ${\mathop{\rm Im}\nolimits} {\chi ^{\left( 3 \right)}}\left( {{\rm{esu}}} \right) = {{{{10}^{ - 2}}\left( {{\varepsilon _0}{C^2}{n_0}\beta \lambda } \right)} \over {4{\pi ^2}}}\left( {{{{\rm{c}}{{\rm{m}}^2}} \over {\rm{W}}}} \right)$, where n 0 is the linear refractive index and C, λ, and ε0 have their usual meaning. The calculated values of χ(3) are found to be enhanced from 0.084 to 29.7 (×10−8) when doped 15% Mg in ZnO. These values are comparatively higher than ZnO/glass films reported previouslyReference Shkir, Khan, Ganesh, Yahia, Ul Haq, Almohammedi, Patil, Maidur and AlFaify43 and comparable to other reports of MZO films.Reference Agrawal, Ahmad Dar, Solanki, Phase and Sen52 All these values are tabulated in Table II.
Obtained NLO parameters from Z-scan study for pristine/FTO and MZO/FTO films.

Figure 6(b) illustrates the limiting behavior of films at 532 nm DPSS CW laser. The normalized transmission is drawn against input fluence of the laser, and limiting threshold (LT) was estimated at 50% of linear transmission.Reference Shkir, Arif, Ganesh, Manthrammel, Singh, Yahia, Maidur, Patil and AlFaify38,Reference Maidur, Patil, Rao, Shkir and Dharmaprakash51 LT values were calculated to be 6.34 for pristine, 4.51, 3.91, 3.28, and 2.57 kJ/cm2 for 1%, 5%, 10%, and 15% MZO films, respectively. The values are comparable as well higher than previous reports on MZO films.Reference Shkir, Khan, Ganesh, Yahia, Ul Haq, Almohammedi, Patil, Maidur and AlFaify43,Reference Agrawal, Ahmad Dar, Solanki, Phase and Sen52 The reduction of LT with an increase in Mg doping indicates that the MZO/FTO films are of better optical activity and could be used to shield the sensor devices from intense lights.
IV. CONCLUSIONS
Fabrication of pure and 1, 5, 10, and 15 wt% Mg-doped ZnO films of good quality is achieved through the spin coating procedure. XRD and Raman analyses approved high crystallinity and single phase of synthesized films. The variation in lattice constants was observed on doped films. Crystallite size values were obtained in the range 46–78 nm. EDX and SEM mapping studies proved that there is a homogeneous doping distribution of Mg in the ZnO matrix. The morphology of the deposited films was tested by SEM, which indicates the fiber-like structure formation. Optical absorbance, transmittance, and reflectance measurements confirm that the fabricated films possess good optical transparency, i.e., in the range of 40–80%. The calculated values of energy gaps were found in the array of 3.103–3.283 eV for direct and 2.423–2.968 eV for indirect. The optical refractive index was found in the range of ∼1.71–2.1. Z-scan measurement was performed and an enhancement in the nonlinear parameter values such as β and imaginary part of χ(3) are found from 0.35 to 123 (×10−5) cm/W and 0.084 to 29.7 (×10−8) e.s.u., respectively. Optical LT values were also calculated and found to be in the range of 6.34–2.57 kJ/cm2, indicating that MZO/FTO films show strong optical limiting behavior compared to that of pristine. The enhanced nonlinear parameters and low values of optical limiting confirm the good quality Mg-doped ZnO and may be applied in optoelectronic device fabrications.
Supplementary Material
To view supplementary material for this article, please visit https://doi.org/10.1557/jmr.2018.310.
ACKNOWLEDGMENT
The authors would like to express their gratitude to deanship of scientific research and King Khalid University, Saudi Arabia, for providing the financial support under the Project No. R.G.P. 1/54/39.