Introduction
Blueberry (Vaccinium corymbosum L.) cultivation is undergoing a major expansion globally. This crop is also showing a marked expansion in Spain, whose main producing area is located in the surroundings of the Doñana National Park (Huelva, SW Spain), one of Europe’s most important wetland reserves. The pressure on available water resources in this region is great and there is an urgent need to reduce agricultural water use due to overexploitation of the aquifer that supplies the reserve (Lozano et al., Reference Lozano, Ruiz and Gavilán2016). A majority of the blueberry fields in the area are grown in sandy soil, so keeping optimum yields while reducing water use requires performing an extremely efficient irrigation management (García-Morillo et al., Reference García Morillo, Martín, Camacho, Rodríguez Díaz and Montesinos2015). In order to tackle this challenge, some growers in the area have initiated the adoption of precise irrigation technologies (e.g. soil moisture sensors, agroclimatic stations, programmable logic irrigation controllers or wireless sensor networks) to assist in irrigation decision making, but the interpretation of this information is not evident and they face difficulties to optimize irrigation scheduling, especially in sandy soils where water moves fast and the risk of losing water and nutrients by leaching is high.
The limited knowledge on blueberry irrigation requirements (Keen and Slavich, Reference Keen and Slavich2012) together with the complex water dynamics of the typical sandy soils of the study area (>90% sand), with extremely low water retention capacity, makes optimization of irrigation scheduling criteria (i.e. soil moisture set-points for triggering irrigation and optimal duration of irrigation pulses) critical for improve production efficiency. Based on this, the main objectives of the work were, firstly, to define process-based irrigation scheduling criteria adjusted for sandy soils and, secondly, to compare the automatic irrigation system performance under two different configurations: (i) using the grower’s irrigation scheduling criteria (Control treatment) and (ii) using irrigation set-points and duration of irrigation events determined from soil hydraulic properties analysis and numerical modelling of soil water flow (Optimized treatment).
Materials and Methods
Description of the experimental site
The experiment was conducted in a commercial blueberry field (Vaccinium corymbosum cv. Snowchaser) located in Lucena del Puerto (Huelva, SW Spain). The 5-year old plants were grown in plastic tunnels and planted at the top of 0.6 m wide and 0.4 m high polyethylene-mulched ridges. The plants were spaced 0.9 m and 3.4 m apart along and between rows, respectively. The soil, classified as a sand, had a bulk density of 1.74 g cm−3 and mean sand content of 92.4%, as determined by laboratory analysis of nine soil samples taken in three out of four experimental tunnels (three samples per tunnel). Soil textural analysis (Gee et al., Reference Gee, Bauder and Klute1986) allowed established soil moisture contents of ca. 12.5% and 5.5% for field capacity and wilting point respectively. The drip irrigation system consisted of two driplines (polyethylene 16 mm) per plant row with 1.8 l h−1 integrated pressure compensating emitters placed 0.4 m apart.
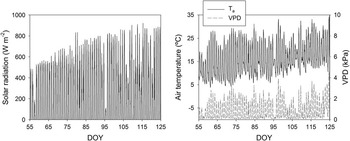
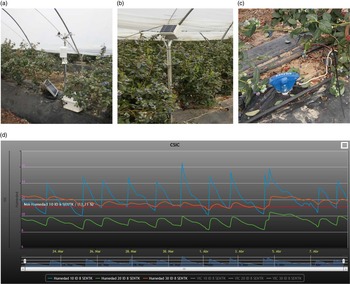
The climate of the study area is Mediterranean, with annual mean temperature of ca. 19 °C and annual rainfall (occurring normally from late September to May) normally varying between 500 to 700 mm. During the experiment, climatic variables including solar radiation, air temperature, relative humidity and vapour pressure deficit (VPD) (Fig. 1) were recorded with a standard weather station placed inside one of the experimental plastic tunnels (Fig. 2a).
Half-hourly data of (left) solar radiation and (right) air temperature and vapour pressure deficit (VPD) recorded inside one of the experimental tunnels during the trial. DOY 55=February 24th and DOY 125=May 4th.

(a) Weather station, (b) solar power GPRS/GSM remote wireless datalogger, (c) soil profile soil moisture probe, (d) web interface for visualizing soil moisture data (Infocultivo, Luecena del Puerto, Spain). In (d), the depicted data belongs to the Optimized treatment.

Soil moisture-based irrigation control system
Blueberry irrigation was performed on-demand with an automatic soil water-based irrigation control system. The system uses the information provided by calibrated soil moisture profile probes (EasyAG, Sentek Sensor Technologies, Stepney, Australia) with fixed sensors at 10 cm, 20 cm and 30 cm depths (Fig. 2c) to trigger irrigation events when measured soil moisture at 10 cm depth drops below a user-defined set-point. Irrigation depths (i.e. duration of the irrigation events) were not automatically controlled by the irrigation system but they were pre-defined by the users in the irrigation controller. The system records soil moisture readings in a GPRS/GSM remote wireless datalogger (Fig. 2b) (Infocultivo, Lucena del Puerto, Spain) and sends them to a web server, so that the user can monitor the real-time data remotely (Fig. 2d), and to the irrigation controller for automatic irrigation scheduling.
Irrigation treatments
Two irrigation treatments were established during March and April 2016: (i) a Control treatment performing on-demand automatic irrigation scheduling using irrigation set-points and rates predefined by the farmer following technical recommendations for the area of study (Control treatment) and (ii) an Optimized treatment performing on-demand automatic irrigation scheduling using irrigation set-points and rates determined, respectively, from soil hydraulic properties and numerical simulations of soil moisture dynamics performed with the software package HYDRUS 2D/3D (Simunek et al., Reference Simunek, Jacques, van Genuchten and Mallants2006). Four tunnels were selected for the trials. In each tunnel, two experimental plots (one per treatment) with ten plants per plot and a six plants buffer strip between treatments were established along one of the two mulched ridges found per tunnel. The soil moisture probes installed in one out of four replicates per treatment were used to trigger the irrigation events of each treatment.
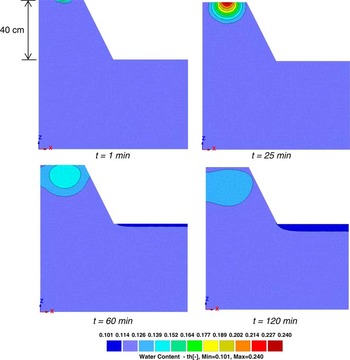
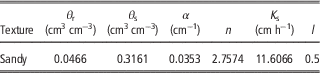
In the Optimized treatment, the system was set to trigger irrigation when soil moisture at 10 cm depth dropped below 11.1%, a value slightly below the estimated field capacity (12.5%) and with a soil hydraulic conductivity of 48% of that existing at field capacity according to the van Genuchten-Mualem constitutive relationships (van Genuchten, Reference van Genuchten1980) derived with the Rosetta model embedded in the HYDRUS 2D/3D software. This value was set under the hypothesis that set-points around field capacity or above will likely lead to excessive leaching fractions in sandy soils, whereas lower values can dramatically reduce hydraulic conductivity and thus root water uptake. Table 1 shows the van Genuchten-Mualem hydraulic parameters derived for the experimental soil. The duration of the irrigation events was set at 25 min based on the modelling study carried out with HYDRUS 2D/3D (Fig. 3). In this figure, it can be observed that after 120 min from the irrigation onset, the water front had reached ca. 30-35 cm depth, i.e. slightly deeper than the target depth where most active roots are placed (Bryla and Strik, Reference Bryla and Strik2007). In the Control treatment, the system was set to trigger irrigation when soil moisture at 10 cm depth dropped below 13.2% (slightly above field capacity), while the duration of irrigation was set at 40 min from the onset of the experiment until day of year, DOY 86, and 35 min afterwards.
Soil moisture dynamics as modelled with HYDRUS 2D/3D for an irrigation event of 25 min in the experimental soil under uniform initial soil moisture conditions (=12%).

Soil hydraulic parameters used in the modeling study. θr: residual water content; θs: saturated water content; α, n and l: van Genuchten shape parameters; Ks: saturated hydraulic conductivity

Berry yield and quality
Berry yield was determined for each experimental plot by weighing, with an industrial balance (Baxtran, Spain), all fruits harvested manually by professional fruit pickers during the period March-April. During this period, ripe berries were harvested seven times in intervals of around seven-ten days (DOYs 53, 64, 81, 93, 103, 110, 119). At each harvest time, thirty berries per experimental plot were selected randomly for measuring berry diameter with a wireless digital calliper (WEL Caliper, NZ), while degrees Brix (i.e. a measure of the sugar content of an aqueous solution) were determined in twenty berries per plot with a refractometer (model HI 96 801, Hanna Instruments, USA).
Crop growth and physiological measurements
Vegetative growth was assessed at the end of the experiment in two plants per experimental plot. Two main branches per plant were selected to measure branch diameter and the length of twenty shoots per branch. Midday leaf water potential (Ψ l) was measured on DOY 119 under clear sky conditions in three representative healthy leaves per experimental plot with a Scholander type pressure bomb (Soil Moisture Equipment Crop., Santa Barbara, CA, USA). On the same day that Ψ l was measured, stomatal conductance (g s) and leaf photosynthesis rate (A n) were measured at midday in three representative healthy leaves per plot with a Licor 6400 portable leaf gas exchange measuring system (Li-Cor, Inc., Lincoln, NE, USA).
Statistics
Analysis of variance (ANOVA) performed with the statistical package Statgraphics (Statgraphics Centurion XV) was used to compare yield, fruit quality attributes and physiological indicators between treatments.
Results and discussion
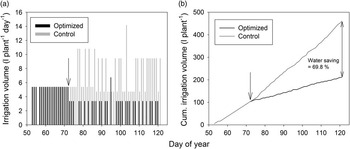
The adjustments implemented in the irrigation control algorithm of the Optimized treatment, in terms of duration of irrigation and set-points for irrigation triggering, had a marked impact on both the number of irrigation events that were automatically scheduled and the total volume of water applied (Fig. 4). During the period DOY 72 (onset of the Optimized treatment) to DOY 121 (end of experiment), the Optimized treatment triggered 32 irrigation events (25 min/irrigation) while the Control treatment triggered 73 events (19 with a duration of 40 min/irrigation and 54 with a duration of 35 min/irrigation). The significant reduction in the number of irrigation events resulted in a cumulative water saving from the onset of the Optimized treatment of around 70%, as compared to the Control treatment. The soil moisture dynamics of the probe installed at 30 cm depth indicated that irrigation water reached this depth (Fig. 2d), in agreement with the numerical modelling study conducted with the HYDRUS software package (Fig. 3).
(a) Daily irrigation volumes applied in both automatic irrigation systems (Optimized and Control); (b) Cumulative irrigation volume throughout the experiment for both irrigation systems. The down-facing arrows indicate the onset of the Optimized irrigation treatment. In (b), the water saving has been calculated for the volumes applied since the onset of the Optimized treatment.

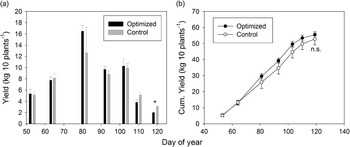
The marked differences observed in the irrigation schedules conducted by both irrigation treatments during the period of study did not result in cumulative berry yield differences, these being around 5.5 kg plant−1 and 5.3 kg plant-1 in the Optimized and Control treatments, respectively (Fig. 5b). The berry yields obtained at each individual harvesting date revealed that significant differences between treatments were only observed on the last harvesting date; the least important in terms of fruits harvested per plant (~0.2–0.3 kg plant−1) (Fig. 5a).
(a) Berry yield determined for all harvesting dates and both irrigation treatments; (b) Cumulative berry yield over the period of study for both irrigation treatments. n.s.: non-significant differences; * significant differences at P<0.05.

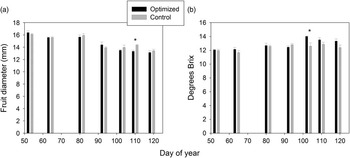
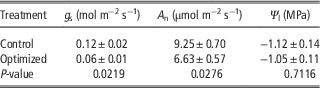
In terms of berry quality, irrigation management did not have any impact on any of the quality attributes assessed during the majority of harvesting dates (Fig. 6). Only berry diameter on the sixth harvesting date and °Brix in the fifth harvesting date showed significant differences between treatments. Plant water status measurements showed that the irrigation treatments had no effect on leaf water potential (Ψ l), whereas stomatal conductance (g s) and leaf photosynthesis rate (A n) were, respectively, 50% and 28% lower in the Optimized treatment (Table 2). These results indicate that the Optimized treatment could maintain Ψ l values similar to those observed in the Control treatment, but it was at the cost of reducing stomatal conductance and, to a lesser extent, photosynthesis rate. This behaviour, known as isohydric response, supports previous observations in blueberries (Ameglio et al., Reference Ameglio, Perrier, Le Roux and Mingeau1999). The fact that Ψ l was similar between irrigation treatments may explain why vegetative growth (very sensitive to turgor loss) was also similar in both irrigation treatments (data not shown).
(a) Berry diameter determined for all harvesting dates and both irrigation treatments; (b) Degrees brix determined in all harvesting dates for both irrigation treatments. * significant differences at P<0.05.

Midday values of stomatal conductance (gs), leaf photosynthesis rate (An) and leaf water potential (Ψ l)

Previous studies have demonstrated the high sensitivity of blueberries to soil water deficit (Haman et al., Reference Haman, Smajstrla and Pritchard1997; Ameglio et al., Reference Ameglio, Perrier, Le Roux and Mingeau1999). Since blueberries grown under the Optimized treatment did not have any yield penalty or fruit quality impairment (i.e. fruit diameter, sugar content), it suggests that the volumes of water applied by the Optimized treatment were closer to actual crop water requirements than those applied by the Control treatment. In this regard, in an experiment carried out in Australia with field-grown blueberries it was estimated that crop water requirements during the productive season (flowering to end of harvest) averaged 3.28 L plant−1 day−1 (Keen and Slavich, Reference Keen and Slavich2012). In our case study, the average irrigation volume applied by the Optimized treatment during the same phenological period was 2.2 L plant−1 day−1 whereas the one applied by the Control treatment was 7.3 L plant−1 day−1. Although water requirements of well-watered blueberries grown in the location of this study are still uncertain, these data indicate that blueberries grown under the Optimized treatment suffered mild to moderate water stress whereas the plants grown under the Control treatment were notably over-irrigated. Nevertheless, these results are preliminary and need to be evaluated in the long term, as mild to moderate water stress may have carryover effects on crop development and productivity.
Conclusions
This study assesses the performance of irrigation scheduling criteria derived from analysis of soil hydraulic properties and soil water modelling for automatic irrigation of blueberries grown in sandy soil. The results show that automatic irrigation using the Optimized irrigation scheduling criteria supplied ca. 70% less water than the grower’s automatic irrigation system with no yield or fruit quality penalty. The results therefore suggest that, in sandy soils, irrigation can be optimized by defining set-points based on the losses associated with soil hydraulic conductivity, rather than soil matric potential, and by establishing the duration of irrigation from soil water modelling.
Acknowledgments
The authors thank Infocultivo and Frutas El Pinar for their support with the soil moisture-based irrigation control system and for allowing us to conduct the experiments in their greenhouses.