

In the last decade, a vast cross-disciplinary literature in history, economics, and political science has developed that aims to understand the role of so-called ‘colonial legacies’ on long-term African economic development. To reach shared conclusions this literature faces two methodological challenges. First, the absence of a counterfactual makes it hard to assess the precise impact of past colonial interventions on present-day outcomes: how a society would have fared without colonial intervention remains unobserved. Second, it remains difficult to disentangle the development effects of colonial interventions from the impact of precolonial histories, local endowment structures, and indigenous social, political, and economic agency. After all, colonial policies were shaped by the interaction between metropolitan imperial agendas on the one hand and local conditions and responses setting the constraints to these agendas on the other hand.
The purpose of this study is to better understand the dynamics of this interaction. By comparing fiscal capacity building efforts in British and French Africa from c. 1880 to 1940 we aim to shed light on a long debated question: to what extent can one detect a distinctively ‘French’ and ‘British’ approach to colonial state formation in Africa? Fiscal development offers an excellent lens to study comparative processes of colonial state formation. Loans and aid from the metropolitan government helped to finance the colonial state building effort, but these were limited in size, especially before 1940, and certainly meant to be temporary.Footnote 1 Both the French and the British strove to make their colonies fiscally independent as quickly as possible to limit the burden of empire-building on domestic taxpayers. The pace of colonial state expansion, therefore, depended critically on the development of a local tax base.
There were generally high constraints on raising revenue in sub-Saharan Africa (Africa hereafter). Colonial state boundaries usually did not align with precolonial political boundaries and included a patchwork of local systems of surplus production and extraction. Revenues from trade were relatively small compared to other world regions. Land ownership was not formally registered in ways that could be readily adopted by European colonial governments for taxing subsistence farm output, if they had the manpower to do so in the first place.Footnote 2 Indigenous taxes based on slavery were a source of economic extraction which colonial powers in the post-abolition era could not directly tap into, although they did turn a blind eye to its practices to support export sector growth.Footnote 3 Finally, the lion's share of precolonial surplus extraction was in-kind, while newborn colonial governments needed monetary revenues to pay the salaries of an expanding administrative staff, which generally comprised between a half to two-thirds of annual government budgets before 1940.Footnote 4
Comparative accounts of British and French colonial rule in Africa have largely focused on observable differences in institutional design, such as the establishment of systems of indirect rule and common law in the British dependencies as opposed to direct rule and civil law in the French dependencies.Footnote 5 Others have contrasted liberal British policies regarding missionary schooling to restrictive systems of state education in French dependencies.Footnote 6 Emphasizing ‘metropolitan blueprints’ of colonial rule has a long tradition indeed.Footnote 7
Yet, when it comes to the fiscal underpinnings of African colonial states we know surprisingly little about the comparative aspects of ‘French’ and ‘British’ approaches.Footnote 8 Given the vital importance of taxation for African (colonial) state development, it would be very valuable to further explore this topic and there are comparatively good historical sources to support such an endeavor. This study is the first to our knowledge that exploits historical records of colonial state finances for a systematic comparison of taxation in British and French Africa. Volatile pound-franc exchange rates during the interwar era complicate solid cross-imperial comparisons of revenue, but we tackle the currency conversion problem by constructing government purchasing power parities (so-called PPPs, to be explained later) based on the relative wage and salary costs of different types of government staff. We also use the wage and salary data to create series of real government revenue, that is, corrected for price changes over time.
We document four general patterns of fiscal capacity building: (1) the cross-colony variation in per capita state revenue was much larger in French Africa than in British Africa; (2) the most important determinant of variation in per capita revenue levels, however, was the difference between coastal and landlocked colonies, not between British and French colonies;Footnote 9 (3) there was an initial lead in revenue raising ability in British Africa, but the French colonies caught up after the First World War; and (4) there was convergence in the source composition of tax revenue both within and across the French and British African colonies in the period up to 1940.
We use these four general patterns to scrutinize three oft-cited claims about the distinctive nature of British and French rule in Africa: (1) the idea that French rule was more repressive then British rule in terms of revenue extraction and maintaining social order; (2) the idea that the British managed to select territories in Africa that were commercially more viable than others; and (3) the idea that the French organized their administrations in federal structures to enhance political and cultural assimilation. We argue that these claims can be connected when studying colonial state formation through the lens of fiscal capacity building: French rule was more repressive because of the economic constraints posed by commercially less viable territories; the creation of large federations can be considered as a response to that problem by integrating richer coastal territories with vast hinterland areas through fiscal redistribution. High repression and federal redistribution can explain why French colonies caught up in terms of fiscal capacity building with the ‘richer’ British colonies.
We proceed by discussing the concept of ‘endogenous colonial institutions’ in the context of the colonial legacies literature in the next section. In the third section, we present a quantitative analysis of comparative per capita state revenues and in the fourth section we analyze its source composition. In the fifth section we further elaborate our argument by looking into the different ways in which the French and the British used forced labor as an alternative to raising monetary revenue.
ENDOGENOUS COLONIAL INSTITUTIONS
The social science debate on the comparative legacies of colonial institutional development has intensified since the seminal papers of Daron Acemoglu, Simon Johnson, and James Robinson.Footnote 10 Using econometric methods, these studies provided empirical evidence for the idea that the nature of colonial institutions across the world was rooted in differential climatic conditions of European settlement (mainly disease environment), and how these varying geographical contexts correlated to different levels of economic development and institutional quality in the late twentieth century. They argue that in colonies where Europeans settled in larger numbers more ‘developmental’ institutions were established, whereas in areas with limited settlement institutions were created to facilitate colonial extraction.Footnote 11 By emphasizing the role of local conditions for colonial settlement, these papers also nuanced the importance of metropolitan identity for the design of colonial institutions.
Their studies have brought the ‘colonial legacies’ debate and the importance of colonial history to the attention of a wide audience of social scientists, and, as Hopkins noted in his 2009 article on ‘the new economic history of Africa’, have generated an enormous body of follow-up research.Footnote 12 Yet, the ‘AJR’ papers, as they are called now in the literature, have also received much criticism. Historians have argued that the twofold distinction between ‘extractive’ and ‘developmental’ colonial institutions is too simplistic to remain meaningful, that the approach insufficiently accounts for processes of historical change, and that the distinction between settler and nonsettler economies did not really support the hypothesis for Africa, since in African settler colonies extraction was more pervasive than in many of the nonsettler colonies.Footnote 13
What matters for this study is that Acemoglu et al. have argued that the colonial state had near absolutist power to create extractive institutions to their liking in nonsettler colonies.Footnote 14 In fiscal affairs this concerns the setting of tax rates as well as the selection of revenue sources. The idea links up with a wider historical literature stressing the role of fiscal policy in underpinning the hegemony and broadcasting the power of the colonial state in Africa.Footnote 15 In particular the imposition of native hut, head, and poll taxes have been understood as central tools for a broad range of colonial government policy objectives. Crawford Young, for example, considers the head tax as ‘leading the way’ in achieving the ‘requirements of revenue and hegemony’.Footnote 16 Richard Reid attributes the creation of a head tax system to similar objectives, maintaining that the imposition of a capitation tax, ‘the most visible, and the most dreaded manifestation of conquest’, was not just ‘absolutely fundamental to the functioning of the colonial state’, but in many ways even its ‘key purpose’.Footnote 17 Mahmood Mamdani has interpreted the British African fiscal system as a central touchstone in the state's hegemony imperative – that is, its cultural hegemony imperative. Mamdani sees the tax collection structure as an integral part of the colonial state's ‘decentralized despotism’ with built-in incentives for corruption and abuse. As such, the fiscal system became one of ‘pervasive revenue hunger all along the chain of command’, with widespread efforts ‘to tax or impose fees on anything that moved’.Footnote 18 Other scholars have emphasized how direct taxes were intended to fulfill the objectives of integrating Africans into the money and wage economy and to ‘civilize’ the colonized subject by instilling them with Victorian bourgeois values as to create a ‘governable person’.Footnote 19
However, not all scholars of Africa share the view of the colonial state as a powerful ‘crusher of rocks’.Footnote 20 Jeffrey Herbst, for example, has pointed out that interpretations of the colonial state as an absolutist apparatus strongly overestimate actual European power and the scope of their hegemonic project. The colonizers, ‘whatever their formal theory of rule’, he argues, were ‘generally unsuccessful in changing cost structures to allow for a systematic expansion of authority into the rural areas’.Footnote 21 According to Herbst, low population densities made the borders of precolonial African states fluid because the marginal costs of collecting taxes (coercion, monitoring, logistics) exceeded the potential revenues. Europeans may have fixed African borders on maps, but they did not ‘control’ the hinterland areas. Ewout Frankema has argued that parts of the fiscal system in British Africa adhered to the logic of minimizing effort, rather than maximizing revenue.Footnote 22 Leigh Gardner maintains that the structure of African colonial administrations remained a ‘skeleton’ and observes that the description of British rule as a ‘gimcrack effort by two men and a dog’ may not have been too far from reality.Footnote 23
How did French and British colonial governments deal with such constraints? Of course, governance structures in Africa evolved in the context of different imperial aspirations. For France, the incorporation of West Africa meant a logical southward extension of the French presence in North Africa (especially Algeria), as well as an eastward extension of their coastal possessions in the Senegambia. They set out to conquer a vast unified territory, which was envisioned as part of a great French African empire.Footnote 24 For the British, South Africa and Egypt were of high strategic importance in controlling the gateways to Asia, but in the larger scheme of British imperialism, Africa was not essential to sustain British industrial power, nor was it essential to safeguard key commercial interests. India and the New World dominions were the focal point of British foreign policy efforts.Footnote 25 These different imperial orientations underpinned different metropolitan ideologies of colonial rule in Africa.
Power imbalances played their role too. As the British were at the height of their imperial power in the closing decades of the nineteenth century, they had, in principle, the best military and diplomatic means to pick and choose.Footnote 26 Jane Burbank and Frederick Cooper state that the British ‘ended up with the plums’, while France ‘got what it could – much of it arid lands on the edge of the Sahara plus choicer morsels along the coast’.Footnote 27 The British had good reasons to be choosier than other European powers, reluctant as they were to spread military and administrative resources too thin. As such, the more densely populated areas with a revealed propensity to engage in commercial relationships and less organized resistance against colonial encroachment were favored.Footnote 28 In these areas taxation was easier to organize via customs duties than elsewhere, sparing the costs of implementing more fine-grained structures of direct tax collection in the hinterlands.
French colonial bureaucracies were more deeply involved in local affairs in at least two ways. First, they erected a more hierarchical administrative structure than the British, putting in place a top-down structure of governance layers reaching out to the community level, with a larger number of administrative staff (direct rule). The British, on the other hand, were satisfied with controlling the power of chiefs, rather than interfering directly in local affairs (indirect rule). Second, the French colonial state engaged more intensively in the training of an African elite bureaucracy to strengthen local administrations and develop a rudimentary structure of local and central government representation. The British approach of operating' at arm's length’ granted a greater degree of freedom to chiefs, with fewer layers of official bureaucracy, and a more cost-efficient organization of their ‘gate-keeping states’.Footnote 29
According to Michael Crowder, these different approaches of colonial rule constituted a difference in kind, not in degree.Footnote 30 While in the British system, the relationship between political officers and native authorities was advisory, in the French system chiefs were subordinates. The French ideals of assimilation and association reflected the ambition to instill French political and cultural values, customs, and administrative institutions in the subjected peoples of the overseas territories (Les Outre-Mer) with the ultimate objective of their full integration into French society.Footnote 31 The British distinction between dominions – containing substantial proportions of white settlers – directly ruled colonies, indirectly ruled colonies and protectorates reveals a more pragmatic approach towards empire building. Dominions enjoyed rights of self-governance that colonies did not have, while protectorates received military protection, but were formally outside the British Commonwealth.
In short, there is no doubt that French and British colonial governance structures differed as a result of different imperial ambitions and approaches, and the relevant question for this study is not whether the British and French employed their own ‘style’ of colonization or not: they of course did so. The question we address is the degree to which their different policy approaches were decisive for the design and development of colonial tax systems. What we will argue in the remainder of this study is that the pace of colonial state development was critically dependent on varying local constraints to fiscal capacity building. These differences were pervasive and the British and French responses to these varying realities can easily be mistaken for different metropolitan blueprints of colonial taxation. We find that under comparable local circumstances the French and British operated in remarkably similar ways.
RAISING REVENUE IN SCATTERED AFRICAN EMPIRES
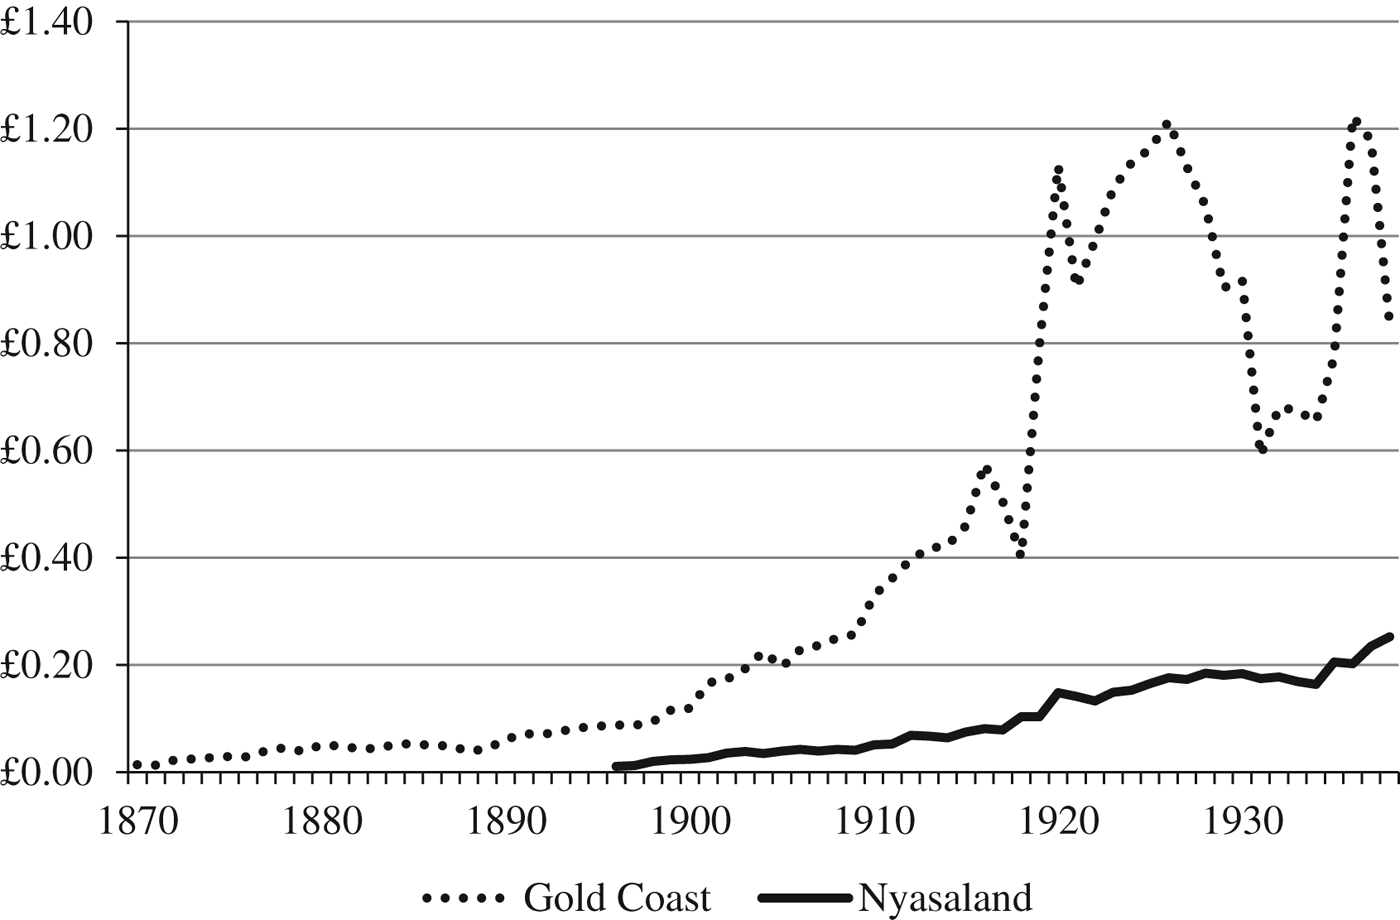
To structure our thinking about varying local constraints to fiscal capacity building it is useful to start with a simple comparison of two British African colonies. Figure 1 shows gross public revenue levels per capita in the Gold Coast and Nyasaland between 1870 and 1940. These two cases resemble the fiscal development of a rather successful colonial economy (the Gold Coast) and one of the poorest African colonies (Nyasaland). We use these economic disparities to highlight a number of background insights to our overall argument.
Gross Public Revenue (GPR) per capita in the Gold Coast and Nyasaland, 1870–1940. Sources: The Gold Coast Colony, Blue Book (Accra, various issues); Nyasaland Protectorate, Blue Book (Zomba, various issues).

First, in areas with a long tradition of coastal European-African trade, which were often concentrated around former slave trade hubs, colonial states were likely to expand earlier and more gradually from the late nineteenth century onwards than in landlocked territories in the interior without such evident trade connections. In areas with long commercial relationships incipient colonial administrations could more easily tap into existing trade flows to raise revenue for colonial state expansion. Second, in areas such as the Gold Coast, the opportunities to develop a virtuous commerce-state revenue cycle, in which customs duties could be reinvested in export-promoting physical and administrative infrastructures were higher than in colonies where exports remained limited. Third, the budgets of the commercially viable territories were more vulnerable to exogenous world market shocks such as the Great Depression in the 1930s. The data presented in the remainder of this section indicate that these mechanisms operated across British and French Africa and that they explain a considerable part of the variation within and across both empires. There are also some important exceptions to this general trend, which we will highlight in passing.
Our empirical investigation involved four steps. First, we collected archival data on colonial budget accounts for the years 1911, 1920, 1925, 1929, 1934, and 1937. The year 1911 captures the early stages of the French West and Equatorial African federations, which became operative in 1904 and 1910 respectively. The year 1937 is the latest benchmark before the outbreak of the Second World War. The years 1925, 1929, and 1934 offer the possibility to study the effects of the Great Depression on tax revenues and 1920 serves as an early post-First World War benchmark.Footnote 32 We let our study begin in 1880 to pick up the earliest developments in colonial state formation, but we mostly deal with these in descriptive terms. We let our study end in 1940, since the Second World War and its aftermath changed the way in which colonies were financed considerably (especially in terms of loans and structural aid).
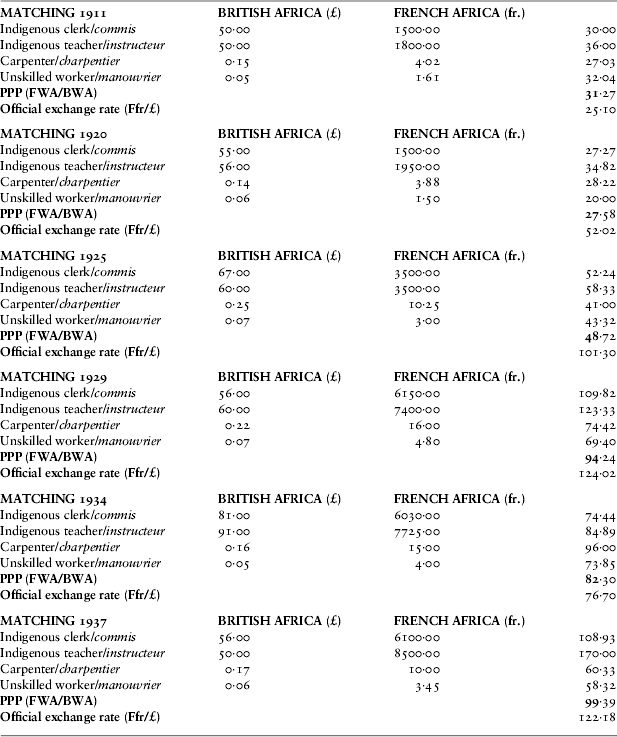
Second, we circumvented the potentially distorting effect of exchange rate volatility in the interwar period – when the British and French went on and off the gold standard at different times and prewar parities – by constructing colonial government purchasing power parities. Without going into the technical details (for details on sources, data and calculation procedure we refer to the appendix), the basic idea of this calculation procedure is to compare the relative prices of the specific labor services hired by the colonial government and use these ratios as a substitute for official exchange rates. Official exchange rates were codetermined by macroeconomic shocks and economic relations between Britain and France, but these effects did not necessarily reflect the changing local expenses of colonial governments in Africa.
Our PPPs are based on four different categories of personnel expenditure in British West Africa and French West Africa: (1) lower-ranked clerk salaries; (2) African public school teacher salaries; (3) urban unskilled worker day wages, and; (4) skilled construction worker day wages (carpenters). The first two categories reflect the relative costs of hiring government staff, especially in the lower ranks of civil service where most of the personnel expenses were made. The latter two categories reflect the relative costs of government investments in public works, which took another big portion of colonial state expenditure.
Table 1 compares our PPP estimates with the official exchange rate and shows that a PPP-based comparison of per capita government revenue will yield very different results from an exchange rate-based comparison. In 1925, for example, the difference between our PPP and the official exchange rate is in the order of 100 per cent. We also used the collected wage and salary data to construct a labor price index, which allowed us to convert nominal series of government revenue into real terms, that is, series expressed in constant 1911 pound sterling (£).
French-British exchange rates, colonial government PPPs, and related price index of public and private sector labor, 1911–37. Sources: see Appendix 1.

Third, we singled out the individual colony shares in the collective revenues of the federal states (AOF, AEF, and the Kenya-Uganda customs union) to make revenue levels comparable at the colony level. We also excluded budget transfers from or to the metropole.Footnote 33 The French colonies were organized along a layer of three to four budgets, depending on whether or not the colony was part of a federation. The model used in French West Africa (l'Afrique Occidentale Française, hereafter: AOF) was copied in French Equatorial Africa (l'Afrique Équatoriale Française, hereafter: AEF) in 1910, and both were derived, in turn, from the model in French Indochina.Footnote 34 The AOF and AEF were made up of respectively eight and four colonies which themselves were subdivided into districts (cercles) and subdistricts. At the subdistrict level, African chiefs were responsible for collecting taxes and recruiting labor.Footnote 35
The federal budget was primarily composed of trade taxes (customs duties) and consumption taxes, which were destined for: (1) the administrative costs at the federal level; (2) the larger public works projects (mainly railroads); and (3) the allocation of subsidies to colonies. The local budgets of the individual colonies were mainly based on direct taxes, such as head taxes, property taxes, or other local trading taxes. Finally, there were annexed budgets to either the federal or local budgets in which the revenue and expenditures from the railways and major ports were documented.Footnote 36
To compare gross per capita public revenue levels on a cross-colony basis we re-allocated the shares of the federal and annexed budget towards the areas of origin (the colonies), thus filtering out the federal effect and creating ‘adjusted’ budgets for the French federal colonies that include the same components as the British colonial revenue budgets. These transfers were substantial and uneven. In 1925 ca. 40 per cent of the Senegalese revenues were transferred to the AOF, whereas Mauritania received 36 per cent of its budget in federal subsidies, without transferring any customs duties or railway receipts. This indicates that the French African federations were redistributive (from rich to poor), although the net-contributors were partly compensated by receiving a larger share of the federal expenditures and also benefitted indirectly from infrastructural investments in the periphery that enhanced trade and labor mobility.Footnote 37
In British Africa, federal structures were used less intensively. The example of the South African Union as a governance model remained limited. The fiscal integration of Uganda and Kenya never went further than a customs union established in 1917 and joined by Tanganyika in 1927. The attempt to force these three countries into a federal structure was only made upon independence and was short-lived. The Central African Federation, consisting of the self-governing dominion of Southern Rhodesia and the British protectorates Northern Rhodesia and Nyasaland was only established in 1953.
Fourth, to avoid potential biases in the per capita comparison we used backward projections of population from a revised 1950 benchmark as suggested by Patrick Manning as well as Ewout Frankema and Morten Jerven.Footnote 38 This method corrects for the fact that early French African population censuses grossly overstated the number of people in large parts of the AOF and AEF, whereas the early British colonial censuses had a tendency to underestimate populations.Footnote 39
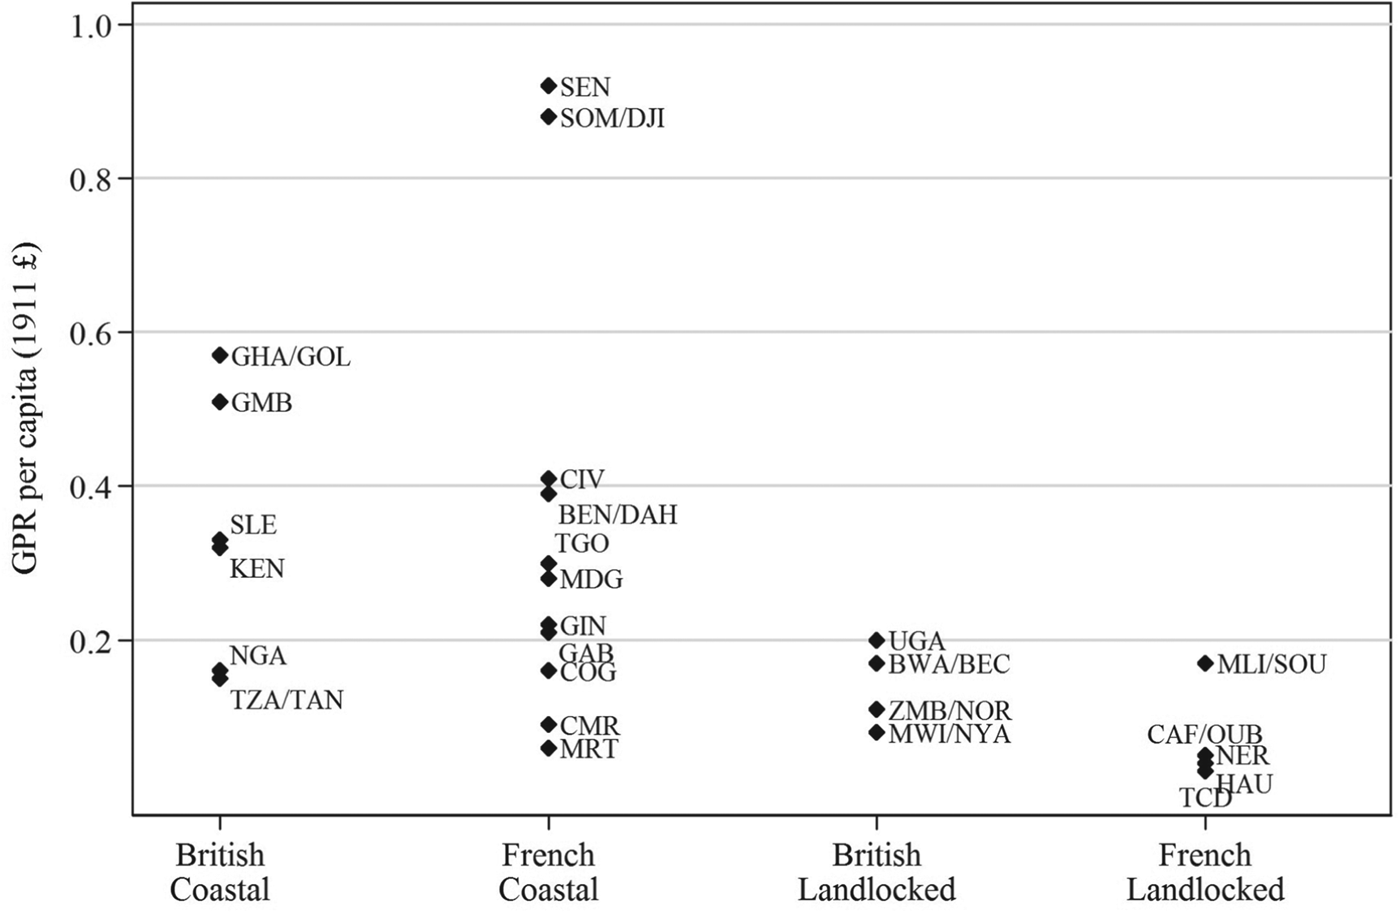
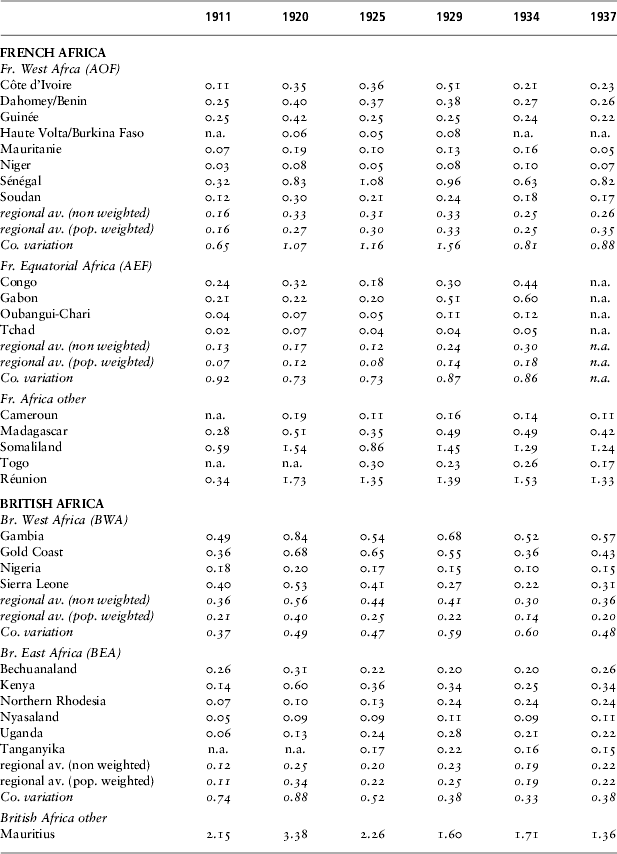
Table 2 shows total Gross Public Revenue (GPR hereafter) per head of the population for the British and French African colonies for all benchmark years in pound sterling (£). It should be noted that the 1920 benchmark might suffer from data biases that overstate the value of gross public revenue. The immediate post-First World War era was plagued by high inflation, which raised the fiscal budget in nominal terms. However, the adaptation of a large part of the cost-structure of the state, namely the salaries of administrative staff, only compensated for this after the general price rise. Therefore, the 1920 benchmark should be interpreted with care, as it may reflect a temporary deviation from the long-term trend. Figure 2 groups these GPR per capita estimates into four categories for the year 1925, distinguishing by colonial power (British-French) and by geographical location (coastal-landlocked).Footnote 40 We note the following.
GPR per capita in BA and FA landlocked and coastal colonies in 1925 (in 1911 £). Notes: The label of the observations is their current three-digit country code. In cases where the colonial name differed from the current name, both have been used. For convenience sake, the codes are: BEN/DAH = Benin/Dahomey; BWA/BEC = Botswana/Bechuanaland; CAF/OUB = Central African Republic/Oubangui-Chari; CMR = Fr. Cameroun; CIV = Côte d'Ivoire; COG = Fr. Congo; DJI/SOM = Djibouti/Fr. Somaliland; GAB = Gabon; GHA/GOL = Ghana/Gold Coast; GIN = Guinée; GMB = Gambia; BFA/HAU = Burkina Faso/Haute Volta; KEN = Kenya; MDG = Madagascar; MLI/SOU = Mali/French Soudan; MRT = Mauritanie; MUS = Mauritius; MWI/NYA = Malawi/Nyasaland; NER = Niger; NGA = Nigeria; REU = Réunion; SEN = Sénégal; SLE = Sierra Leone; SOM = Br. Somaliland; TCD = Tchad; TGO = Togoland; TZA/TAN = Tanzania/Tanganyika; UGA = Uganda; and ZMB/NOR = Zambia/Northern Rhodesia.
Gross Public Revenue per capita in BA and FA Africa for six benchmark years (in 1911 £).
First, the cross-colony variation in per capita government revenue levels in French Africa was larger than in British Africa. Of course, in both empires one can find ‘richer’ and ‘poorer’ administrations, but the revenue gap between Senegal and Niger, both part of the AOF, or Gabon and Chad (both part of the AEF), was about a factor five larger in 1925 than the gap between Kenya and Nyasaland that constituted the ‘richest’ and ‘poorest’ states in BEA. The coefficients of variation for the four regions are: 1.15 (AOF), 0.72 (AEF), 0.47 (BWA), and 0.52 (BEA).
Second, Figure 2 illustrates that, although the British still generated more government revenue on average in both the coastal and landlocked countries in 1925, the primary distinction in terms of revenue generating capacity is between coastal and landlocked colonies. In 1925, no single landlocked colonial state was capable of raising revenue beyond £0.20, whereas the majority of coastal colonies generated (far) greater revenues. This contrast becomes even more pronounced if we include the data for outliers such as Réunion and Mauritius (two sugar islands) with GPR per capita levels of respectively £1.35 and £2.26.Footnote 41 We did not find significant differences in terms of per capita revenue levels between the African settler colonies (in particular Kenya and Southern Rhodesia) and the nonsettler colonies.
Third, a large part of the initial variation between the British and French African regions faded away over time as per capita public revenue levels tended to converge. This is not that surprising if one considers that, although the partition of Africa occurred in a relatively narrow period of time, the actual pace and mode with which these territories were integrated into the British and French African empires differed considerably. For instance, the transition to legitimate commerce in much of West Africa had created a very different starting point for colonial intervention than in East Africa, where commerce remained dominated by exports of slaves and ivory up to the point of European conquest.Footnote 42 Around 1900, British West African trade with Europe was, in per capita terms, more than ten times as large as British East African trade.Footnote 43 Similarly, parts of French West Africa, and Senegal in particular, where colonial ties originated from the 1850s onwards, were much better integrated in the Atlantic economy than most of its Equatorial counterparts.
The relatively low tax yields in the French hinterland areas, such as Niger, Chad, the French Soudan and Haute Volta, were compensated with higher revenues from the richer coastal colonies such as Senegal, Côte d'Ivoire, and Gabon. By the 1930s, French revenue levels were comparable with those in British Africa as a whole. Part of this catching up effort, however, should be attributed to the economic depression of the early 1930s, which eroded the customs revenues in the commercial colonies that had increased so rapidly during the 1920s. The colonial administrations of the AEF were the only ones that managed to raise GPR per capita during the 1930s. With the exception of Tchad, all budgets more than doubled between 1925 and 1934. In part, this rapid catch-up followed from the large-scale expansion of timber exports, known as the ‘okoumé rush’, and the greater administrative capacity to collect direct taxes.Footnote 44 Additionally, the completion of the Congo-Ocean railway in 1934 strengthened the integration of the hinterlands into the imperial economy.
DIRECT AND INDIRECT TAXES
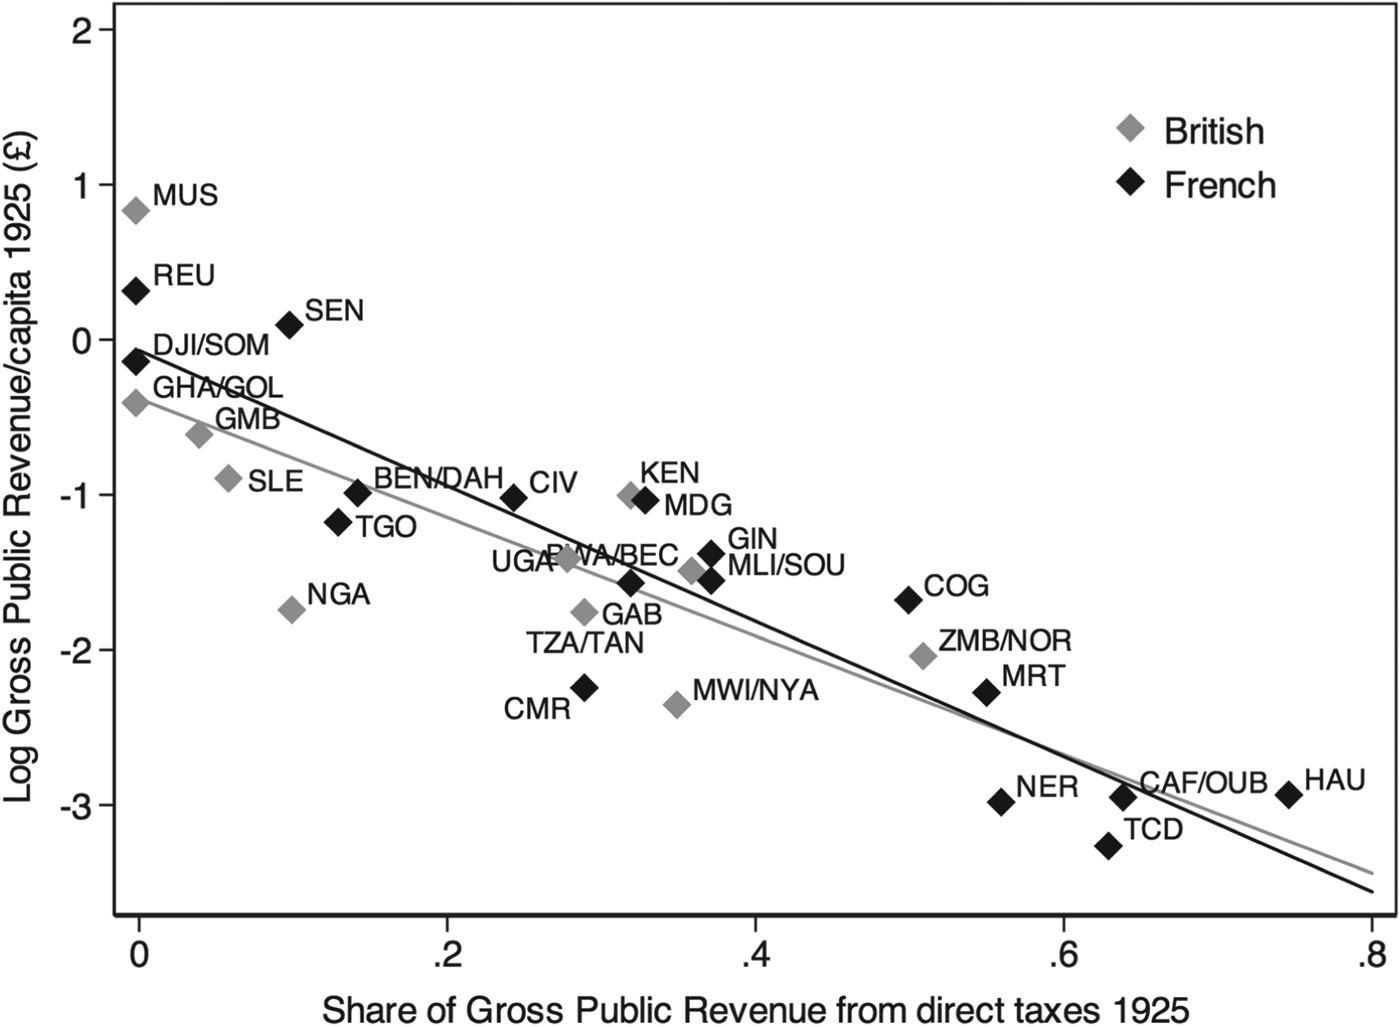
By probing into the source composition of African colonial taxes we add two more findings. To begin with, the extent to which various British and French colonial administrations relied on direct or indirect taxes varied largely, but there was a strong negative correlation between per capita GPR and the proportion of direct taxes, independent of metropolitan identity.
Direct taxes in Africa consisted of taxes that were directly levied on persons, households, huts, cattle, or land, although the latter were rare. Apart from being a potential cause of resistance, direct taxes were also relatively inefficient as it required considerable administrative effort to monitor and collect them. Both the French and the British African authorities had to rely upon native chiefs for the collection of direct taxes. In the early colonial years, the commission rate was up to 20 per cent in the French African colonies.Footnote 45 According to Sara Berry, the strategy of outsourcing tax collection to native chiefs served a dual purpose. Not only was it a means to cut costs, it was also an effective way to integrate existing local power structures into the administrative framework of the new state. As such, she argues, nearly all of the colonial administrations practiced at least some form of indirect rule, regardless whether they had ‘articulated it as their philosophy of imperial governance’.Footnote 46
Customs duties were collected at a central point of entry or exit, and were fairly easy to monitor and enforce. Smuggling and other forms of tax evasion were problematic, but the overall administrative burden was far lower, especially in the absence of solid physical infrastructures and well-oiled bureaucracies. In general, imports were more heavily taxed than exports, so that the burden of taxation fell partly on European manufacturers exporting to Africa and partly on that particular group of Africans that possessed sufficient cash to consume imported European commodities. These were usually not the poorest strata of society and certainly not the subsistence farmers in the hinterlands who produced, bartered, and consumed largely outside the commercial colonial economy. Part of the resistance against trade taxes was thus voiced by metropolitan businesses and trade companies, rather than by African taxpayers. Export taxes did of course meet with resistance from local farmers or European enterprises controlling mines or plantations.
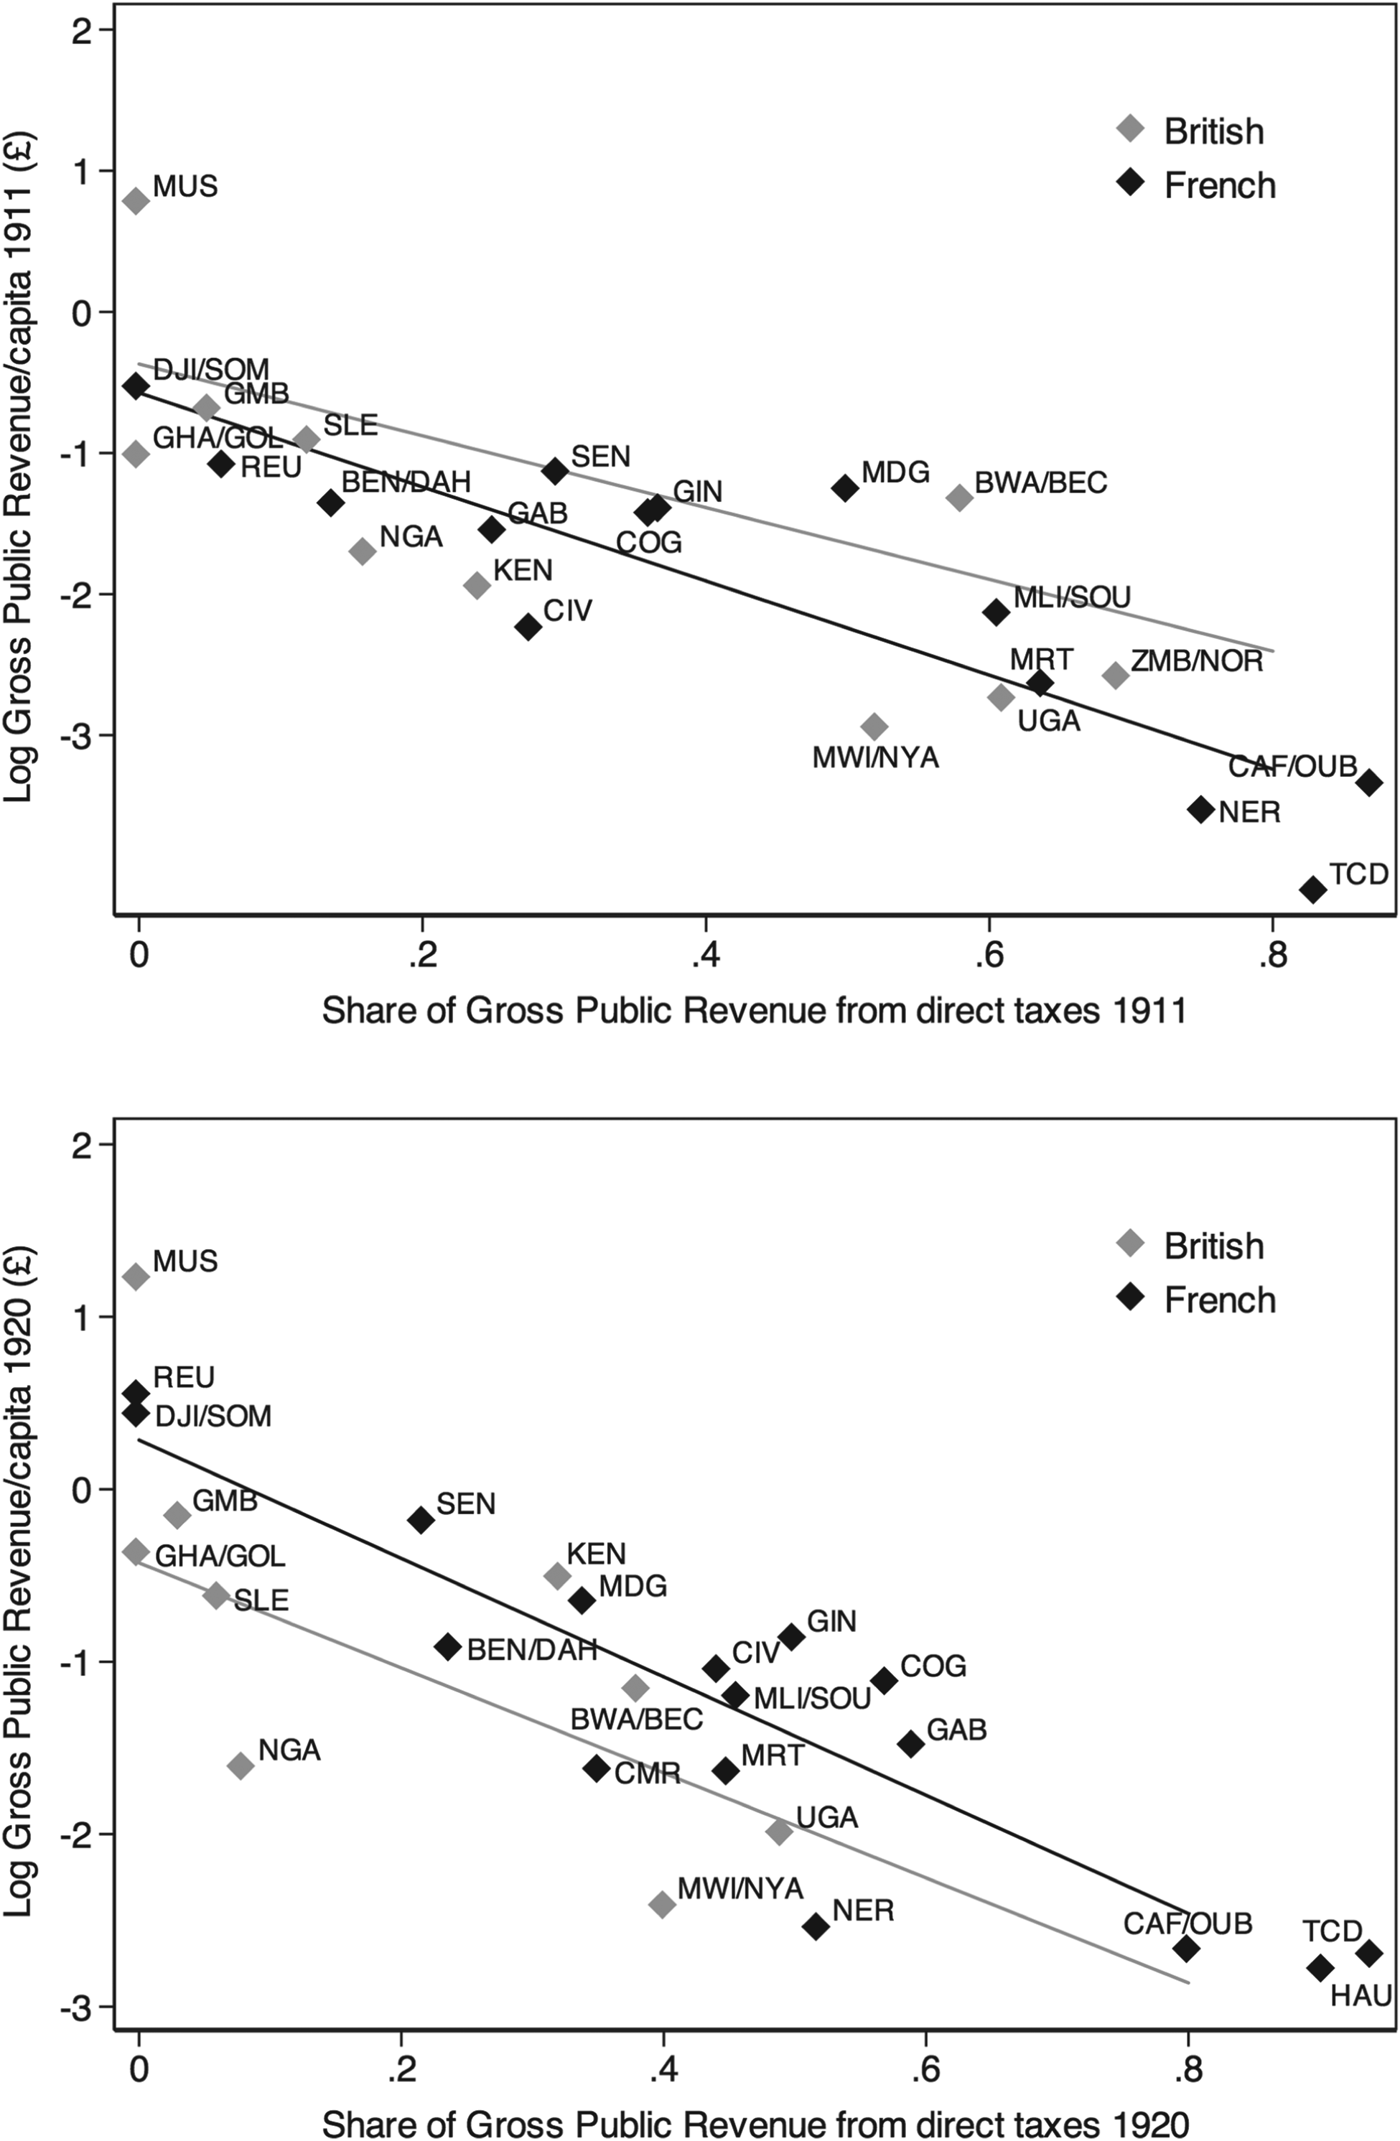
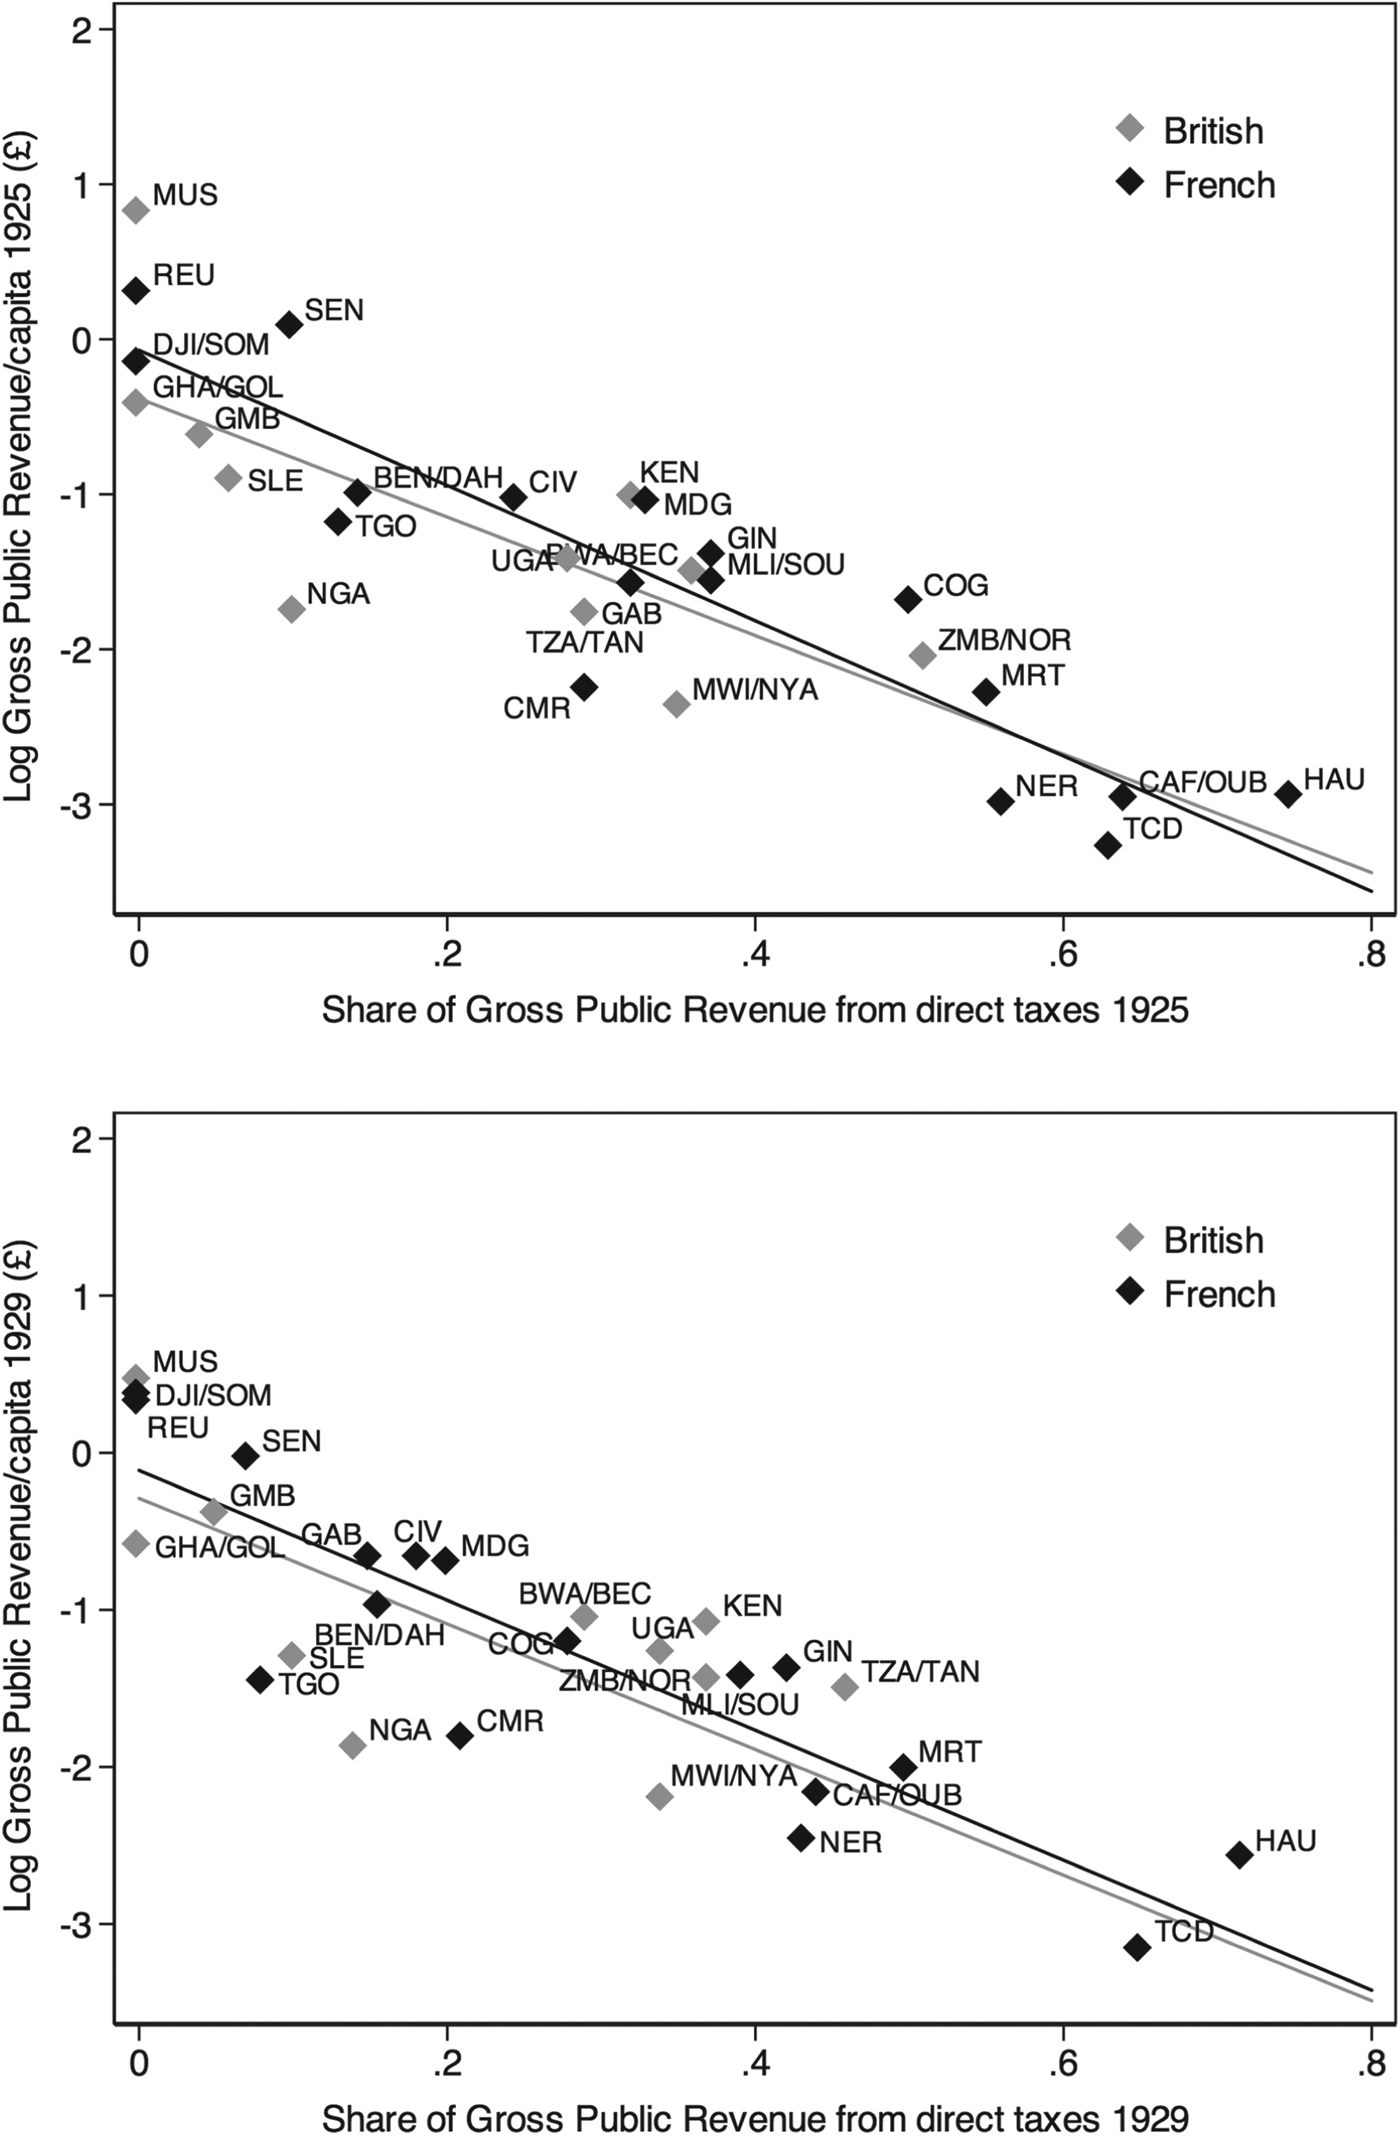
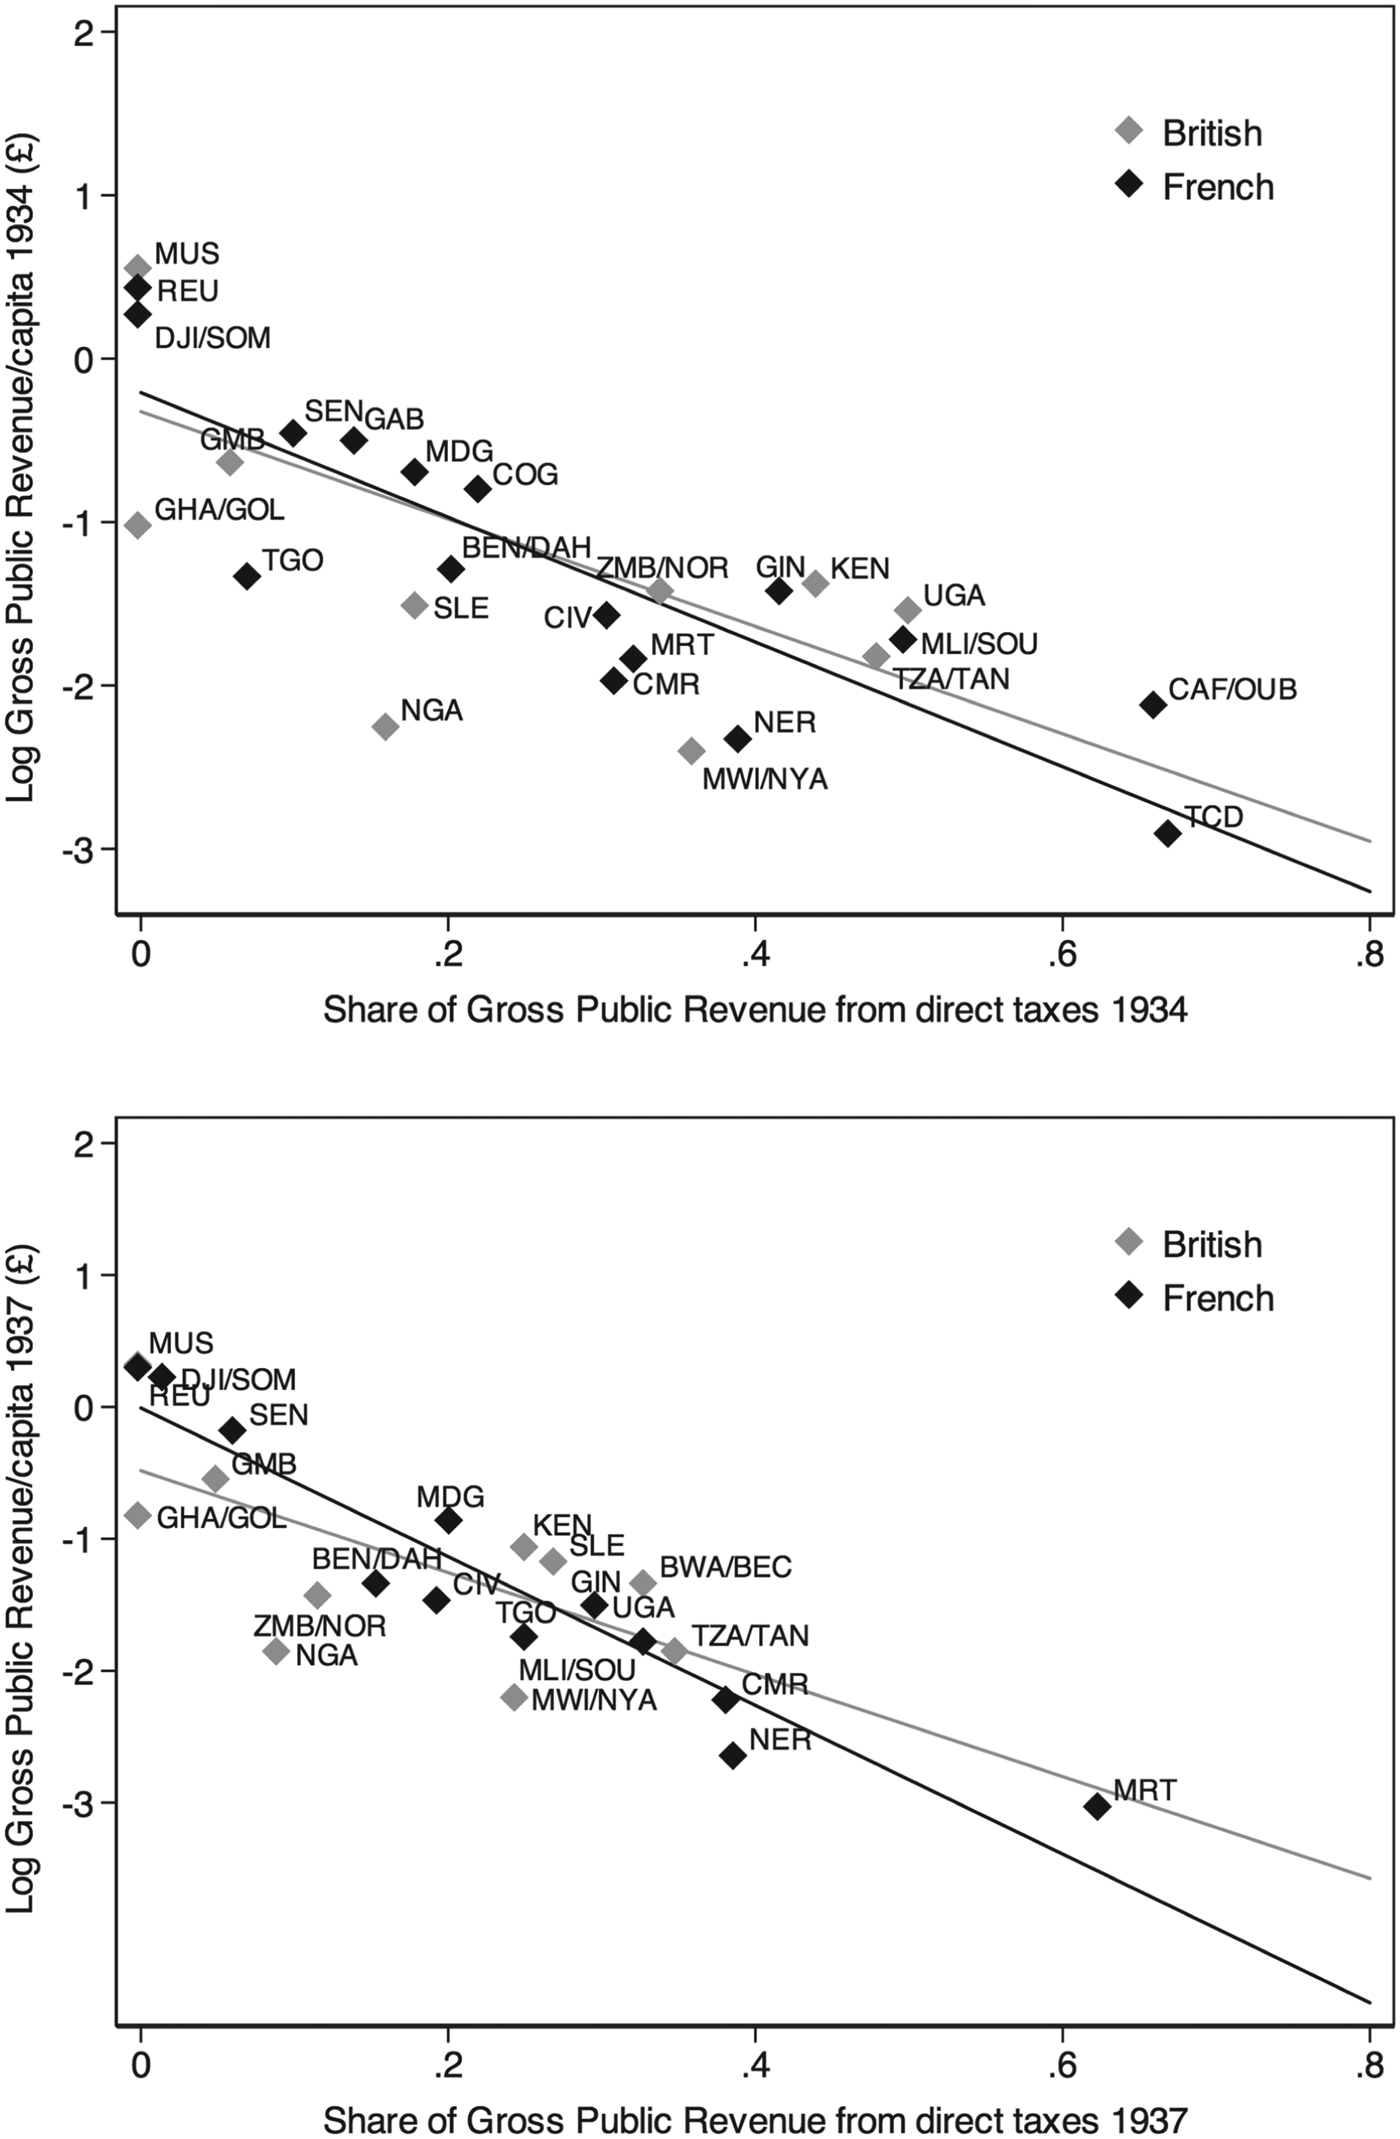
Figure 3 presents the relationship between per capita GPR and the share of direct taxes in total GPR for the 1925 benchmark year. Appendix figures 1a–f show that the observed pattern holds for all benchmark years: in places where the state was able to raise sufficient revenue from taxing trade, governments were happy to drop or minimize direct forms of taxation. No direct native taxes were implemented in the Gold Coast, British and French Somaliland, Réunion, and Mauritius.Footnote 47 Southern Nigeria did not have a direct capitation levy until the early 1930s.Footnote 48 Although Sierra Leone and the Gambia, both colonies where the government could count on significant trade revenues, did have a flat native tax, the rates of these – unlike the ones in French West Africa – did not change over time.Footnote 49
Gross Public Revenue (GPR)/capita (log) vs share GPR from direct taxation in 1925. Notes: The labels of the observations are the same as in Fig. 2.
Colonial governments that did implement direct taxes largely did so out of necessity, as trade taxes simply did not generate enough revenue. In some places, direct taxes still did not raise sufficient state income, necessitating the metropole to step in financially as a last resort; a pattern we observe both in British and French Africa, albeit to differing degrees. Whereas the British did this occasionally in the early years of colonial state formation, and especially in East Africa,Footnote 50 the French had to do this repeatedly to accommodate structural deficits. For example, Paris transferred metropolitan grants to the AEF on an annual basis until the 1930s, and which often constituted up to 25–30 per cent of the revenue raised locally. The AOF, in contrast, received nothing. Catherine Coquery-Vidrovitch points out that with a total trade value of 146 million francs for the AEF in 1920, vis-à-vis 1.2 billion francs for the AOF, the equatorial federation long remained ‘the poor relation among the French colonies’.Footnote 51
Figure 3 suggests that in terms of source composition, there were few systematic differences between the way the British and the French designed their fiscal systems. The scatter plots in the appendix underline this point from a temporal perspective as well: the share of direct taxes declined in virtually all colonies up to 1940, but they did so in a movement along, rather than away from, the fitted line.Footnote 52 This is not to say that additional policy objectives – such as the desire to create ‘governable subjects’, to commodify indigenous labor or to establish political hegemony – did not matter at all for the design of fiscal strategies. Colonial governments at the time certainly articulated and justified their policies in such terms. The words of AOF Government General William Ponty are telling in this respect (1911):
For the native … taxation, far from being the sign of humiliating servitude, is seen rather as proof that he is beginning to rise on the ladder of humanity, that he has entered upon the path of civilization. To ask him to contribute to our common expenses is, so to speak, to elevate him in the social hierarchy.Footnote 53
But our comparative macro-perspective does suggest that these policy objectives first and foremost need to be understood in the context of endogenous African economic and geographical conditions determining the constraints and opportunities to fiscal capacity building.Footnote 54 This also implies that we should be careful not to overemphasize the agency of European colonial governments in Africa.
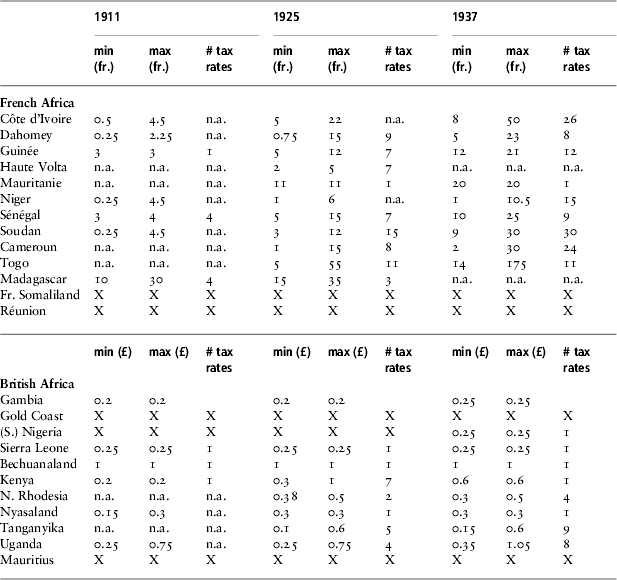
That colonial fiscal policies were greatly dependent on local conditions is also reflected within colonies. Table 3 shows the official minimum and maximum tax rates for each colony, and the total number of different tax rates that were applied there.Footnote 55 All of the maximum rates apply to the main cities, whereas the lower rates were set for the poorest rural hinterlands. Two British-French differences stand out. First, the gaps between minimum and maximum rates were considerably larger in French than in British Africa. In Togo, for example, the minimum-maximum tax rate ratio was around 1:11 in 1925, and in Dahomey (Benin) we even observe a ratio of 1:20. In British Africa, the largest gap that can be observed is 1:4 in Tanganyika in 1937.
Official minimum and maximum native tax rates in 1911, 1925, and 1937. Notes: Taxes rates for French Equatorial Africa were not systematically reported in our sources.
A second point of interest is that the French adjusted their tax rates more frequently than the British. In part, this was caused by higher inflation rates in French Africa (see Table 1).Footnote 56 But it also reflects a higher degree of precision in French fiscal administration. The British tended to levy head taxes or poll taxes on each adult male, or each hut, house, or yard. In some cases, these were complemented by a ‘multiple wives tax’ to make taxes somewhat more progressive. The French on the other hand, introduced separate tax rates for men, women, and children above a certain age. The French also levied alternative forms of taxation in large parts of Mauritania, Niger, and French Soudan, such as the zekkat, which was a percentage levy on the value of cattle.Footnote 57
Differentiation of tax rates was thus the rule everywhere, but the range of rates and tax instruments was wider in French Africa. A closer look at the ‘micro-level’ aspects of fiscal capacity building, such as varying district level tax rates and household differentiation, underlines the idea that local conditions shaped colonial tax systems: neither the British nor the French randomly assigned tax rates, their choices were largely guided by African constraints, rather than European policy preferences.
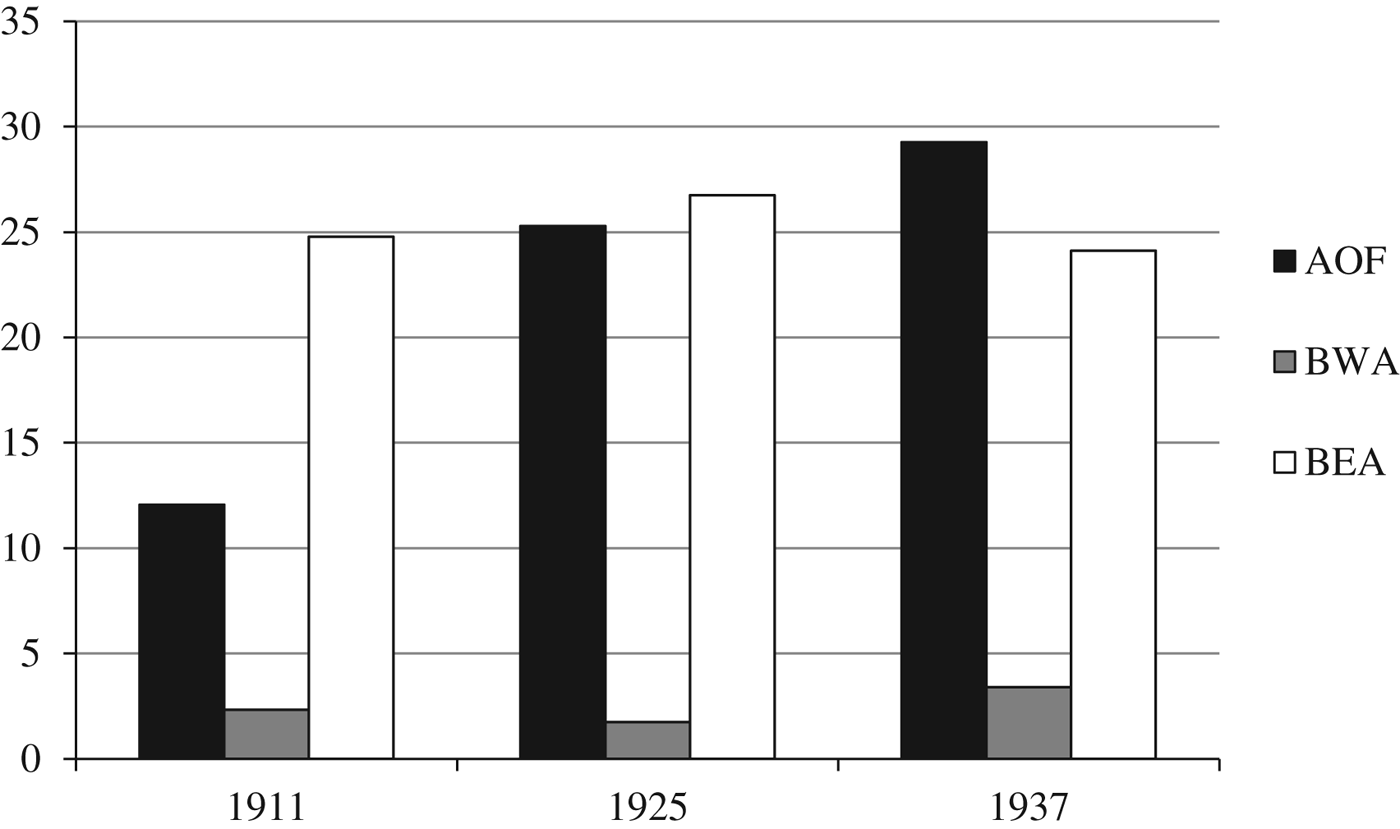
The large variation in the imposition of direct taxes translated into varying tax burdens as well. We can provide some rough estimations of direct tax pressure, by transforming the nominal tax rates into the number of working days required to meet the average rate of taxation, using urban unskilled wage rates. We focus exclusively on the urban areas, as we lack differentiated information on countryside wage rates.Footnote 58Figure 4, depicting a regional average for the AOF, BWA, and BEA, shows that tax pressure for urban unskilled labor in the British areas remained fairly stable over time, but that the levels were much higher in BEA than in BWA, testifying to a very different approach of British colonial governments in the East and the West. Tax pressure in the AOF increased substantially in the course of the colonial period, which partially allowed the French West African colonial states to catch up in terms of GPR per capita levels. But above all figure 4 shows that, despite the higher supposed levels of coercion in French colonies, it took the AOF at least 15 years longer to reach the average rates of direct tax pressure recorded in BEA in 1911.
Number of working days for urban unskilled labor required to meet the annual direct tax obligation in major cities.
FORCED LABOR
One important aspect of the colonial fiscal state that we have set aside so far, and which links up with a discussion about varying tax burdens, are the implicit taxes that were levied in the form of forced labor obligations. Forced labor schemes were pervasive in both French and British Africa, and were deeply rooted in precolonial forms of labor coercion such as slavery, labor pawning, debt bondage, and communal labor services. They were imposed by the colonial state and by ‘private agents’ – chiefs, creditors – leading to a wide range of different practices regarding the type of work to be performed, the labor conditions, the number of days of work, and the compensation that was to be received in return, if any. It is worthwhile to briefly explore the extent of cross-colonial uniformity and variety in the use and regulation of labor corvée services.
Although colonial states justified the implementation of forced labor services as being part of their ‘civilizing mission’, the forced recruitment of native labor was above all key to solving the ‘revenue dilemma’ in largely rural and non-monetized African economies.Footnote 59 The development of infrastructural networks, as well as the expansion of mining and cash-crop enclaves, required vast numbers of African workers, which were in many places difficult, if not impossible, to recruit via free labor markets.
Regarding the use of labor services by the state it seems safe to conclude that the French organized this practice in a more systematic manner than the British, and that in terms of implicit additional tax income, probably also relied on it to a larger degree. This would explain why the French ignored the growing criticism by international antislavery and pro-labor organizations, by refusing to sign the treaties of the International Labor Organization (ILO) that were aimed at curtailing this practice in the 1930s; treaties that the British did sign.Footnote 60
The prestations in French Africa, which became officially regulated in 1912, applied to every African over the age of 15 for a maximum of 12 working days against a fixed daily ration, and were to be carried out on projects within five kilometers of the workers’ residence, such as railway construction, road clearing, road maintenance, school building, porterage, and the cultivation of cash-crops. Europeans and the so-called évolués were generally officially exempted from this labor tax, or they, together with some of the richer African families, enjoyed the privilege of being able to ‘buy-out’ their labor obligations.Footnote 61 These services were coordinated by district administrators, local chiefs and village heads, and were often poorly supervised.
The British did not introduce an equivalent uniform legal framework for forced labor practices, and took a more pragmatic approach, with widely varying intensities of labor coercion.Footnote 62 In the more commercialized areas with well-functioning labor markets, such as in the rapidly expanding cocoa sector in the Gold Coast, forced labor practices were implemented (or maintained) in order to preserve part of the scarce labor supply for public works, especially local infrastructure projects. Workers were recruited by local chiefs and were usually paid for their services in cash or kind. In Uganda, the British adopted the indigenous practice of kasanvu (labor tribute) and allowed people to choose: either conduct public work for a fixed number of days, or avoid the tax by cultivating cotton, which allowed the colonial state to capture rents from trade taxes. So both through the threat of forced labor and the actual practice of it, the British tried to enhance state revenue.Footnote 63
In British East Africa, labor migrants from British India also relieved part of the labor demand for large-scale infrastructural projects, such as the construction of the Mombasa-Uganda railway, which involved approximately 30,000 indentured workers.Footnote 64 Finally, the British made effective use of large-scale land alienation and the creation of native reserves in Kenya and Southern Rhodesia to raise revenue, enabling European settlers to develop commercial agriculture and enhancing the potential value of trade taxes, and at the same time converting African farmers into wage workers to run the plantations and mines.Footnote 65
Both the British and the French relied upon the cooperation of native chiefs to recruit the demanded labor, but payments for this service seem to have been more common in British African colonies. The harshest forms of forced labor were adopted in the fiscally least developed areas, where the colonial government's desperate scramble for revenue made it resort to outright repression. Although we lack reliable quantitative evidence for the AEF, the most severe excesses of forced labor regimes seem to have occurred there. The construction of the Congo-Océan railway between 1921 and 1934, for example, was a project that could only be funded by extensive and repeated subsidies from Paris and by coercing more than 127,000 African men to work on its construction without pay other than food rations, killing at least 20,000 men through poor labor and health conditions.Footnote 66
To what extent was the more systematic use of forced labor in French Africa the outcome of a different and more ambitious style of French imperial governance, in which they put more pressure on the indigenous population to finance a heavier colonial state apparatus? We do not have sufficient space to explore this question in detail here, but reasoning by analogy from the observed variation in indirect-direct taxes, one is inclined to believe that the practice of forced labor was more intensive in areas where alternatives were scarce. The challenge of mise en valeur was greater in French Africa, and higher degrees of labor coercion would, at least to some extent, redress the grave fiscal imbalances within the colonial federations. In the 1920s, the prestations were lowered in Sénégal from ten days of labor service to four under pressure of increasing local resistance against the system. In the AEF they were maintained at a ten days minimum.
This hypothesis clearly warrants further research and could possibly be informed by an analysis of the Congo Free State (Belgian Congo after 1908). What made the Congo Free State unique from its very inception as a constructed and partly illusory political entity was the stipulation in the Berlin conference treaty that it was free trade zone, where any form of trade taxes was prohibited.Footnote 67 The atrocities that were committed in the Congo are widely considered as among the worst scenarios of colonial repression and exploitation. In effect, by ruling out in advance the significant fiscal resources to be derived from trade taxes, the Congo offers something of a limited case for contemplating the implications of a state dependent upon revenue derived exclusively through prestations.
CONCLUSION
Despite the different objectives and structures of French and British colonial governance in Africa, the formation of the fiscal state was primarily determined by the opportunities and constraints set by local commercial and environmental conditions, including African responses to intensifying colonial connections. French and British colonial administrations introduced a wide range of different tax instruments, but the overall logic was broadly similar: substitute direct taxes for indirect taxes whenever possible and use forced labor to enhance trade and customs revenues. Our comparative analysis has generated three kinds of evidence underpinning this claim.
First, we found that the most important determinant of per capita revenue levels was the location of the colony (coastal or landlocked), independent of it being ruled by a British or French colonial government. That French per capita budgets were initially smaller was the outcome of British-French competition, especially in West Africa, in which Britain managed to secure the more prosperous and/or commercially most promising areas.
Second, in terms of the source composition of colonial taxes, we found a negative relationship between budget size and direct tax shares that was remarkably strong, remarkably similar across British and French territories and remarkably persistent up to 1940. Although the imposition of direct native taxes has mostly been interpreted as serving a wide range of policy objectives, such as labor commodification, civilizing the native subject and the integration of local power structures, a comparative analysis suggests that this tax instrument was considered to be a second-best alternative in view of lagging custom revenues. The highest direct tax shares were to be found in the least commercialized areas. These were also often, though not always, the areas that were subdued later in time: British East Africa as opposed to British West Africa, and the landlocked areas of French West Africa and French Equatorial Africa as opposed to the coastal French territories.Footnote 68
Third, we found no marked difference in terms of the temporal development of colonial state budgets. Infrastructural and agricultural investments that were meant to unlock the economic potential of African hinterland areas increased the potential of revenue collection over time. In the majority of cases tax revenues increased (in nominal and real terms) by enlarging the share of indirect taxes and non-tax revenues (railway receipts mainly). Commercialization thus changed the composition of the fiscal system and it did so both in British and French Africa.
The most important British-French distinction is probably the French preference for federal governance structures. But the federal political system was not just the product of a ‘French’ blueprint of imperial organization, it can also be regarded as a solution to a fiscal problem: how to integrate vast sparsely settled hinterland areas into a fiscally viable state structure? Colonies such as Niger, Mauritania, Chad, and Oubangui-Chari were heavily supported by an overarching federal governance structure where part of the costs of state formation (defense, administration) was born collectively. The federations of the AOF and the AEF greatly facilitated the process of integrating hinterland areas into the Atlantic economy through the construction of roads and railways. The drawback was that economic centers of gravity such as Sénégal, Côte d'Ivoire and Gabon had to give up part of their control over tax revenues, especially customs duties.Footnote 69 The British integrated neighbor territories in federations or customs unions as well, but in a more ad hoc fashion. However, within these overarching structures, local administrations differentiated tax rates and labor corvée services in order to align their tax systems with local political and economic conditions. And whenever British or French administrations could finance the state without imposing direct taxes they chose to do so.
APPENDIX
A1. Construction PPPs
The thinking behind using so-called colonial government purchasing power parities is to express local fiscal revenues in terms of local cost-structures, and more specifically the price of different categories of labor hired by the colonial government. This method is likely to produce a better approximation of the comparative value of fiscal revenues than using the official exchange rates of the British pound and the French franc. These exchange rates were particularly volatile during the inter bellum and primarily responded to macroeconomic conditions in the mother countries.
The PPPs were calculated in three steps. First, we took the unweighted average unit wage or salary values of three countries in British Africa (BA: Gold Coast, Gambia, and Sierra Leone) and French Africa (FA: Dahomey, Sénégal, and Côte d'Ivoire) for which there are comparatively good records. The equation for French Africa is:
 $$UV_{ij}^{FA} = \displaystyle{{\sum\limits_{i = 1}^{x = 1 - n} {uv_{ij}^{x^{FA}}}} \over n}$$
Where x refers to each of the individual colonies, n = 3 and UV ij refers to the unit values of the four government expenditure categories i, that is, an indigenous school teacher (low rank), an indigenous clerk (low rank), an unskilled worker in government service (construction worker, gardener, cleaner, messenger, or any other comparable type of job with comparable annual earnings) and a skilled construction worker (carpenters as a rule), in each of the six benchmark years j. For British Africa we did the same.
Second, we matched the wage and salary UVs for each category i and each year j to obtain the French-British unit value ratios:
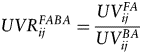 $$UVR_{ij}^{FABA} = \displaystyle{{UV_{ij}^{FA}} \over {UV_{ij}^{BA}}} $$
Third, we aggregated the UVRs up to a PPPj for each year j applying equal weights (¼th) to the four expenditure categories i:
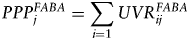 $$PPP_j^{FABA} = \sum\limits_{i = 1} {UVR_{ij}^{FABA}} $$
GPR/capita (log) vs share GPR from direct taxation in 1911 & 1920.
GPR/capita (log) vs share GPR from direct taxation in 1925 & 1929.
GPR/capita (log) vs share GPR from direct taxation in 1934 & 1937.
Unit Value Ratios and Purchasing Power Parities, 1911–37. Notes: Starting salaries of indigenous clerks and teachers were derived from those with a rank just above a probationer/stagaire.
A2. Sources PPPs and government revenues
Sources British Africa:
Colonial Office: Bechuanaland Protectorate, Blue Book (Colonial Office), various issues.
The Bechuanaland Protectorate, Blue Book (Mafeking: Government Printing Office), various issues.
The Gold Coast Colony, Blue Book (Accra: Government Printing Office), various issues.
The Colony of the Gambia, Blue Book (Bathurst: Government Printing Office), various issues.
The British East Africa Protectorate, Blue Book (Nairobi: Government Printing Office), various issues; this publication changed into The Colony and Protectorate of Kenya, Blue Book (Nairobi: Government Printing Office), various issues.
The Colony of Mauritius, Blue Book (Port Louis: Government Printing Office), various issues.
The Colony and Protectorate of Nigeria, Blue Book (Lagos: Government Printing Office), various issues; Annual Report on the Social and Economic Progress of the People of Nigeria for 1938 (London: His Majesty's Stationary Office), 1938.
Northern Rhodesia, Blue Book (Livingstone: Government Printing Office), various issues.
Nyasaland Protectorate, Blue book (Zomba: Government Printing Office), various issues.
Sierra Leone, Blue Book (Freetown: Government Printing Office), various issues. The Tanganyika Territory, Blue Book (Dar es Salaam: Government Printing Office), various issues.
The Uganda Protectorate, Blue Book (Kampala: Government Printing Office), various issues.
Sources French Africa:
Gouvernement Général de l'Afrique Occidentale Française: Budget Général (Goree, Imprimerie du Gouvernement Général), various issues.
Annuaire Statistique de l'Afrique Occidentale Française et du Togo Placé sous Mandat de la France (Paris: Agence Économique de L'Afrique Occidentale Française), issues 1936, 1937, 1938, années 1950 à.
Côte d'Ivoire, Budget du Service Locale (Bingerville: Imprimerie, du Gouvernement Général), various issues; this publication changed into: Côte d'Ivoire, Budget du Service Locale (Bingerville: Imprimerie, du Gouvernement Général), various issues.
Dahomey & Dépendances, Projet de Budget, Recettes et des Dépenses (Porto-Novo: Imprimerie, du Gouvernement Général), various issues; this publication changed into Colonie du Dahomey, Budget du Service Locale (Porto-Novo: Imprimerie du Gouvernement Général), various issues.
Budget Locale de la Guinée Française (Conakry: Imprimerie du Gouvernement Général), various issues.
Budget Locale du Haut-Sénégal-Niger (Bamako: Imprimerie du Gouvernement Général), various issues. Early volumes include Budget Annexe de Territoire Militaire du Niger, various issues.
Budget Local de la Haute-Volta (Bamako: Imprimerie du Gouvernement Général), various issues.
Comptes Définitifs des Recettes et Dépenses, Budget Annexe Territoire Civil de la Mauritanie (Goree: Imprimerie du Gouvernement Général), various issues.
Comptes Définitif des Recettes et Dépenses, Budget Local de la Mauritanie (Saint-Louis: Imprimerie du Gouvernement Général), various issues.
Comtes Définitif des Recettes et Dépenses de la Colonie du Niger (Gorée: Imprimerie du Gouvernement Général), various issues.
Colonie du Sénégal, Budget des Pays de Protectorat (Saint-Louis: Imprimerie du Gouvernement Général), various issues.
Colonie du Sénégal, Compte Définitif des Recettes et Dépenses (Saint-Louis: Imprimerie du Gouvernement Général), various issues.
Budget Local du Soudan Français (Koulouba: Imprimerie du Gouvernement Général), various issues.
République Française, Ministère des Colonies, L'Afrique Équatoriale Française, Budget Général (Brazzaville: Imprimerie du Gouvernement Général), various issues. These volumes include: Budget Local du Gabon, Budget Local du Moyen Congo, Budget Local de L'Oubangui-Chari, Budget Local du Territoire du Tchad.
L'Afrique Équatoriale Française Budget Local, Comptes Définitifs des Recettes et Dépenses (Brazzaville: Imprimerie du Gouvernement Général), various issues.
Cameroun, Budget des Recettes et des Dépenses (Yaoundé: Imprimerie du Gouvernement), various issues.
Madagascar et Dépendances, Budget des Recettes et des Dépenses du Service Local (Tananarive: Imprimerie Officielle), issues; various issues.
Ile de la Réunion, Service Local, Exposé des Motifs et Projet de Budget Local (Saint-Denis: Imprimerie Centrale Albert Dubourg, Imprimeur du Gouvernement), issues; various issues.
Protectorat de la Côte Française des Somalis et Dépendances, Budget des Recettes et des Dépenses (Paris: Imprimerie Nationale), various issues.
Territoire du Togo, Budget Local (Imprimerie de L’École Professionelle), various issues.