1. INTRODUCTION
Cruise tourism is composed of the tourist attractions available at the destinations that form the itinerary in addition to on board entertainment and leisure facilities, amenities and services. One of the most differentiating features of cruise tourism with respect to other tourist typologies is that the accommodation facility, that is, the vessel, moves from destination to destination. Therefore, the cruise vessel has the threefold function of accommodation facility, means of transport and tourist attraction. This article analyses the relationship between the changes in the cruise market and the consequences of such changes for the itinerary design process related to cruise seasonality patterns.
From 1990 to 2017, the number of worldwide ocean cruise passengers grew, on average, by 7·37% yearly. The positive path seems likely to continue as forecasts indicate an average growth rate of 3·15% yearly until 2020 (Cruise Market Watch, 2018). This superb growth rate, which is accompanied by a greater number of repeat cruise passengers, has encouraged cruise lines to reinvent themselves continuously to offer new experiences, which is done in three ways: (1) creating new experiences on board through new facilities (Cruise Trade News, 2018; MSC Cruises, 2018); (2) within a cruise region, varying the itineraries offered, including ports with different characteristics (Jeon et al., Reference Jeon, Duru and Yeo2019; Luković and Božić, Reference Luković, Božić, Gibson, Papathanassis and Milde2011), and (3) seeking out new cruise regions (Pallis, Reference Pallis2015; Wang et al., Reference Wang, Wang, Zhen and Qu2017). Therefore, these factors have a direct impact on the process of cruise itinerary design, as the itinerary is the core element of cruise traffic. The Caribbean Sea and the Mediterranean Sea are the two most popular cruise regions: in 2017, they accounted for 35·4% and 15·8% of the deployed cruise ship capacity, respectively. Additionally, there are six more major cruise regions plus a set of emerging destinations. Each of these registered the following deployed capacity in 2017: Europe (without the Mediterranean) 11·3%, China 6·0%, Australia/New Zealand/Pacific 6·0%, Asia (without China) 4·4%, Alaska 4·3%, South America 2·1% and emerging destinations 14·6% (CLIA, 2017).
The cruise industry has entered a mature stage in North America (Jones, Reference Jones2011), the largest cruise source market in the world, as growth of the new-to-cruise segment diminishes (Sun et al., Reference Sun, Kwortnik and Gauri2018), which forces cruise lines to reinvent themselves to offer new cruise experiences. Consequently, the number of repeat cruise passengers is increasing, forcing cruise lines to innovate their itineraries to offer a novel experience to these passengers and thus maintain their interest in cruising. In fact, tourism research has identified a variety of differences between new and repeat cruise passengers, for example, in terms of demographics, behavioural factors, preferences or expenditure patterns (Choo and Petrick, Reference Choo and Petrick2012; Hosany and Witham, Reference Hosany and Witham2010). Moreover, cruise lines move ships to other regions to develop new markets where growth potential is stronger (Sun et al., Reference Sun, Feng and Gauri2014).
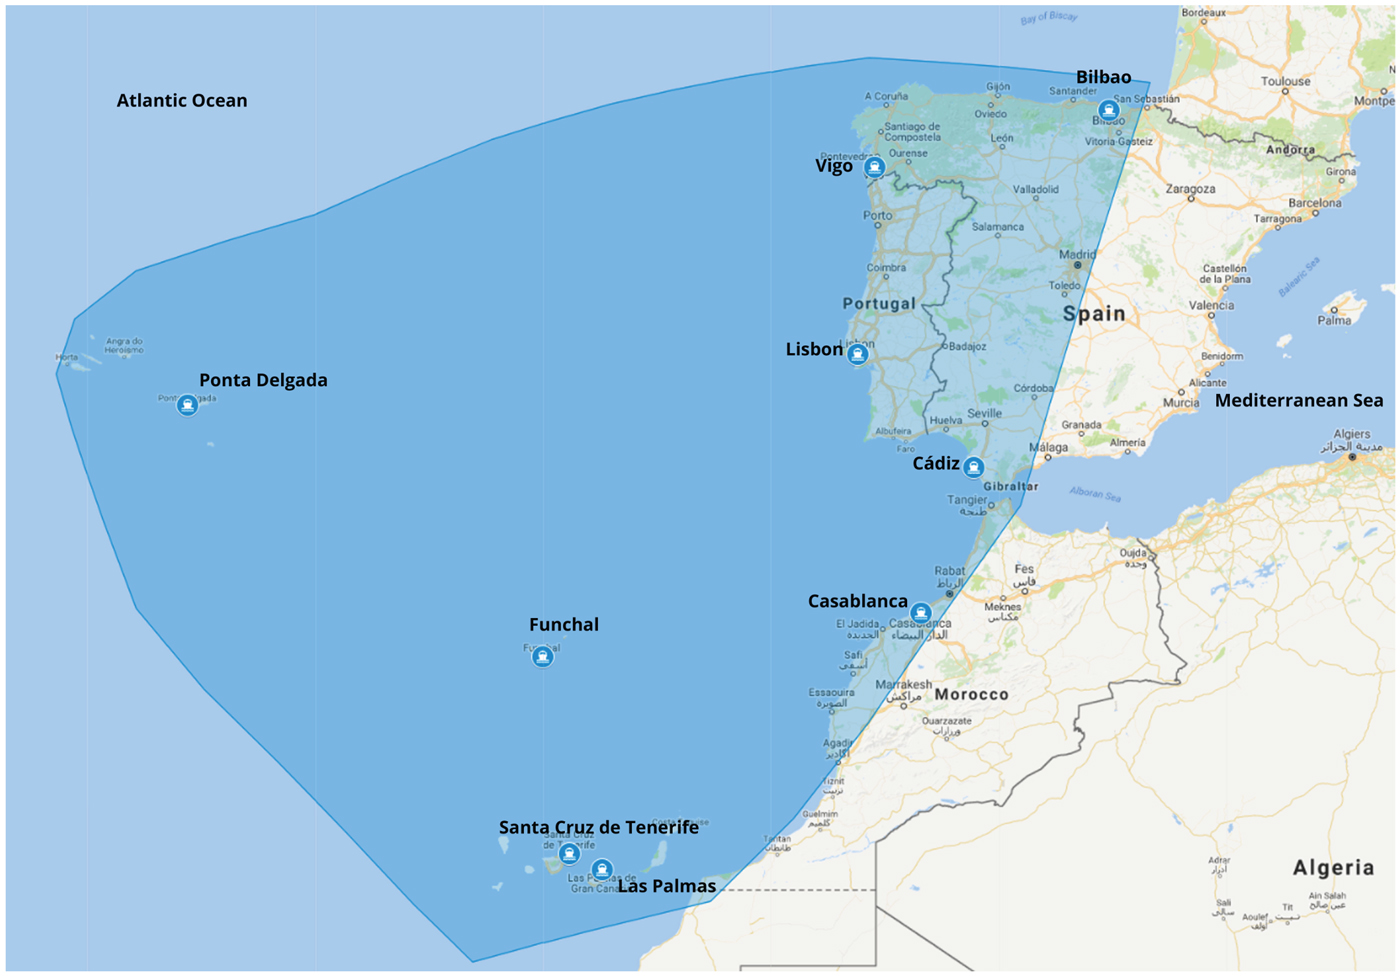
This paper focuses on a cruise region located between the two most popular regions, the north-eastern sector of the Atlantic Ocean, because it is the only region available for intermediate calls in repositioning itineraries between the west coast of the Atlantic Ocean and Europe. This sector is composed of the archipelagos of the Canary Islands, Madeira and Azores and by the mainland Atlantic coast of Morocco, Portugal and Spain (see Figure 1). For instance, the deployed capacity in the Canary Islands in 2017 was 2·0% (Cruise Industry News, 2017). Additionally, this study examines the northeast sector of the Atlantic Ocean because there is a lack of research focus on this region (Esteve-Perez and Garcia-Sanchez, Reference Esteve-Perez and Garcia-Sanchez2015; Tichavska and Tovar, Reference Tichavska and Tovar2015). The goals of this article are (1) to show whether cruise seasonality patterns are associated with destination regions and not with ports in isolation, and (2) to determine cruise traffic seasonality patterns present in the area of study which are influenced by the need to provide new destination regions due to growing demand.
Northeast sector of the Atlantic Ocean highlighting the area of analysis.
Source: Author's elaboration through Google (2018).

The main contributions of this research are (1) the proposal of a ‘dynamic’ classification of cruise ports by size, and (2) the identification of two port clusters with different seasonality patterns through the application of cluster analysis. The results obtained through this research are of interest to port managers and tourist hinterlands because they offer information on cruise port sizes and the effects that the changes in the cruise market have on the seasonality patterns of the destination regions. The results are also of interest to cruise lines because they offer information on different seasonality patterns, which are a consequence of the interdependence between neighbouring destination regions.
The remainder of the article is organised as follows: Section 2 provides a brief literature review on the relationship between transport of cruise passengers and global deployment of vessels, and the issues related to cruise itinerary design. Section 3 describes the data and presents the methodological approach to determine seasonality patterns and to classify ports into clusters. Section 4 reports the empirical results, and the implications of these results are discussed in this section. Section 5 presents the investigation's conclusions.
2. BACKGROUND: RELATIONSHIP BETWEEN TRANSPORT OF CRUISE PASSENGERS AND GLOBAL DEPLOYMENT OF CRUISE VESSELS
Cruise itineraries are executed via the deployment of vessels in a specific geographic cruise region (Pallis, Reference Pallis2015). From a geographical point of view, a cruise itinerary encompasses three areas: (1) the sea area where the itinerary occurs; (2) the ports, homeport and ports of call that compose the itinerary; and (3) the tourist hinterland visited at each call.
2.1. Types of cruise itineraries
Cruise regions can be classified into two types: annual (perennial) and seasonal. In annual regions, cruising activity remains active throughout the year, albeit with differences in the deployed capacity from one season to another. The Caribbean and the Mediterranean are examples of annual regions because cruise vessels are present in the region throughout the year. In these regions, regular itineraries are offered year-round. In seasonal regions, cruising activity only occurs during a specific period or season. Seasonal regions can be explained primarily by weather-related factors that make it difficult to sail during specific seasons of the year. The main weather-related factors associated with the off-season are a high probability of maritime storms, significant wave height, low temperatures and a high probability of strong winds. Alaska and Northern Europe are examples of seasonal regions because there is no deployed cruise ship capacity for certain months every year. Therefore, regular itineraries are offered only during the active season.
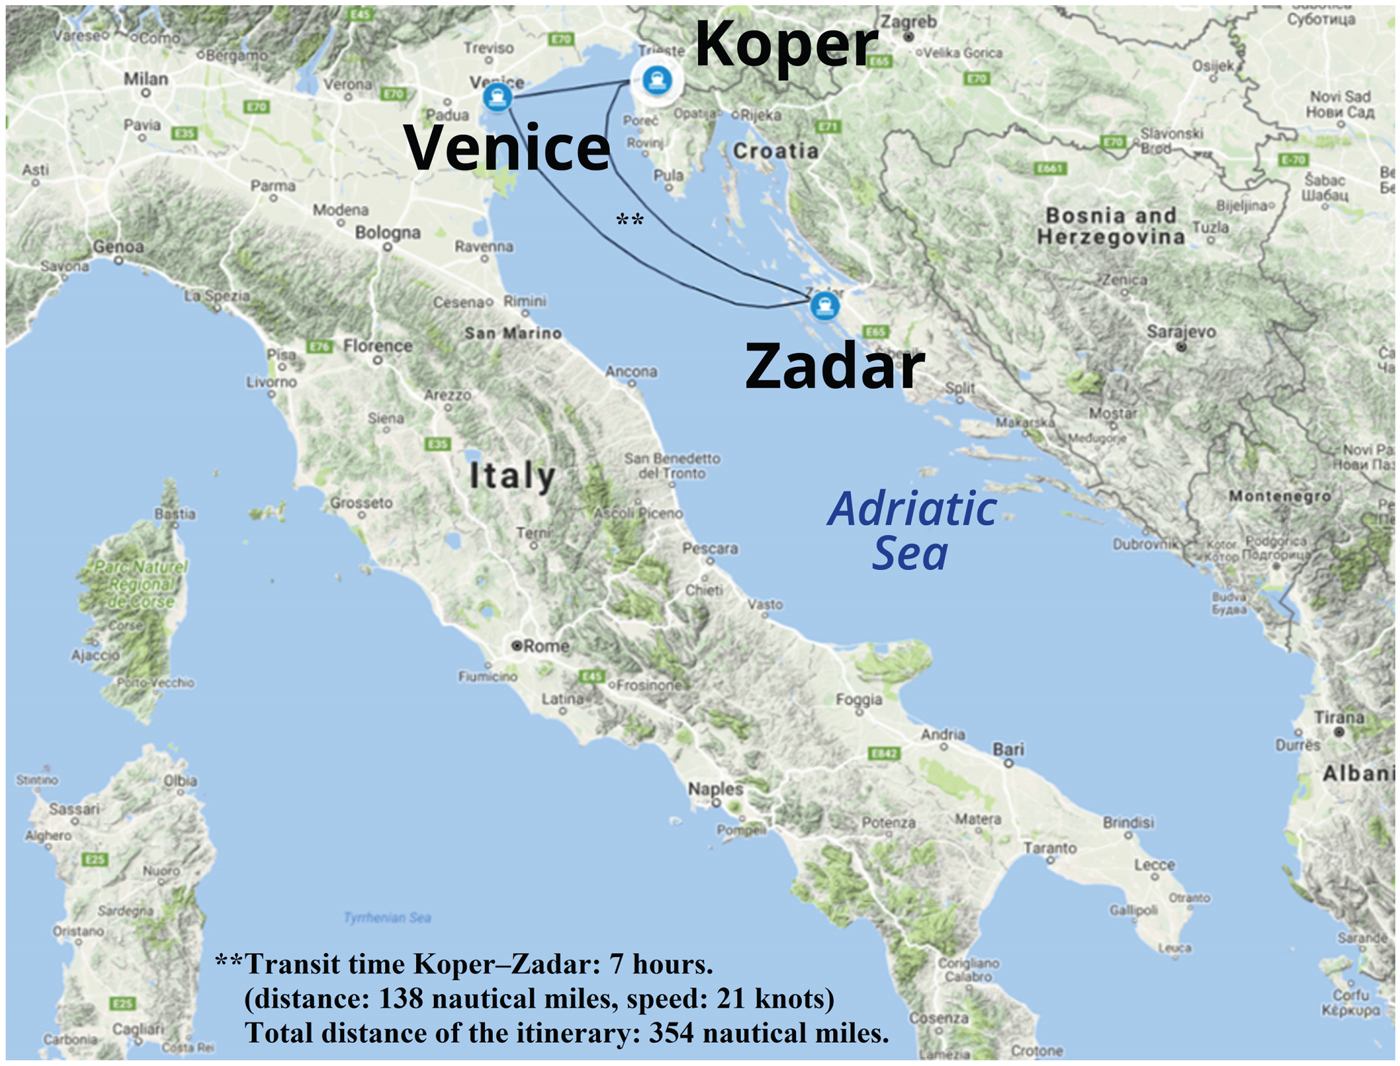
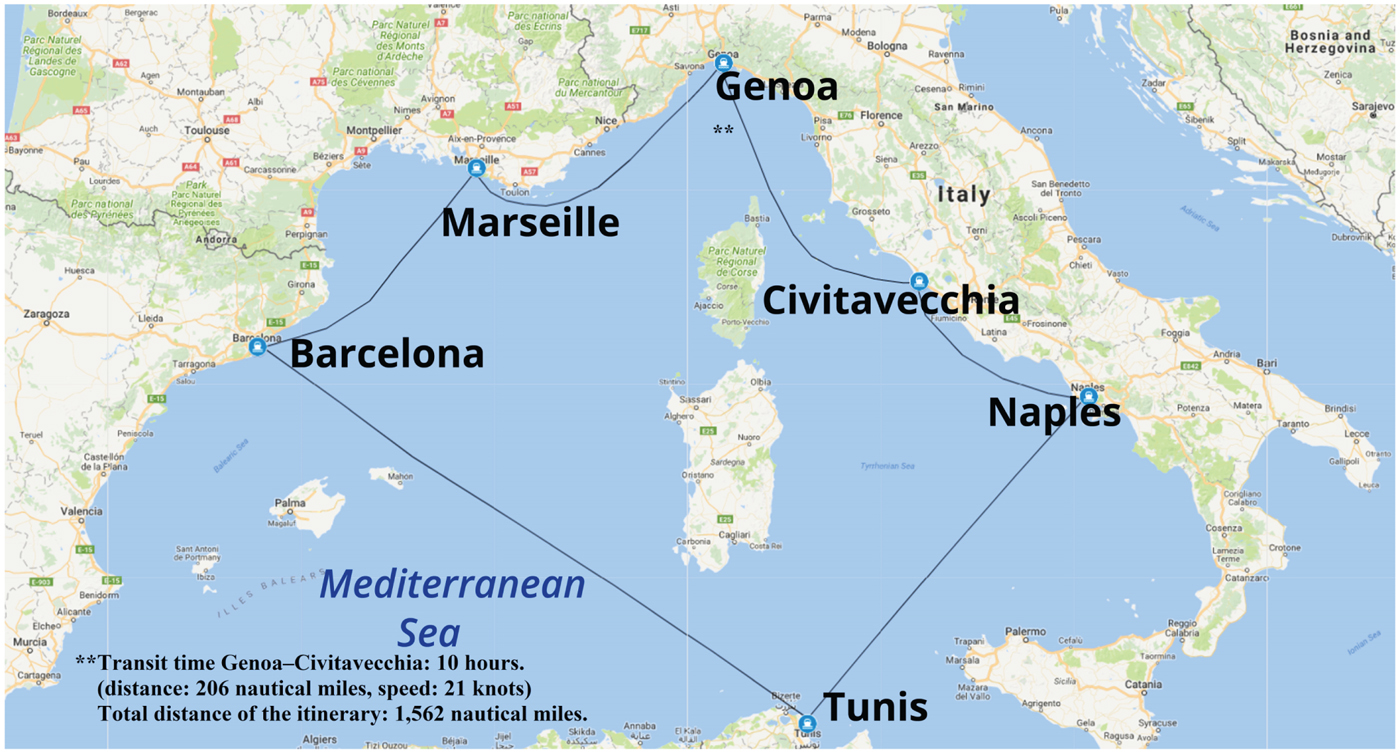
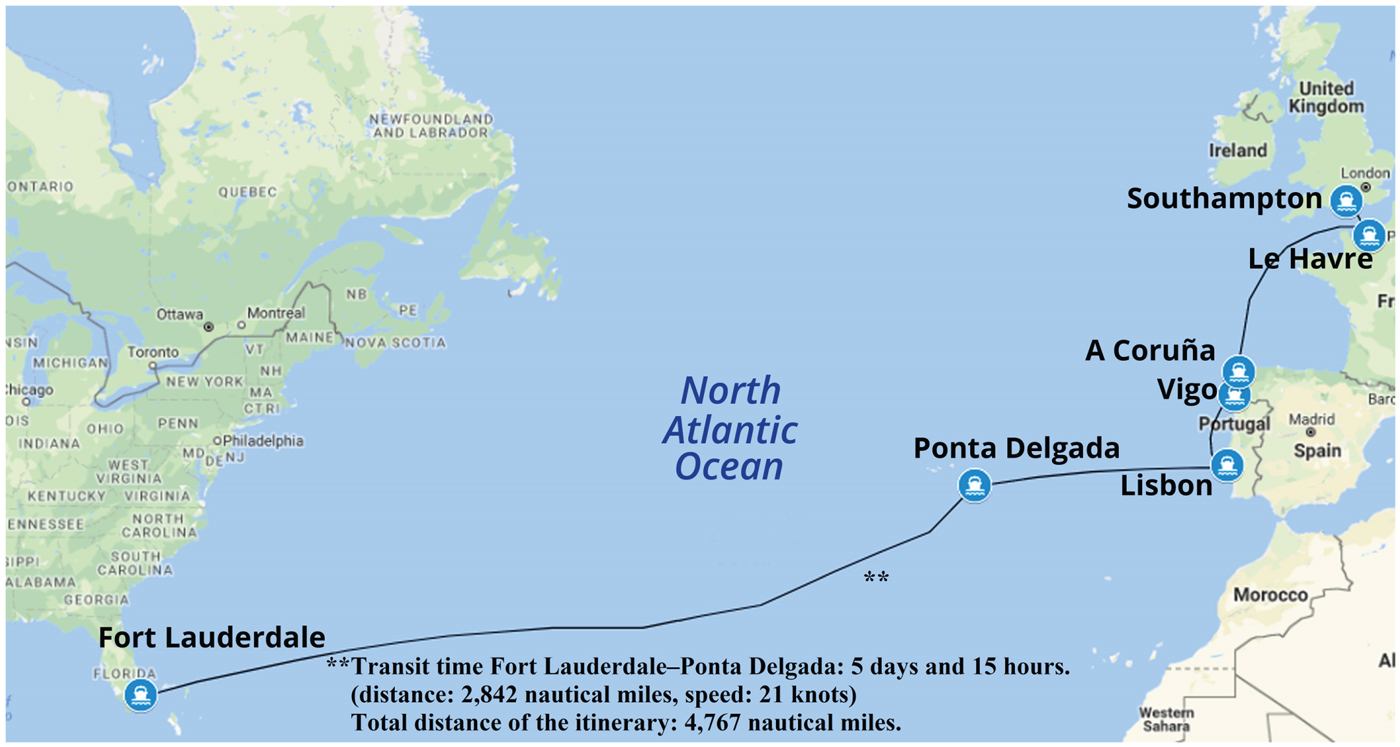
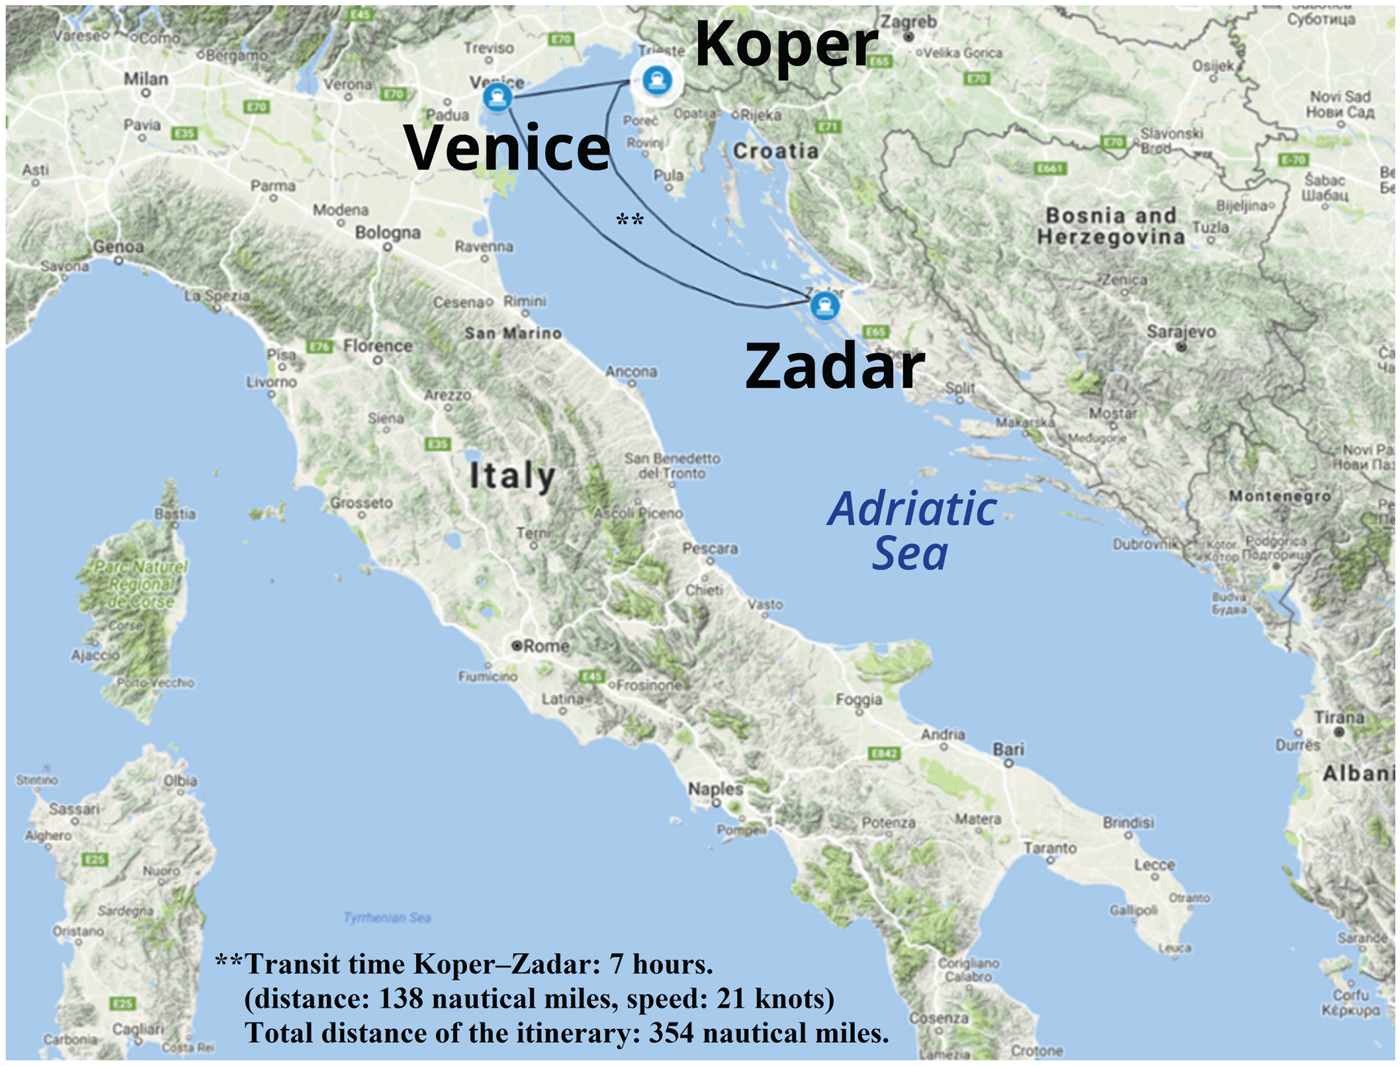
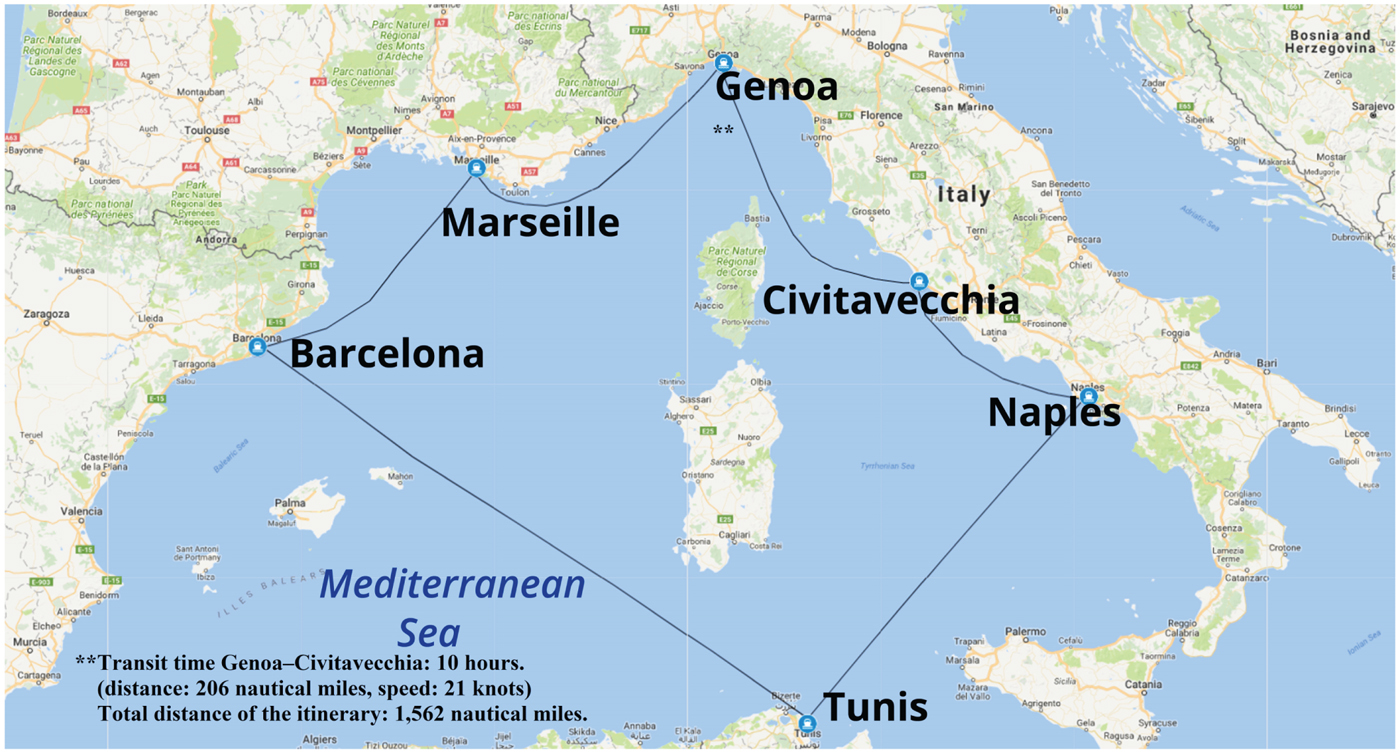
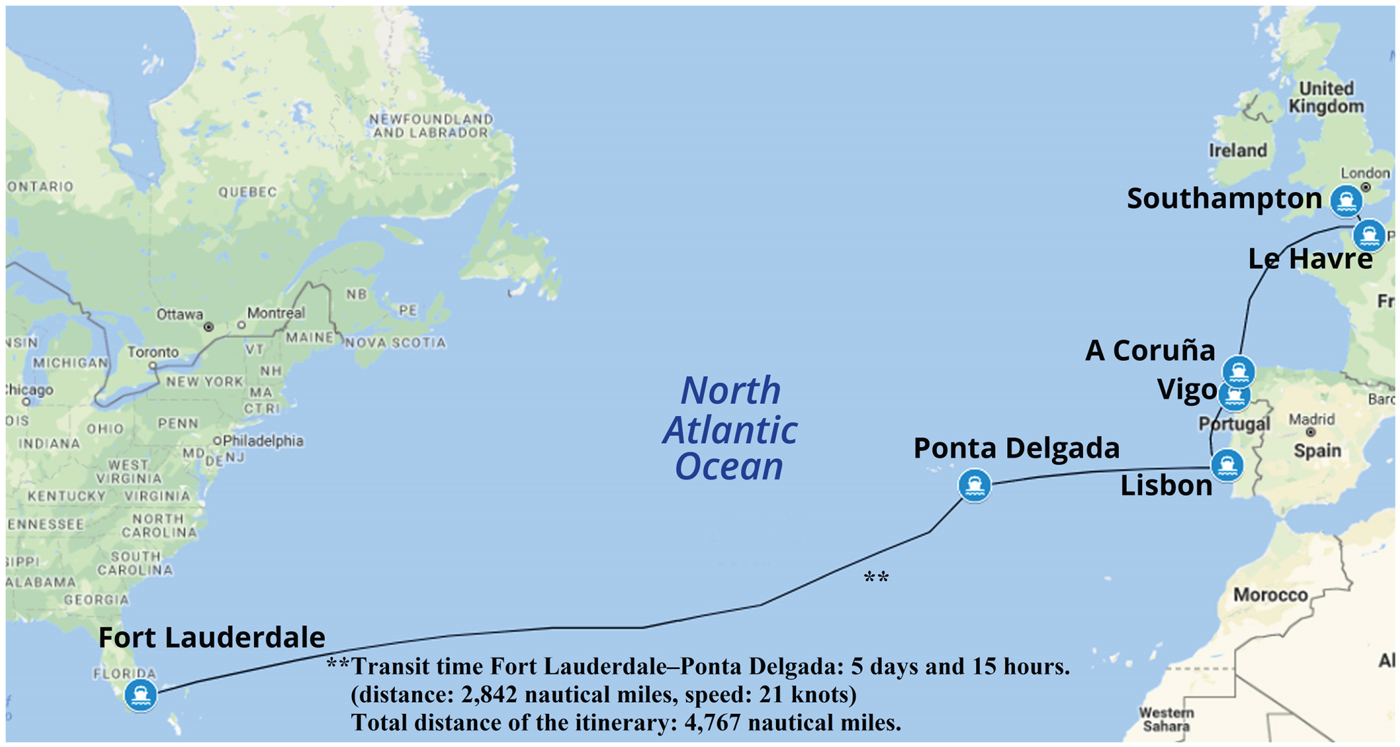
Gramolini et al. (Reference Gramolini, Grati, Fabi and Schulze2013) proposed a spatial scale of the use of the sea structured at three levels: small, medium, and large. Cruise traffic mainly uses the sea on a medium and large scale. The small scale comprises itineraries with a duration of three to four days travelling approximately 800 nautical miles (see Figure 2). The medium scale, which is the most demanded, is associated with sailings to develop itineraries that typically last five to ten days (see Figure 3). For instance, a medium scale itinerary can be associated with an itinerary that travels along a loop of 1,700–1,800 nautical miles and takes eight days to complete the trip. The large scale develops itineraries of more than ten days, which are mainly represented by repositioning and round-the-world itineraries (see Figure 4). The goal of repositioning cruises is to move the vessel from a destination region in which the peak season has ended to another in which the peak season is about to begin. These migrations between destination regions are performed to position the vessel in regions where the vessel occupancy ratio and revenue per passenger in each itinerary are maximised. However, the repositioning of ships is not an easy decision to make since a repositioning decision is subject to a comparison between the opportunity cost of laying up the vessels to the potential operating profit after taking into account the cost of repositioning (Wang et al., Reference Wang, Pallis and Notteboom2015). The interregional repositioning of cruises may give rise to transoceanic sailings. For example, a repositioning route between the east coast of the United States of America (USA) and Northern Europe that calls at the ports of Fort Lauderdale–Ponta Delgada (Azores)–Lisbon–Vigo–A Coruña–Le Havre–Southampton travels 4,767 nautical miles and takes 15 days.
Example of a small-scale itinerary. Source: Authors using Google (2018).
Example of a medium-scale itinerary. Source: Authors using Google (2018).
Example of a large-scale itinerary. Source: Authors using Google (2018).
According to Hall (Reference Hall1999) and Kwan and Weber (Reference Kwan and Weber2008), in relation to the supply side of tourism transport, perhaps four general spatially expressed roles can be identified: (a) linking the source market to the host destination; (b) providing mobility and access within a destination area/region/country; (c) providing mobility and access within an actual tourism attraction; and (d) facilitating travel along a recreational route, which is itself a tourism experience. The transport component of a cruise itinerary mainly adopts the fourth role. However, some itineraries also adopt the first role because some itineraries start in the homeport of the cruise passenger source market, but the target cruise region is situated far from the homeport. Then, the linkage of the source market and the host cruise destination is made by the cruise vessel itself. Examples of that are an itinerary that has Southampton (United Kingdom (UK)) as a homeport but whose target region for the itinerary is the Western Mediterranean Sea, or an itinerary through the islands of the Eastern Caribbean Sea using Fort Lauderdale (USA) as a homeport. In other cases, the connection between the source market and the host cruise destination is made by air transport, resulting in fly and cruise itineraries.
2.2. Requirements to design cruise itineraries
In designing small and medium itineraries, first, the cruise line chooses a vessel with specific facilities that will execute the itinerary, after which the destination region is selected. The next step involves selecting the homeport from which the itinerary will be developed. Homeports should be strategically located in a geographic area in which attractive inland destinations and port cities are abundant and are in close proximity to ensure that cruise lines can offer competitive and flexible itineraries (Bagis and Dooms, Reference Bagis and Dooms2014). Moreover, homeports should be well connected to source markets; for instance, ‘close to home’ ports (also called ‘drive to ports’) increase the likelihood of cruising (Rodrigue et al., Reference Rodrigue, Comtois and Slack2017). ‘Must see’ ports and other ports of call are necessary for the itinerary. ‘Must see’ ports are world-famous destinations that are necessary for all itineraries because they attract passengers and form the most compelling feature of the cruise itinerary (Pallis, Reference Pallis2015). Finally, other ports of call are then needed to complete the itinerary. The optimal sequence of visiting the ports of call is mainly determined by geographical distance (Wang et al., Reference Wang, Wang, Zhen and Qu2016). This geographical dependence results in a negative spatial relation for a range of short distances between ports, which becomes positive at intermediate distances and becomes negative again for large distances (Esteve-Perez and Garcia-Sanchez, Reference Esteve-Perez and Garcia-Sanchez2017a). To determine the optimal distance between two ports of call, the speed of the vessel and its associated fuel consumption must be kept in mind because fuel costs are extremely important for the vessel's profit account. Therefore, a cruise port needs to be located close to or within an area where cruise ships operate (McCalla, Reference McCalla1998).
According to Rodrigue and Notteboom (Reference Rodrigue and Notteboom2013), vessel deployment strategies and itinerary design are affected by two key factors: market circumstances and requirements and pure operational considerations. In the former, concepts include the seasonality in demand, the optimal duration of a cruise vacation, the balance between sailing time and shore time, the existence of ‘must see’ destinations and overall guest satisfaction. In the latter, the berthing capacity of and nautical accessibility of ports, the distance between ports of call and the synchronisation with air transfers are considered.
Marti (Reference Marti1990) stressed that the geographic concepts of ‘site’ and ‘situation’ contribute to a greater understanding of the ports selection process. ‘Site’ refers to a physical factor, whereas ‘situation’ is a notion that can include either physical or cultural qualities. Following McCalla (Reference McCalla1998), the degree of attractiveness is related to the situation of the port. The situation can be broken into two elements: the situation relative to the market of potential cruise passengers and the situation relative to the destinations to which cruise travellers wish to go. Additionally, ‘situation’ refers to the local and regional land-based attractions because shore excursions are an integral part of the cruise vacation.
The demand for a cruise product is complex because itineraries of varied lengths and several ports of call, different cabin categories, various on board amenities and activities, and many spending opportunities on the vessels and on the excursion are available (Kwortnik, Reference Kwortnik2006). The important consumer behaviours appear to be at the time of booking a cruise in concepts such as trip duration, travel distance to the homeport, price paid for the cruise fare, cabin-type selection and price paid for each cabin type (Sun et al., Reference Sun, Kwortnik and Gauri2018).
The itinerary has to be seen as a whole since the product sold is the set of destinations that form the itinerary. Thus, the itinerary has to meet a series of requirements associated: (1) the type of ports composing the itinerary must combine ‘must see’ ports with other types of ports, such as ‘discovery’ ports; (2) the experiences offered at each port and, therefore, the overall satisfaction of the passenger with the itinerary; and (3) the distances between ports since there must be a balance between sailing time and the duration that the ship remains in port. Hence, cruise ports and cruise lines need each other to create itineraries with a heterogeneity of ports and experiences. Seasonality is an important factor because in certain regions, itineraries can be offered only during some months due to weather conditions. In addition, each cruise destination region offers different tourism experiences. For instance, the Caribbean is associated with a belt of islands that offers a wide variety of landscapes and cultures. The Mediterranean is associated with culture and traditional attractions, and monuments are the main tourist attractions in Italy, Spain and Greece. In the Eastern Mediterranean, the Greek islands constitute one of the main attractions. The Baltic Sea is associated with historical cities with a well-known cruise route that travels along the capitals of the Baltic Sea: Copenhagen, Helsinki, Riga, Saint Petersburg, Stockholm and Tallinn.
Therefore, cruise lines, ports and destination regions are impacted by seasonality. For cruise lines, seasonality means that they have to reposition their vessels during a period of the year to another destination with greater demand in order to maximise the vessel's occupancy. For homeports and ports of call, seasonality means that revenues associated with the cruise ship activity on their docks are reduced, or even disappear, during the low season. This is a key issue as the required investment in infrastructure for cruise ships is huge and, in most cases, it has exclusive use for cruise traffic. Finally, for destinations, the seasonality creates a fluctuation in the income from cruise passengers, crew members, and services required by the ship during its call.
3. DATA AND METHODOLOGY
In this section, the data and methodology to perform the analysis is presented. Through this analysis it will be determined whether the seasonality patterns are associated with destination regions more than with ports in isolation, and the seasonality patterns present in the analysed region. First, the features of the port sample are presented. Second, the technique to determine the seasonality pattern of each port and classify them by groups with homogeneous seasonality patterns is presented. Specifically, seasonality pattern refers to the changes in a time series of cruise passenger movements representing intra-year fluctuations that are stable year after year, identifying, therefore, the periods of peak and low season. Ports with homogeneous seasonality patterns refer to ports that have similar seasonality patterns.
3.1. Data
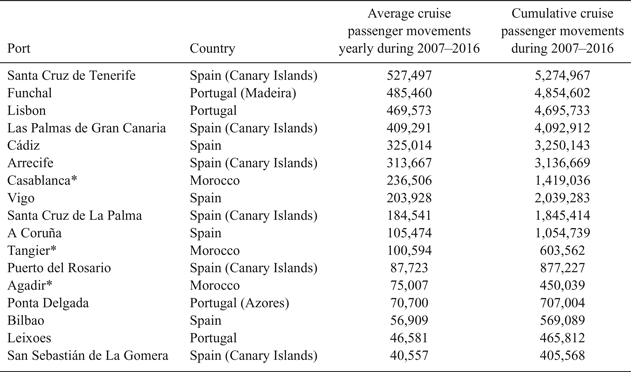
The analysis was performed using a sample of 17 ports located on the archipelagos of the Azores, the Canary Islands and Madeira and on the Atlantic coast of Morocco, Portugal and Spain. The ports of the sample were selected with the criteria that they had registered an average of more than 35,000 cruise passengers per year during the period from 2007 to 2016, and, therefore, that they had registered more than 350,000 cruise passengers cumulatively during the same period; see Table 1. Ports with less than 35,000 cruise passenger movements per year were excluded from the analysis because cruise traffic is not consolidated in these ports. In addition, they have high fluctuations in cruise passenger movements from one year to another. Excluding these ports does not modify the results because of the low amount of cruise traffic that they register. For instance, Horta (Portugal) and Gijón (Spain) registered 8,568 and 11,616 average cruise passenger movements per year during the period from 2007 to 2016, respectively. Moreover, some excluded ports did not register cruise traffic for several years of the period 2007–2016.
Average yearly and cumulative cruise passenger movements of the ports of the sample during the period 2007–2016.

* Note: For Agadir, Casablanca and Tangier only the figures for the period 2010–2016 were available.
Source: Authors using statistics of Port Authorities.
This paper proposes a ‘dynamic’ classification of ports by size, structured in three sizes. In the literature, it is possible to find different classifications of the size of ports by referencing the number of cruise passengers; however, they are ‘static’ classifications. Examples of these classifications can be found in MedCruise (2008; 2017), Pallis (Reference Pallis2015), and Rodrigue et al. (Reference Rodrigue, Comtois and Slack2017). A ‘static’ classification does not capture the effects of the evolution of the cruise industry at the global level and therefore may become obsolete in a short period of time. A ‘dynamic’ classification has the advantage of capturing how the ports have followed changes in the cruise industry.
The proposed size classification, in addition to being ‘dynamic’, aims to be applicable to any cruise region in the world in order to compare the port sizes of different regions. Following the ‘static’ classifications included in the literature, the proposed classification is as follows: ‘small’, ‘medium’, and ‘major’. This ‘dynamic’ classification was defined by indexing them to the worldwide number of cruise passengers corresponding to each year. Then, the sizes are as follows: ‘small’ (less than 1% of the worldwide cruise passengers/year), ‘medium’ (between 1% and 5% of the worldwide cruise passengers/year), and ‘major’ (more than 5% of the worldwide cruise passengers/year).
3.2. Methodology
The variable used to perform the seasonality analysis was the total number of cruise passenger movements. This variable was selected because it has the highest precision in measuring the cruise traffic registered in each port. The first step in the analysis was to determine the cruise traffic seasonality pattern of each port in the sample. This seasonality analysis was conducted using a time series composed of 120 observations corresponding to each port's monthly registers for the period from 2007 to 2016 (Agence Nationale des Ports, 2017; Portos dos Açores, 2017; Porto de Leixoes, 2017; Porto de Lisboa, 2017; Portos da Madeira, 2017; Puertos del Estado, 2017). It should be noted that for the ports of Agadir, Casablanca, Leixoes and Tangier, the seasonality pattern was calculated using a time series of 72 observations from 2011 to 2016 because of the availability of cruise passenger statistics. For each port, the time series follows a multiplicative model. In this type of time series, the seasonal component is measured by an index called the Seasonal Variation Index (SVI). This index, which is expressed as a percentage, represents the value fluctuation of the series with respect to the value of the annual average trend (Rey-Graña and Ramil-Díaz, Reference Rey-Graña and Ramil-Díaz2007).
A cluster analysis was conducted to classify the ports of the sample in clusters with homogenous cruise seasonal patterns. Cluster analyses are widely used in the field of transportation research, for example, one can find the works of Chin-Shan et al. (Reference Chin-Shan, Kee-Hung and Cheng2005), De Oña et al. (Reference De Oña, de Oña and López2016), Ducret et al. (Reference Ducret, Lemarié and Roset2016), and Pritchard et al. (Reference Pritchard, Moura, de Abreu e Silva and Martinez2014).
Cluster analysis is a method for partitioning a set of observations into groups to maximise both the homogeneity and heterogeneity among the clusters. Cluster analysis techniques can be classified as hierarchical or partitioning. One of the attractive features of hierarchical techniques is that they do not assume any particular number of clusters that are fixed a priori. Starting with n classes representing n statistical units, hierarchical clustering produces a single class that contains all n units. A commonly used approach in hierarchical clustering is Ward's method. Ward's cluster method minimises the within-cluster sum of squares over all partitions at each stage of the clustering procedure (Hair et al., Reference Hair, Anderson, Tatham and Black1998). Since the cruise port network has a clear hierarchical structure based on the necessary mix of types of ports in an itinerary, Ward's method appears appropriate to agglomerate the ports into homogeneous clusters according to cruise traffic seasonal patterns.
4. RESULTS AND DISCUSSION
This section is devoted to the results obtained from applying the proposed ‘dynamic’ classification to the sample of 17 ports, the analysis to determine the seasonality pattern for each port, and the cluster analysis. Next, it includes a discussion of the results regarding the relationship between the seasonality patterns obtained and the interdependence of the set of ports of the quadrant analysed with other cruise destination regions.
4.1. Results
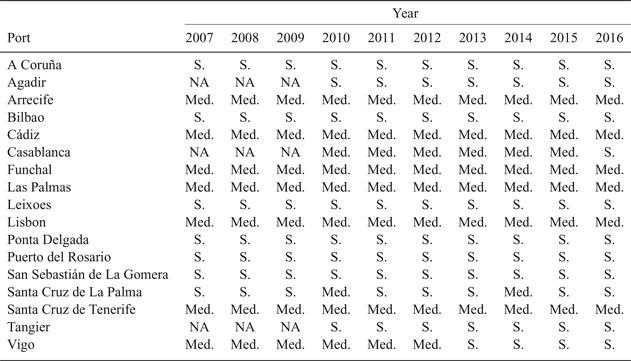
In Table 2, the results of applying the proposed classification, (‘small’, ‘medium’ and ‘major’) presented in Section 3.1, to the sample of 17 ports during the period from 2007 to 2016 are summarised. The ports of Las Palmas de Gran Canaria, Arrecife and Puerto del Rosario are managed by the same port authority, the Las Palmas Port Authority. In addition, the Port Authority of Santa Cruz de Tenerife manages the ports of Santa Cruz de Tenerife, Santa Cruz de La Palma and San Sebastián de La Gomera. The sample is composed of ‘small’ and ‘medium’ ports; no port is considered ‘major’. The main behaviour pattern is that the ports have maintained the same size throughout the analysis period, which indicates that they have adapted and evolved in the same way as the global cruise industry.
Classification of the ports in the sample according to the proposed sizes.

Note: S.: Small; Med.: Medium; Maj.: Major; NA: Not available.
The absence of ‘major’ ports is because this sector is mainly used as an intermediate call in repositioning itineraries between the two most important cruise destinations in the world. Therefore, the main function of the ports in this sector is to balance the sailing time and shore time in repositionings between the two Atlantic shores.
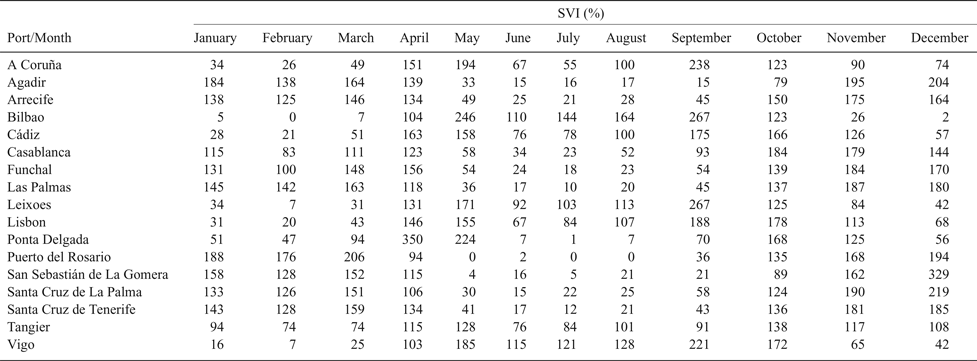
Table 3 shows the values of the monthly SVI obtained for each port during the period analysed. A month with an SVI value higher than 100% indicates that the cruise passenger movements of that month are above the annual arithmetic average. A month with an SVI value lower than 100% indicates that the cruise passenger movements of that month are below the annual arithmetic average. All the ports in the sample exhibited seasonal variations in cruise traffic. Some ports have no cruise activity in certain months, such as Bilbao (February) and Puerto del Rosario (July and August). Furthermore, there are remarkable differences between peak-season months and low-season months for each port. For instance, the cruise activity in the port of Ponta Delgada multiplied by a factor of 250 between the least active month (July) and the busiest month (April). In the case of the port of Las Palmas, the cruise activity in November (the busiest month) was 19 times higher than in July (the least active month). Through the results shown in Table 3, peak-season months and low-season months for each port were obtained. Using the SVI as an input variable, the next step was to conduct a cluster analysis of the 17 ports to identify groups of ports with homogeneous seasonality patterns.
Monthly seasonal variation index of cruise passenger movements registered in each port of the sample during the period analysed.
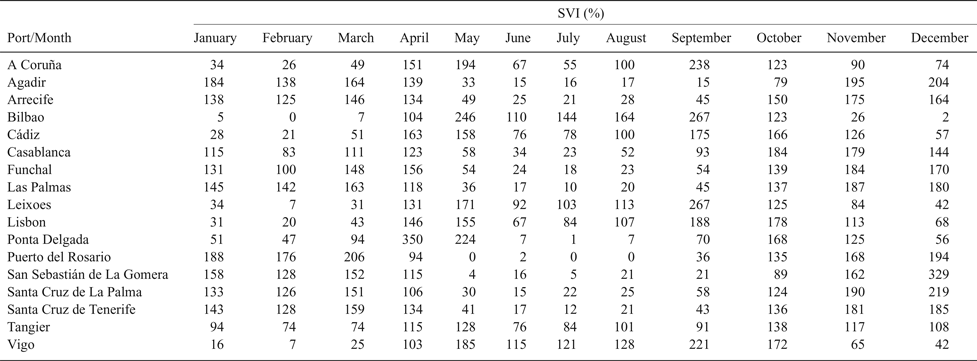
SVI = 100% is equal to the value of the annual average.
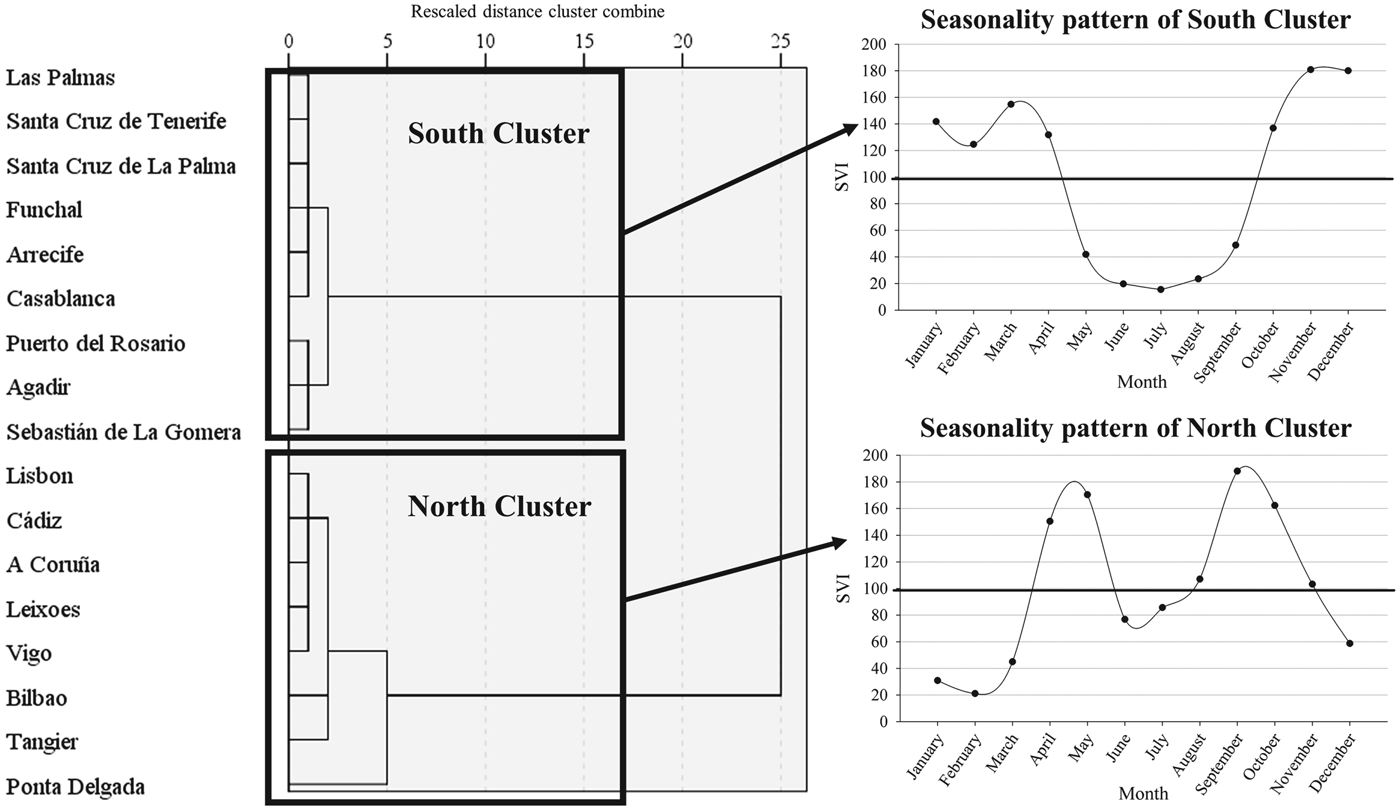
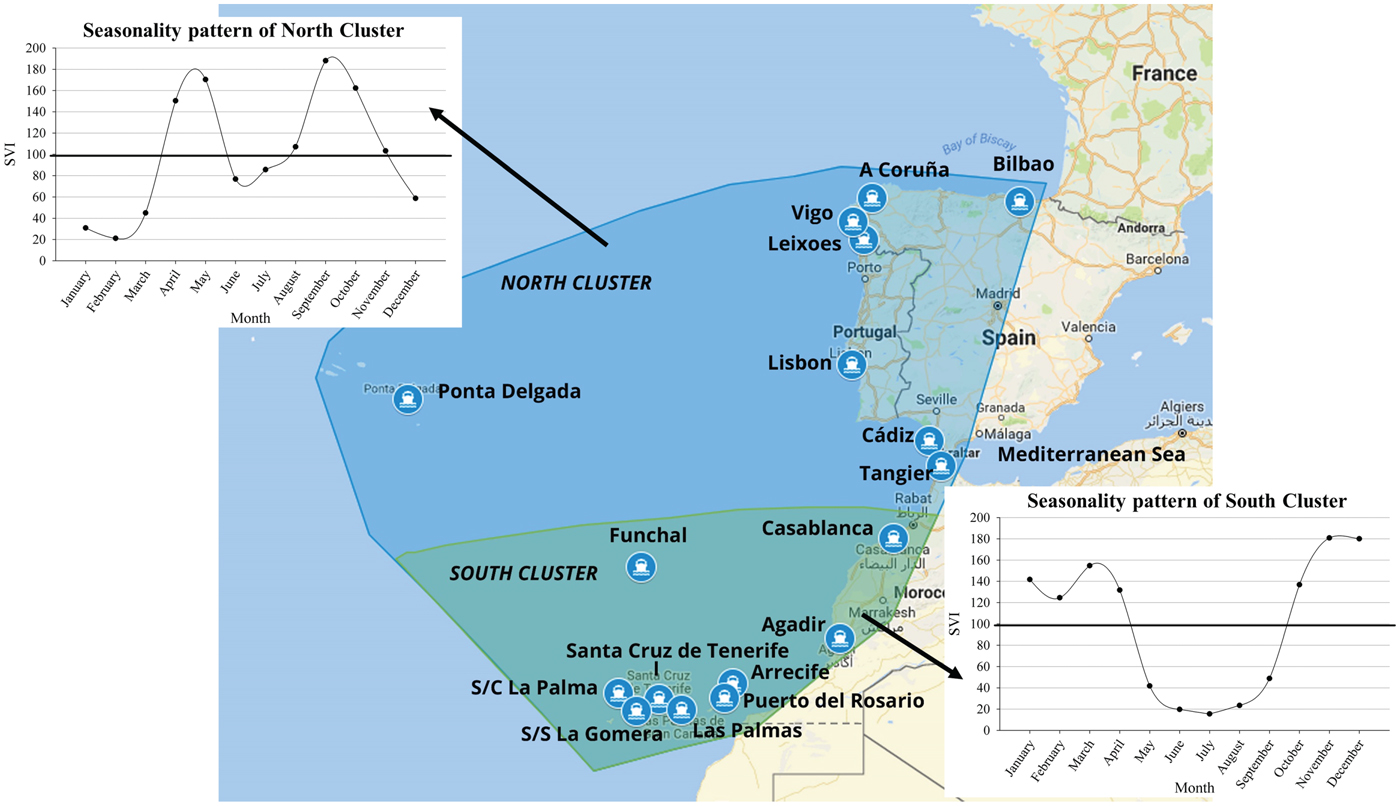
The structure of the dendrogram (a diagram that shows the hierarchical relationship between objects in cluster analysis) (see Figure 5) generated by clustering suggested dividing the ports into two homogeneous classes. The dendrogram also represents the distance between the joined elements. However, the distances are not represented in the original scale but on a standardised scale of 25 points.
Dendrogram with clusters obtained and associated seasonality patterns of each cluster.

South Cluster. Includes nine ports: Agadir, Arrecife, Casablanca, Funchal, Las Palmas, Puerto del Rosario, San Sebastián de La Gomera, Santa Cruz de La Palma and Santa Cruz de Tenerife. The ports of this cluster are characterised by a seasonal pattern with only one peak season during the year (see Figure 5). Depending on the port, the peak season begins in October or November and ends in March and, mainly, April; see Table 3.
North Cluster. Includes eight ports: A Coruña, Bilbao, Cádiz, Leixoes, Lisbon, Ponta Delgada, Tangier and Vigo. The ports of this cluster are characterised by a seasonal pattern with two peak seasons during the year (see Figure 5). The first peak season includes April and May. The second peak season runs from August to November, although it should be noted that depending on the port, there are some changes in the months that compose the peak season; see Table 3.
4.2. Discussion of the results
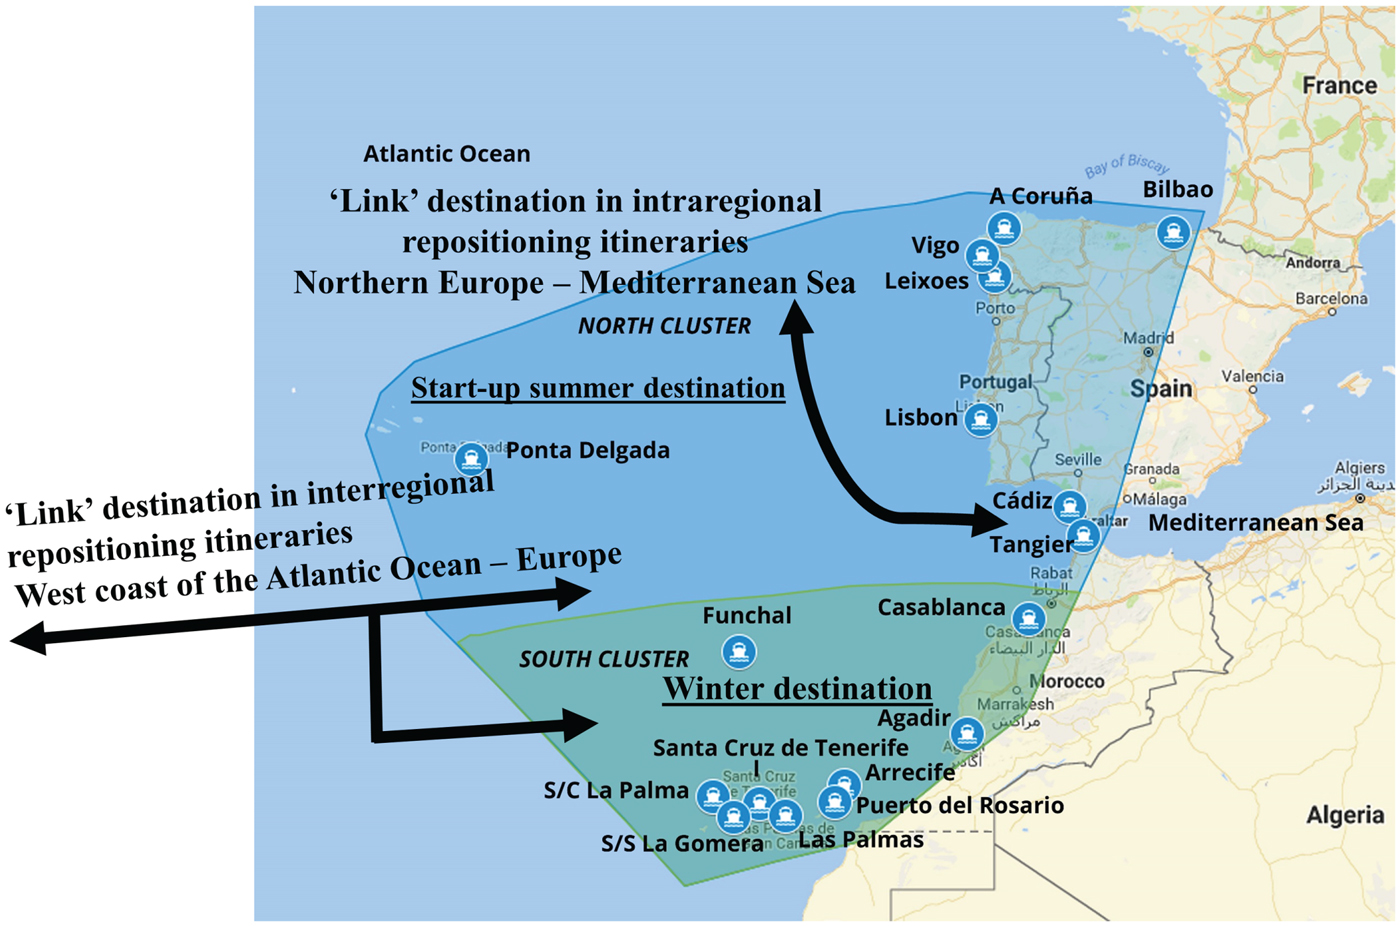
The results obtained show that seasonality patterns are associated with regions and not with ports in isolation. In fact, this study detected two port clusters with homogeneous seasonality patterns. The ports of the South Cluster are situated in the southern half of the northeast quadrant of the Atlantic Ocean; see Figure 6. This cluster exhibits a seasonal pattern with only one peak season from October through April of the following year, whereas the ports of the North Cluster are located in the northern half (see Figure 6) and has two peak seasons: one from April through May and another from August through November.
Geographical position of each cluster inside the analysed area and associated seasonality patterns for each. Source: Authors, partially using Google (2018).

In the geographic area of the South Cluster, the deployed capacity remains constant or even increases from the beginning of the peak season in October until the end in April of the following year, which leads to a peak season of seven months. Cruise lines use that area as an intermediate call in repositioning itineraries between the Caribbean Sea and the Mediterranean Sea. Vessels call in March and April when they sail to the Mediterranean at the beginning of the peak season and in October and November when they return mainly to the Caribbean at the beginning of the peak season there. Moreover, it should be noted that the Mediterranean Sea has its peak season from May to October (Esteve-Perez and Garcia-Sanchez, Reference Esteve-Perez and Garcia-Sanchez2017b). Furthermore, cruise lines also deploy vessels in the South Cluster to develop regular winter itineraries between October and April of the following year.
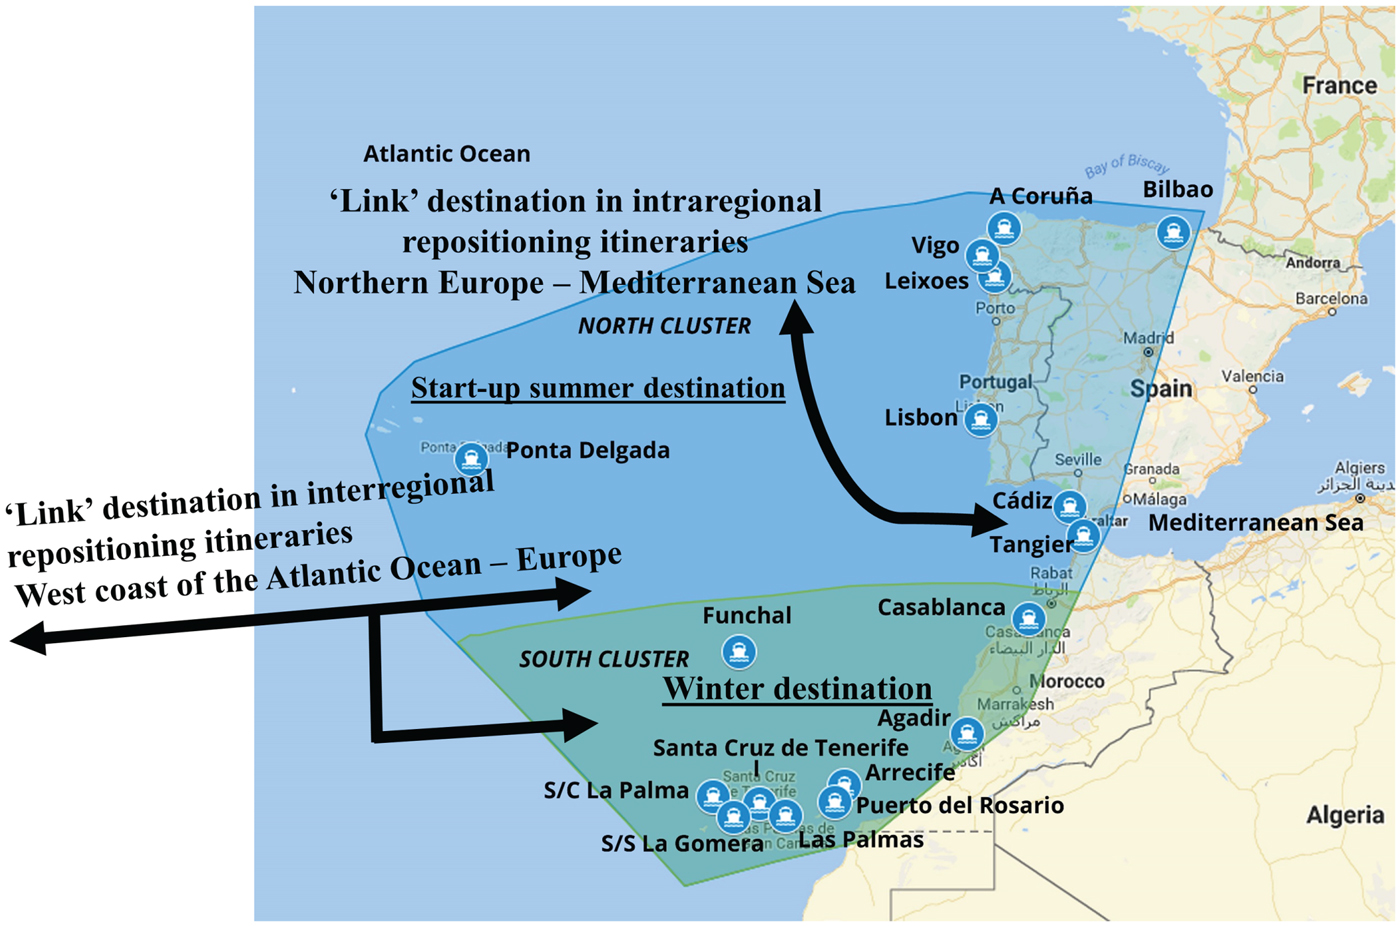
The deployed capacity in the North Cluster follows a different pattern. Vessels are positioned on the Atlantic coast of Portugal and Spain and in the area of the Strait of Gibraltar in April and May, mainly from the Caribbean Sea — that is, an interregional reposition. In May, part of the deployed capacity is repositioned to the North Sea and Baltic Sea since the season starts there; an intraregional reposition. Vessels remain in that destination until the end of the season in September. Then, vessels sail again to the surroundings of the Strait of Gibraltar and the Atlantic coast of Spain and Portugal to stay until November, at which time they sail to winter destinations on the west coast of the Atlantic Ocean. This operational pattern, that includes two repositioning sailings, partially explains the two (separate) peak seasons obtained for the ports of the North Cluster, which lead to five peak-season months.
Additionally, in the North Cluster during June and July, some cruise activity remains that is higher than that registered during the winter months. The North Cluster is a start-up summer cruise destination, whereas in the South Cluster, cruise activity falls dramatically during the summer months because vessels are deployed in other neighbouring destinations.
The obtained clusters appear to be associated with a strong transport-cost component to optimise the deployment of vessels throughout the year. In the transport of cruise passengers, the role and relevance of geography has also been noted by several authors. For instance, Charlier (Reference Charlier1999) noted the seasonal complementarity between Caribbean and European destinations. Furthermore, Rodrigue and Notteboom (Reference Rodrigue and Notteboom2013) revealed that the two main cruise markets in the world, the Caribbean and European regions, are interconnected through the repositioning of vessels to cope with variations in seasonal demand.
Therefore, the seasonality patterns found are closely related to the fact that the Caribbean and European destination regions are interconnected from the point of view of transport of cruise passengers. Related to a port's geographic position, Hayuth and Fleming (Reference Hayuth and Fleming1994) explain the success of a container port in the intermediacy but not in the centrality. Intermediacy refers to an en route location — that is, the port is located relative to where containers originate and where they are destined. It is possible to apply a similar reasoning to cruise traffic, both at the destination region level and, within a cruise destination, at the cruise port level. The seasonality patterns of the North Cluster and South Cluster are conditioned by the peak season months in the Caribbean Sea, the Mediterranean Sea and Northern Europe. According to Charlier and McCalla (Reference Charlier, McCalla and Dowling2006), the seasonal factor is crucial in the transport of cruise passengers.
The seasonality patterns obtained in this work also highlight the interdependence between destination regions, which determines each destination's seasonal factor. There are three elements that determine the seasonal factor of destination regions: (1) weather constraints, (2) the demand of each destination region, and (3) the market demand to create new shore-based experiences in the itineraries. Therefore, the changes in cruise market demand and the response of cruise lines to them have important consequences for the present and future of transport of cruise passengers. The need to seek new shore-based experiences could offer new opportunities for both clusters obtained. In addition, as the seasonal patterns obtained show periods of low activity for both clusters, the question arises of how to improve the use of the ports of both clusters. The North Cluster could be reinforced as a summer destination if more cruise vessels were deployed from June to August. Therefore, the peak season could be transformed to a continuous peak season, whereas the South Cluster could consolidate its branding as a winter destination if a greater transport capacity was deployed to develop regular itineraries in the region. Additionally, the increase of the deployed capacity in other winter destinations on the west shore of the Atlantic Ocean, such as South America, could be associated with higher calls of repositioning itineraries for the South Cluster.
5. CONCLUSIONS
Cruise tourism represents one of the closest relationships between transport and tourism because, in this particular case, the accommodation facility moves from destination to destination. To continue attracting cruise passengers, mainly repeat customers, cruise lines have to diversify destinations and promote new ones. Undoubtedly this affects the configuration of itineraries. This strategy requires repositioning vessels between destination regions, which is made at the intraregional and/or interregional level.
The analysis of a region used as an intermediate call in repositioning itineraries between the two most popular cruise destinations explains the general behaviour registered, in which the size of each port is maintained through the analysis period, which highlights that these ports have evolved in the same way as the global cruise industry.
The analysis developed in this work has shown two port clusters with different seasonality patterns that are explained by the interrelation between destination regions. In addition, the clusters show that cruise seasonality patterns are associated solely with destination regions and not with ports in isolation. Each cruise destination region is not a ‘watertight compartment’. Moreover, the geographical position of each port in the northeast quadrant of the Atlantic Ocean explains its particular function in the cruise traffic. The South Cluster has a twofold function and a peak season of seven months. On the one hand, it is a winter (of the Northern Hemisphere) cruise destination. On the other hand, it is a ‘link’ destination in interregional repositioning itineraries between the Caribbean Sea and the Mediterranean Sea and vice versa. The North Cluster has a threefold function. It is a ‘link’ destination in interregional itineraries plus a ‘link’ destination in intraregional itineraries and a start-up summer cruise destination. At interregional level, it links repositioning itineraries between the west coast of the Atlantic Ocean and Europe, whereas at the intraregional level, it links repositioning itineraries but, in this case, to and from Northern Europe. Furthermore, it has a peak season of five months separated into two periods; the first season composed of two months and the second of three months. The results of the analysis yield the interconnectivity between destination regions regarding their seasonal factor (see Figure 7). For instance, the Caribbean Sea, the northeast quadrant of the Atlantic Ocean, Mediterranean Sea and Northern Europe are interconnected in the deployment of vessels throughout the year.
Conceptual representation of the functions of obtained clusters. Source: Authors, partially using Google (2018).
The seasonality pattern of cruise destinations is not only conditioned by both weather and market demand constraints, but also by seasonality patterns of other neighbouring destination regions. In addition, other factors that influence the cruise seasonal factor are the need to optimise transport costs and the emergence of new cruise traffic trends in which there are demands for new experiences on land. This article shows the complex management of cruise-passenger transport whose logistics have a global nature. Specifically, it highlights how the growth of the Baltic cruise region affects the cruise-passenger transport capacity available in neighbouring regions, and thus, how it affects the seasonal factor of those neighbouring regions.
Finally, this work shows that the seasonality patterns observed nowadays are not invariable. In fact, if the demand continues its current growth, new destination regions and tourist attractions will be necessary. Consequently, the seasonality patterns of the neighbouring regions currently visited by cruise ships will change.