Nomenclature
- AR
-
autoregressive model
- ARMA
-
autoregressive moving average
- CR
-
Croston’s method
-
 $C{V^2}$
-
squared coefficient of variation
- DIVIDE
-
diversity-based intermittent demand forecasting
- EFB
-
exclusive feature bundling
- FFORMA
-
feature-based forecast model averaging
- FIDE
-
feature-based intermittent demand forecasting
- GOSS
-
gradient-based one-side sampling
- ADI
-
averaged inter-demand interval
- LightGBM
-
light gradient-boosting machine
- MAE
-
mean absolute error
- MASE
-
mean absolute scaled error
- MSE
-
mean squared error
- NV
-
naive method
- PSO
-
particle swarm optimisation
- RAF
-
Royal Air Force
- RMSE
-
root mean squared error
- RMSSE
-
root mean scaled squared error
- SBA
-
Syntetos-Boylan approximation
- SES
-
simple exponential smoothing
- SMA
-
simple moving average
- TSB
-
Teunter-Syntetos-Babai method
- XGBoost
-
extreme gradient boosting

Greek symbol
-
$\alpha $
-
smoothing parameter used in SES and Croston-type methods
-
$\beta $
-
correction factor in SBA method
-
$\varepsilon $
-
error in autoregressive model
-
$\mu $
-
mean level of the time series or distribution
-
$\omega $
-
inertia coefficient in PSO
-
${\phi _i}$
-
autoregressive coefficient of order
$i$
in ARMA models -
${\theta _j}$
-
moving-average coefficient of order
$j$
in ARMA models -
$\sigma $
-
standard deviation


1.0 Introduction
Demand forecasting plays a central role in supporting planning and operational activities in the aeronautical sector, where spare parts management, maintenance scheduling and fleet availability depend heavily on accurate predictions of future demand. In this context, intermittent and highly variable demand patterns are common, which increase forecasting complexity and reinforce the need for robust and adaptive predictive methods [Reference Babai, Dallery, Boubaker and Kalai1].
Intermittent demand is characterised by frequent zero-demand periods and is common in practice, especially in spare-parts inventory, where it can represent a large number of items [Reference Zhang, Xia and Xie2]. Because such items often involve high purchasing and shortage costs, improving forecast accuracy can significantly enhance inventory management across multiple domains, including manufacturing, retail and aerospace. Forecasting intermittent demand is difficult because there are two sources of uncertainty: whether demand will occur and when it will occur. In the case of individual models, the preliminary work by Ref. [Reference Croston3] addressed this by independently forecasting demand sizes and the intervals between demands. Later improvements, such as the Syntetos–Boylan approximation (SBA) [Reference Boylan and Syntetos4], provided nearly unbiased estimates. These two works have become key benchmarks in the research on intermittent demand forecasting. These methods can be a valuable source of forecasts when used together with other standard statistical approaches. However, when multiple sets of forecasts are available, the literature considers it best practice to either select the most suitable individual forecast or combine them [Reference Wang and Petropoulos5].
A widely adopted strategy to improve forecast accuracy is the combination of multiple forecasting models [Reference Cao, Liu and Shen6, Reference Petropoulos and Kourentzes7]. However, the effectiveness of such combinations depends critically on the ability to assign appropriate weights to individual forecasts. When the weights reflect each model’s strengths for a given time series, the ensemble can outperform all individual methods. However, when poorly calibrated, the combination may lead to suboptimal or even degraded predictive performance. Therefore, the design of accurate and computationally feasible weight generation schemes is a key component of modern ensemble forecasting approaches.
On the other hand, recent advances in artificial intelligence have enabled the application of learning approaches in the aeronautical sector. For example, Ref. [Reference Fentaye and Kyprianidis8] proposed a new time-series-based prognostic method for gas turbines using the temporal fusion transformer, which captures both short- and long-range temporal dependencies in the data. The model was trained and tested on performance data, demonstrating forecasting capability. Recent studies, such as the one by Ref. [Reference Montero-Manso, Athanasopoulos, Hyndman and Talagala9], have demonstrated that meta-learning approaches, a typical strategy for identifying the forecasting method that delivers the smallest error among all available alternatives, particularly those based on extreme gradient boosting (XGBoost), can generate highly informative weights from time series features. Nevertheless, XGBoost-based solutions can incur high training times, which may limit their practical application in scenarios involving large datasets or frequent model updates. Moreover, despite the growing popularity of light gradient-boosting machine (LightGBM) as a fast and scalable gradient boosting framework [Reference Yang, Athanasopoulos and Hyndman10], few studies have explored its use for generating combination weights and its potential in intermittent demand forecasting.
Motivated by these gaps, this work aims to evaluate the potential of LightGBM as an efficient and accurate alternative for producing forecast combination weights. Specifically, the study seeks to determine whether LightGBM can outperform existing combination weighting approaches, such as learning-based, optimisation and simpler schemes, including the average method, in the context of aeronautical-related spare parts. Additionally, the proposed approach will be assessed using a dataset from a real-world aeronautical-related scenario, where many items exhibit intermittent patterns. For this purpose, a set of features that focuses on intermittent demand is extracted from the series. A pool of individual forecasting methods specialised in intermittent demand is fitted. Finally, many forecasting combination approaches are developed and evaluated to improve forecasting accuracy. The combination approaches encompass a diverse range of strategies, mainly focused on meta-learning strategies.
Therefore, the main contributions of this paper are threefold. First, we propose the use of LightGBM in a weighted combination framework, where it is employed as a meta-learner to generate combination weights from a diverse set of time series features. Second, we conduct a comprehensive comparison against XGBoost, particle swarm optimisation (PSO) and other combination strategies, evaluating both accuracy and run-time efficiency. Finally, we provide extensive empirical evidence demonstrating that LightGBM achieves equal or superior forecasting accuracy at lower computational cost, thereby offering a practical and scalable forecasting solution for operational environments with high data volume or real-time requirements. Therefore, the proposed approach can predict items in the aeronautical sector with good computational performance, while maintaining high levels of accuracy.
2.0 Background on forecasting and combination methods
This section presents the methodological foundations of this study. It initiates with a review of the forecasting models, including classical statistical approaches. Next, it introduces the core concepts of forecast combination, highlighting its advantages and the traditional strategies used in the literature. Subsequently, an overview of the meta-learning models used is presented. Finally, the section describes how meta-learning can be employed for weight assignment, focusing on LightGBM as the meta-learner in the proposed framework.
2.1 Forecasting methods
The application of demand forecasting methods in the aeronautical context has gained prominence due to the need for greater operational efficiency, cost optimisation and support for decision-making in highly dynamic environments. Traditional approaches remain relevant in scenarios where interpretability and stability are essential. The literature shows that approaches can achieve significant accuracy gains, especially in intermittent or highly volatile time series, which are common in the aviation context [Reference Petropoulos and Kourentzes7].
The naive method (NV) has been widely used as a forecasting benchmark approach [Reference Makridakis, Spiliotis and Assimakopoulos11]. It assumes that the best prediction is the last observed value, i.e. a forecast produced by NV is
 ${\hat y_{t + h}} = {y_t}$
, whereas
 $h$
indicates the period beyond
 $t$
for which the predictions are required,
 ${\hat y_{t + h}}$
the predicted value, and
 ${y_t}$
is the demand value in time
 $t$
. Since NV does not require parameters, it is easy to implement in many software tools, such as electronic spreadsheets, and is suitable as a baseline (i.e. benchmark for comparison); however, it does not capture the temporal structure. It can become a difficult baseline to beat in the context of intermittent demands.
In addition to the NV model, the mean and median of recent observations can be good alternatives as a baseline and pose a challenge for new approaches. Furthermore, the simple moving average (SMA) method is a smoothing technique used in time series analysis to reduce short-term fluctuations and highlight longer-term trends or cycles. It works by replacing each observation with the average of a fixed number of neighbouring observations. The method is widely used for forecasting when the underlying process shows no strong seasonality or trend:
 \begin{equation}{\hat y_{t + h}} = {1 \over k}\mathop \sum \limits_{i = t - k + 1}^t {y_i}\end{equation}
where
 ${\hat y_{t + h}}$
is the SMA estimate at time
 $t$
,
 ${y_i}$
are the past observations used to generate the forecast and
 $k$
is the window size (number of observations included). Another smoothing method included in this study is simple exponential smoothing (SES), a standard approach that applies a decreasing weight scheme over time [Reference Babai, Tsadiras and Papadopoulos12]:
 \begin{equation}{\hat y_{t + h}} = \alpha {y_t} + \left( {1 - \alpha } \right){\hat y_t}.\end{equation}
The parameter
 $\alpha $
controls the rate at which the weights decrease over time: high values of
 $\alpha $
generate greater sensitivity to recent observations, while low values produce more stable forecasts. SES is efficient for time series in which no trend or seasonality is observed.
Croston’s method [Reference Croston3] (CR) is one of the first methods proposed in the literature to explicitly estimate the size of the demand and the interval between occurrences separately as follows:
 \begin{equation}{z_t} = \alpha {y_t} + \left( {1 - \alpha } \right){z_{t - 1}},\end{equation}
 \begin{equation}{\hat p_t} = \alpha {p_t} + \left( {1 - \alpha } \right){\hat p_{t - 1}},\end{equation}
 \begin{equation}{\hat y_{t + h}} = \frac{{{z_t}}}{{{{\hat p}_t}}}.\end{equation}
The parameter
 $\alpha $
, as in SES, controls the sensitivity to new observations and demands interval occurrences: high values make the model more reactive, while low values favour stability. Furthermore,
 ${z_t}$
is the predicted level for the next demand and
 ${\hat p_t}$
is the predicted size of the interval between demands. Although suitable for intermittent demand, the method tends to overestimate demand due to a model bias. Other variants of CR use different parameters to estimate the demand value and the interval.
To address the bias identified in the CR method, the Syntetos-Boylan approximation (SBA) was proposed by Ref. [Reference Boylan and Syntetos4]. The method incorporates a correction factor to mitigate its positive bias. The final forecast is given by:
 \begin{equation}{\hat y_{t + h}} = \left( {1 - \frac{\beta }{2}} \right)\frac{{{z_t}}}{{{{\hat p}_t}}},\end{equation}
where the parameter
 $\beta $
controls the intensity of the bias correction. The procedure for updating the estimates for time and demand is executed as in the CR method. Intermittent series can benefit from SBA due to the systematic reduction of bias present in CR. Additionally, the Teunter-Syntetos-Babai (TSB) method is also inspired by Croston’s ideas; however, it uses the probability of demand occurrence rather than direct interval estimation. More details about the approach can be found in [Reference Babai, Syntetos and Teunter13]. It is a study that provides information on the sensitivity of several forecasting methods and the performance of inventory control to the smoothing constant. It should be noted that TSB can be more suitable than CR for dealing with intermittent time series that exhibit obsolescence patterns.
Another popular statistical approach is the autoregressive moving average (ARMA) model, which is a classical and widely used approach for modelling stationary time series, with successful applications across multiple domains [Reference Gonçalves, Cortez, Carvalho and Frazão14]. By combining autoregressive (AR) and moving average (MA) components, ARMA captures temporal dependencies arising from both past observations and past forecast errors. Its general formulation can be written as presented in Equation (5):
 \begin{equation}{y_t} = c + {\phi _1}{y_{t - 1}} + \cdots + {\phi _p}{y_{t - p}} + {\theta _1}{\varepsilon _{t - 1}} + \cdots + {\theta _q}{\varepsilon _{t - q}} + {\varepsilon _t},\end{equation}
where
 $p$
denote the order of the AR component (number of lagged samples),
 $q$
the MA component (number of lagged error terms),
 $\left\{ {{\phi _1}, \cdots ,{\phi _p}} \right\}$
are the coefficients of AR part,
 $\left\{ {{\theta _1}, \cdots ,{\theta _q}} \right\}$
are the coefficients of the MA part and
 $\left\{ {{\varepsilon _{t - 1}}, \cdots ,{\varepsilon _{t - q}}} \right\}$
are the errors terms of the MA part of the model. In an MA model, the value of the time series at time
 $t$
is expressed as a linear combination of the current and past forecast errors
 ${\varepsilon _t}$
. In an ARMA model, each error term
 ${\varepsilon _{t - i}}$
represents the part of the process that was not explained by the model at time
 $t - i$
. Since ARMA assumes stationarity, no differencing term is included, and the model directly relates current values to past dynamics captured through these parameters.
All the statistical methods described above are simpler to implement and require less computational effort to generate forecasts than advanced learning methods or bootstrapping approaches. Moreover, these methods can handle items that exhibit intermittent patterns, generally yielding good predictive performance. Therefore, they constitute good choices to compose a pool of candidate methods in any combination design.
2.2 Combination strategies for forecasting methods
The combination forecasting strategy uses multiple base forecasting models to generate a more robust final estimate, thereby reducing the individual limitations of each approach [Reference Petropoulos and Kourentzes7]. The fundamental principle is that different models capture distinct patterns such as trends, stationarity, autocorrelation and other structures of a time series. A combination can be achieved by aggregating the different models, allowing for the mitigation of systematic errors, reduction of the variance and increasing the stability of the forecasts generated by the process. The literature shows that combinations often outperform individual models, especially in scenarios with high uncertainty, variability or when the relative performance of the models varies over time [Reference Tsao, Yaqin, Lu, Kurniati and Pujawan15].
The average method is a classical combination method, widely used for its simplicity, low computational cost and excellent empirical performance [Reference Petropoulos and Kourentzes7]. It assumes that all forecasts contribute equally to the final result, avoiding the need to estimate additional parameters. Formally, let
 $M$
be the number of individual models,
 $m \in \left\{ {1,2, \ldots ,M} \right\}$
a model candidate generating the required forecasts and
 $\hat y_{t + h}^{\left( m \right)}$
be the forecast of the model
 $m$
for the time
 $t + h$
. The simple average combination is given by:
 \begin{equation}{\hat y_{t + h}} = {1 \over M}\mathop \sum \limits_{m = 1}^M \,\,\hat y_{t + h}^{\left( m \right)}.\end{equation}
Although simple, this method offers competitive performance and can serve as a benchmark for comparison in the forecast combination context. A similar method is the weighted average, in which each model receives a weight that reflects its relative importance, historical performance or other rationale for weighting. This approach allows for greater flexibility, as more accurate models can contribute more to the final combination. Let
 ${\bf{w}} = {[{w_1},{w_2}, \ldots ,{w_m}]^T}$
be the weights vector associated with each model, such that
 $\mathop \sum \nolimits_{i = 1}^m {w_i} = 1$
and
 ${w_i} \geq 0$
,
 $i = 1, \ldots ,m$
. The weighted average is expressed by:
 \begin{equation}{\hat y_{t + h}} = \mathop \sum \limits_{m = 1}^M {w_m} \hat y_{t + h}^{\left( m \right)}.\end{equation}
It allows incorporating prior knowledge, performance metrics or meta-learning models to estimate weights, making it a more sophisticated alternative to simple averaging, especially in contexts where models exhibit significantly different performance. Therefore, considerable effort in the literature has been devoted to assigning suitable weights to each model in the available pool. Next, a detailed description of candidate strategies for generating weights in forecasting combinations will be provided.
2.2.1 Particle swarm optimisation
PSO is a swarm-based optimisation algorithm known for its efficiency and rapid convergence. Due to its strong performance on continuous optimisation problems, it has become widely used for various applications, such as parameter tuning [Reference Wu, Zhang and Xue16]. Proposed by Ref. [Reference Kennedy and Eberhart17], PSO is an optimisation algorithm inspired by the collective behaviour of swarms, in which each potential solution is represented by a particle moving in a search space. The particles iteratively adjust their positions based on two references: the best solution already found by themselves (pbest) and the best solution found by the group (gbest). The method is simple, efficient and suitable for complex and nonlinear problems. The fundamental equations of classical PSO are presented in Equations (10)–(12). Let particle
 $i$
be defined by its position
 ${{\bf{x}}_i}$
and velocity
 ${{\bf{v}}_i}$
:
Velocity update:
 \begin{equation}{{\bf{v}}_i}( {t + 1} ) = \omega {{\bf{v}}_i}( t ) + {c_1}{r_1}\left( {{{\bf{p}}_i} - {{\bf{x}}_i}( t )} \right) + {c_2}{r_2}\left( {{\bf{g}} - {{\bf{x}}_i}( t )} \right)\!.\end{equation}
Position update:
 \begin{equation}{{\bf{x}}_i}( {t + 1} ) = {{\bf{x}}_i}( t ) + {{\bf{v}}_i}( {t + 1} ).\end{equation}
Best solution update:
 \begin{equation}{{\bf{p}}_i}\,:\! =\, {\rm{arg\,min}}\!\left\{ {\,f( {{{\bf{x}}_i}} ),\,f( {{{\bf{p}}_i}} )} \right\},{\rm{\;\;\;\;\;\;\;\;}}{\bf{g}}\,:\! =\, {\rm{arg}}\mathop {{\rm{min}}}\limits_{{{\bf{p}}_i}} f( {{{\bf{p}}_i}} ),\end{equation}
where
 $\omega $
controls how much of the previous velocity is carried into the next step,
 ${c_1}$
and
 ${c_2}$
are the social and global coefficients,
 ${r_1}$
and
 ${r_2}$
are random numbers independently sampled from the interval
 $\left[ {0,1} \right]$
and
 ${{\bf{p}}_i}$
and
 ${\bf{g}}$
are the best individual and global positions, respectively. These equations allow the algorithm to balance between the exploitation of a local and a global search space.
2.2.2 Boosting approaches
Extreme gradient boosting (XGBoost) is a learning algorithm and an optimised implementation of gradient boosting that builds an ensemble of decision trees in a sequential and highly efficient manner. The key idea is to improve the predictions of an existing model by adding new trees that focus on correcting previous errors. Each new tree is trained on the gradients (i.e. how much each prediction needs to change) computed with respect to the chosen loss function. This allows XGBoost to directly optimise the task objective (e.g. regression, classification). The main aspects of XGBoost are summarised as follows [Reference Chen and Guestrin18]:
-
• XGBoost utilises both gradients and Hessians for precise optimisation;
-
• It includes extensive regularisation, improving robustness and reducing overfitting;
-
• It employs efficient split and find strategies and sparsity-aware techniques;
-
• It supports shrinkage (learning rate multiplied by each tree’s predictions before adding them to the ensemble), column subsampling (random subset of features when building each tree), and row subsampling (random choice of a fraction of training samples for each tree) for better generalisation and overfitting mitigation; and
-
• It is highly optimised for distributed and parallel computation.
XGBoost is highly effective in many application scenarios, but its performance may be limited under specific conditions. The model can underperform when the data presents predominantly linear relationships, in which case simpler linear models are more suitable. It may also struggle with very small datasets, as tree-based methods require a sufficient number of samples to operate [Reference Zou, Jiang, Qin, Liu and Li19]. Poor hyperparameter tuning is another common source of degradation, and computational constraints or extremely complex feature interactions may favour alternative and faster models.
On the other hand, LightGBM is a gradient boosting framework designed for efficient training on large and high-dimensional datasets. Like XGBoost, it builds trees sequentially to correct residual errors, but it introduces several innovations that make it faster and more scalable. Two main techniques distinguish LightGBM from XGBoost. The first is gradient-based one-side sampling (GOSS), which prioritises samples with large gradients (those that contribute most to the loss) while randomly sampling from those with low gradients. This reduces the training set size without compromising accuracy, resulting in substantial speed improvements. The second technique is the exclusive feature bundling (EFB), which identifies mutually exclusive sparse features and combines them into compact representations. This reduces the effective number of features and improves computational efficiency, especially in high-dimensional contexts [Reference Ke, Meng, Finley, Wang, Chen, Ma, Ye and Liu20]. Together, GOSS and EFB enable LightGBM to achieve faster training, lower memory consumption and competitive predictive performance compared to XGBoost, particularly on large, sparse or high-dimensional datasets.
3.0 Methodology
This section describes a structured methodology for evaluating individual forecasting models and combination strategies using a large set of highly intermittent items. After preprocessing, nine features describing intermittency, variability and others are extracted. A two-stage procedure is described to assess performance on unseen data. Several forecasting methods are implemented across multiple parameter settings to diversify model behaviours. Forecast accuracy is evaluated using standard accuracy metrics, with computational time recorded for completeness. Combination methods include PSO and two meta-learning approaches (XGBoost and LightGBM) using a customised objective function, where the combined models are the ones from the pool of 27 individual models mentioned in Section 3.2.
3.1 Dataset and feature engineering
The experimental evaluation utilises the Royal Air Force (RAF) spare parts demand dataset, a well-established benchmark in the forecasting literature [Reference Petropoulos and Kourentzes7, Reference Kourentzes and Athanasopoulos21–Reference Teunter and Duncan23] and may be acquired by request from the authors. This dataset comprises 5,000 items spanning six years (1997–2002), with each item containing 84 months of time-ordered observations. The items represent consumable spare parts, such as valves, diodes and others, which have no associated repair activity reported. Furthermore, the dataset also includes the lead time for each item, which encompasses both production and administration lead times.
An essential characteristic of this data is the nature of the demand. The RAF time series exhibits high intermittence, characterised by items with longer times between demand occurrences, which are common in practice. Moreover, the data was pre-processed by removing the initial zero values and setting the first non-zero demand as the initial value.
From each time series in the dataset, the current study extracts and uses nine explainable time series features designed explicitly for intermittent demand forecasting, as proposed by the study of Ref. [Reference Li, Kang, Petropoulos and Li22]. These features aim to capture four primary characteristics: intermittency, volatility, regularity and obsolescence. The features are as follows:
-
•
${f_1}$
- Average inter-demand interval (ADI): it measures intermittency by calculating the average time gap between non-zero demand occurrences; -
•
${f_2}$
- Squared coefficient of variation (
$C{V^2}$
, where
$CV$
is the standard deviation divided by the mean): it measures the variability of the non-zero demand sizes; -
•
${f_3}$
- Entropy: approximate entropy was used, where small values for
${F_3}$
can suggest the time series is more forecastable; -
•
${f_4}$
- Percentage of zero values: a direct measure of intermittency, representing the proportion of time steps with zero demand; -
•
${f_5}$
- Percent beyond
$\sigma $
: it estimates the volatility by calculating the percentage of observations that fall outside one standard deviation (
$\sigma $
) from the mean (
$\mu $
); -
•
${f_6}$
- Linear chunk variance: it measures the volatility trend by computing the coefficient of a linear regression on the variances of sequential time series chunks (
$L$
) (
$L = 12$
was used in this study). In other words, it measures the linear time trend of the variances; -
•
${f_7}$
- Mean absolute change: it estimates volatility by calculating the mean absolute value of consecutive changes (first differences) in the demand; -
•
${f_8}$
- Ratio of last chunk: it measures obsolescence by calculating the ratio of the sum of squares of the last chunk of data to the sum of squares of the entire series; and -
•
${f_9}$
- Percentage of zero values at the end: a simple measure of obsolescence that computes the percentage of consecutive zero values at the very end of the time series.


One advantage of the features described above is that they are not dependent on the domain or on special calendar events. Therefore, they are general features that can be extracted from any time series. These features were built to represent each time series as a vector, which serves as the input for training the meta-learners combination approaches in the proposed framework.
3.2 Individual methods setup
The individual forecasting methods considered in this study are SES, SMA, TSB, NV, Mean, ARMA, CR and SBA. They were previously described (Subsection 2.1), where their theoretical foundations and intended roles within the evaluation framework were outlined. To ensure a more prosperous and diverse pool of forecasting behaviours, each of these methods was implemented across multiple configurations by varying their key parameters, such as the smoothing constants, window sizes, regression orders and others. These variations were not arbitrarily made, but grounded in earlier studies using the RAF data or in the required forecasting horizon as follows:
-
1. SES:
$\alpha \in \left\{ {0.01,0.05,0.15,0.25,0.30} \right\}$
[Reference Babai, Dallery, Boubaker and Kalai1, Reference Teunter and Duncan23]. -
2. SMA:
${\rm{windowsize}}($
w
$) \in \left\{ {3,6,9,12} \right\}$
to approximate a correspondence with the required forecasts horizon (
$H$
). -
3. TSB:
$p \in \left\{ {0.01,0.02,0.05,0.08,0.1} \right\}$
and
$d \in \left\{ {0.02,0.1,0.15,0.25} \right\}$
[Reference Babai, Dallery, Boubaker and Kalai1, Reference Babai, Ali and Nikolopoulos24, Reference Petropoulos, Kourentzes and Nikolopoulos25]. -
4. NV: last observed value in data, i.e.
${y_t}$
. -
5. Mean: mean values of time series.
-
6. ARMA: p = q
$,\text{and}$
p
$,$
q
$ \in \left\{ {3,6,9,12} \right\}$
to approximate a correspondence with the required forecasts horizon (
$H$
). -
7. CR:
$\alpha \in \left\{ {0.05,0.10,0.15,0.20,0.25} \right\}$
and an optimised version of the darts package (version: 0.31.0) [Reference Babai, Dallery, Boubaker and Kalai1, Reference Teunter and Duncan23–Reference Petropoulos, Kourentzes and Nikolopoulos25]. -
8. SBA: optimised version by the darts package (version: 0.31.0) [Reference Babai, Dallery, Boubaker and Kalai1].


The variation in these parameters was intentionally introduced to increase diversity among the individual forecasts, thereby enabling a more robust comparison across methods and providing a stronger basis for evaluating the performance of the proposed combination approaches. These combined parameters generated a pool of 27 individual models, whose forecasts will later be combined by our proposed meta-learning approach to generate the final estimates.
Furthermore, the parameters based on previous results are essential because they enable the current work to build on the knowledge established by earlier studies using the same dataset (RAF). This connection with prior work not only prevents the repetition of past mistakes but also enables gaining a quicker start than beginning from scratch.
3.3 Experiment design
The experiment employs a two-phase procedure for time series forecasting, involving data splitting, model training and weight optimisation, followed by final evaluation. The process is designed to select and optimise model weights using a validation interval before assessing performance on unseen test data. The entire process is illustrated in Fig. 1. The figure provides an overview of the methodology. Each box represents a group of activities performed within a specific data interval of the time series. Boxes in blue represent activities performed in the first phase, while those in green represent activities from the second phase.
The proposed methodology process.

The step-by-step procedure for evaluating our proposed approaches can be broken down as follows:
-
1. First phase: It consists mainly of training the individual methods (described in Subsection 3.2) available in the method pool and generating predictions for the validation interval.
-
(a) Training interval: This step extracts features
${f_1}$
to
${f_9}$
using the training interval. These features serve as predictors in meta-learning approaches. Then, the training interval is employed to fit individual methods to their pre-defined parameters for generating diversity. Finally, create forecasts with individual methods for the validation interval. -
(b) Validation interval: First, the forecasting error over the validation interval for each method is obtained. They will be used in the loss function (
${\bar L_n}$
) for meta-learning approaches. Then, the meta-learning approaches, which use the generated features and the loss function, are trained. Additionally, using the validation interval, the PSO method is applied to minimise the root mean scaled squared error (RMSSE) and find its optimal weights (
${\bf{w}}$
) for individual methods.
-
-
2. Second phase: It consists of the update of individual methods to incorporate more recent observations and produce more accurate forecasts. In this phase, the proposed approach is applied.
-
(a) Training + validation intervals: New features
${f_1}$
to
${f_9}$
are extracted to use as inputs by meta-learning approaches. Retrain all individual methods using the training and validation intervals, and generate their respective forecasts for the test interval. -
(b) Test interval: The features generated in the earlier step are used as inputs to the meta-learning approaches for computing the weights of each retrained individual method. Furthermore, the weights from the PSO final solution (
${\bf{g}}$
) are obtained. Then, the combination weights of the forecasts are generated for the test interval, as defined in Equation (9). Finally, the accuracy metrics are computed for evaluation purposes.
-


This two-phase forecasting evaluation framework offers several key advantages that contribute to a rigorous and reliable assessment of combination methods. First, the structured division of the time series into training, validation and test time intervals ensures a clear separation between optimisation and evaluation, preventing information leakage and yielding unbiased performance estimates. The first phase generates a diverse pool of base forecasts. It provides an independent validation interval for learning optimal combination weights, ensuring that weight estimation reflects actual out-of-sample behaviour. The subsequent retraining step enhances forecasting efficiency by enabling models to incorporate the validation interval once weight learning is complete, thereby improving their ability to capture the underlying demand dynamics. Finally, the second phase of evaluation on previously unseen test data ensures that both the individual models and the learned combination weights are assessed under realistic forecasting conditions. Overall, this methodology enhances robustness and provides a fair comparison across individual methods and combination approaches. Next, a detailed description of the baseline combination approaches and the proposed method is presented.
3.4 Forecast combination approaches
The first implemented combination method was the classical version of PSO. It was applied to find the optimal weights
 ${{\bf{w}}_{\left( i \right)}}$
for combining
 $M$
forecasting methods over the test interval. The primary purpose of PSO in the current study is to diversify the pool of combination strategies, thereby evaluating results more robust. The fitness function of the algorithm is to find the set of weights that minimises the RMSSE metric of the combined forecasts over the validation interval.
The main steps of the algorithm can be described as follows:
-
1. Initialisation: A swarm of
$D$
particles is created. For each particle
$i$
, it is assigned a random position vector
${{\bf{x}}_i}$
(representing potential weights) and an initial velocity
${{\bf{v}}_i}$
. -
2. Fitness evaluation: The fitness of each particle is calculated. This involves:
-
• creating a combination of forecasts
$\hat y_{t + h}^{{\rm{comb}}}$
using their weights of a given particle (
${{\bf{x}}_i}$
), and -
• calculating the RMSSE between the combination of forecasts
$\hat y_{t + h}^{{\rm{comb}}}$
and the actual values of validation data
$y_{t + h}^{val}$
.
-
-
3. Update best positions: Each particle updates its best weights (position) (pbest) if its current fitness is better than its previous best. The global best weights (position) (gbest) for the entire swarm is updated if any particle finds a new best-known minimum RMSSE.
-
4. Iteration and velocity update: For a set number of iterations, each particle’s velocity
${{\bf{v}}_i}$
and position
${{\bf{x}}_i}$
are updated using the standard PSO equations (refer to Subsection 2.2.1), pulling it towards its pbest and the swarm’s gbest. -
5. Termination: After the final iteration, the gbest vector is returned as the optimal set of forecast combination weights.


This PSO approach is applied to each time series in the dataset. The entire optimisation process, from swarm initialisation to final convergence, is executed separately for every single time series
 $N$
. Consequently, the resulting optimal weight vector
 ${{\bf{w}}_{\left( i \right)}}$
is unique and tailored to the specific characteristics and forecasting challenges of that series. This series-specific optimisation contrasts with global weighting approaches, allowing the combination scheme to maximise the RMSSE improvement based on the validation data of the time series being analysed. After initial testing, the main parameters of PSO were set to
 $\omega = 0.05$
,
 ${c_1} = {c_2} = 0.03$
. Additionally, due to the stochastic nature of swarm initialisation of PSO, the algorithm was executed
 $10$
times to obtain a reliable estimate of its actual performance. The reported metrics are the average across these 10 executions.
For the meta-learning approaches, the current work is based on the feature-based forecast model averaging (FFORMA) method, which was initially proposed in a prior study by Ref. [Reference Montero-Manso, Athanasopoulos, Hyndman and Talagala9] and implemented in the R programming language (this study is implemented in Python language). The objective is to use a meta-learning approach to determine a set of optimal weights for combining forecasts generated by a pool of established methods (e.g. NV, SES and ARMA).
The meta-learning approach utilises gradient tree boosting, where the objective function
 ${\bar L_n}$
was customised to optimise the RMSSE. The gradient boosting model, for a time series
 $n$
and a forecasting method
 $m$
, produces a raw score
 $p_m^{\left( n \right)}$
. This score is transformed into a combination weight
 $w_m^{\left( n \right)}$
using the softmax function [Reference Montero-Manso, Athanasopoulos, Hyndman and Talagala9]:
 \begin{equation}w_m^{\left( n \right)} = {{{\rm{exp}}\!\left( {p_m^{\left( n \right)}} \right)} \over {\mathop \sum \nolimits_{k = 1}^M {\rm{exp}}\!\left( {p_k^{\left( n \right)}} \right)}},\end{equation}
where
 $M$
is the total number of individual forecasting methods in the pool. The next step is to compute the weighted average loss function, the objective function to be minimised according to:
 \begin{equation}{\bar L_n} = \mathop \sum \limits_{m = 1}^M w_m^{\left( n \right)}{L_{nm}}.\end{equation}
where
 ${L_{nm}}$
is the loss (RMSSE) contribution of method
 $m$
for series
 $n$
. The contribution of each method that was submitted to the framework was expressed as the RMSSE values calculated over the validation interval.
Furthermore, the meta-learning approaches require the first (
 ${G_{nm}}$
) and second (
 $H{E_{nm}}$
) derivatives of the objective function with respect to the raw outputs
 $p_m^{\left( n \right)}$
. The first derivative
 ${G_{nm}}$
is the partial derivative of the loss function, and is defined as follows [Reference Montero-Manso, Athanasopoulos, Hyndman and Talagala9]:
 \begin{equation}{G_{nm}} = \frac{{\partial {{\bar L}_n}}}{{\partial p_m^{\left( n \right)}}} = w_m^{\left( n \right)}\left( {{L_{nm}} - {{\bar L}_n}} \right)\!.\end{equation}
And the second derivative (Hessian/
 $H{E_{nm}}$
) can be computed according to Ref. [Reference Montero-Manso, Athanasopoulos, Hyndman and Talagala9]:
 \begin{equation}H{E_{nm}} = \frac{{\partial {G_{nm}}}}{{\partial p_m^{\left( n \right)}}}{\rm{\;\;}} \approx {\rm{\;\;}}w_m^{\left( n \right)}\left( {{L_{mn}}\left( {1 - w_m^{\left( n \right)}} \right) - {G_{nm}}} \right)\!.\end{equation}
where
 $w_m^{\left( n \right)}$
is the weight vector associated with the features extracted from series
 $n$
. These terms,
 ${G_{nm}}$
and
 $H{E_{nm}}$
, are passed to the gradient meta-learning approaches to efficiently minimise
 ${\bar L_n}$
. It should be noted that the procedure described above was applied to our Python approximation of feature-based intermittent demand forecasting (FIDE): XGBoost (FIDE-based). The XGBoost (FIDE-based) was implemented here to facilitate comparisons, given the computational time required, which cannot be directly obtained from the study by [Reference Li, Kang, Petropoulos and Li22]. It should be noted that the approach described above does not require targets, as in usual supervised learning. Instead, the problem is framed as learning a function that allocates weights to the forecasting methods to minimise the expected loss that would arise if a method were randomly chosen, with these weights as selection probabilities [Reference Montero-Manso, Athanasopoulos, Hyndman and Talagala9].
At this point, it is worth reinforcing that the same procedure can be applied to LightGBM (due to its similar structure to XGBoost) [Reference Ke, Meng, Finley, Wang, Chen, Ma, Ye and Liu20], allowing for the advantage of its low computational resource requirements and quick adjustability. In this way, we can evaluate the method’s ability to predict the same series (more quickly than baselines) without deterioration in predictive performance, using the same objective function as XGBoost (FIDE-based). The proposed LightGBM (using the objective function detailed above), together with the set of individual models described in Subsection 3.2, will be referred to as LightGBM Comb, i.e. the meta-learning method proposed for evaluation.
Additionally, this study also considers the proposals by Ref. [Reference Li, Kang, Petropoulos and Li22] in the evaluation, whose methods were based on the default implementation of FFORMA (R version) and evaluated using RAF data. These methods, as described by Ref. [Reference Li, Kang, Petropoulos and Li22], are referred to as FIDE and the diversity-based intermittent demand forecasting (DIVIDE).
Finally, the RMSSE was used as a loss function for all combination approaches to ensure comparability. RMSSE is also a scale-independent metric that uses the ratio of the mean squared error (MSE) of the forecast to the MSE of the NV benchmark. It heavily penalises large errors as follows:
 \begin{equation}{\rm{RMSSE}} = \sqrt {{{{1 \over H}\mathop \sum \nolimits_{t = 1}^H {{({y_{t + h}} - {{\hat y}_{t + h}})}^2}} \over {{1 \over {T - 1}}\mathop \sum \nolimits_{t = 2}^T {{({y_t} - {y_{t - 1}})}^2}}}} \end{equation}
where
 $T$
is the length of the training sample (i.e. the number of historical observations), the numerator is the MSE of the forecast and the denominator is the scaling factor based on the MSE of the NV on the training set.
In this study, the PSO, XGBoost (FIDE-based) and LightGBM Comb methods were executed/run 10 times, and the final reported results correspond to the average performance across all runs. This procedure is critical because the three techniques include stochastic components that can lead to variability across executions. PSO relies on random initialisation of particles and probabilistic movement rules; XGBoost incorporates randomness through subsampling of rows and features; and LightGBM uses similar sampling-based strategies (e.g. GOSS and feature bundling), all of which introduce variation into the outcomes.
3.5 Evaluation metrics
To evaluate forecasting accuracy, it is essential to use multiple error metrics, as no single metric provides a comprehensive view of the model’s performance. By examining a diverse set of metrics, analysts gain a more robust and nuanced understanding of a method’s strengths and weaknesses, ensuring that the chosen forecasting model is appropriate for the specific goals and characteristics of the demand data. A metric such as the root mean squared error (RMSE) penalises large errors more severely and highlights poor performance on outliers [Reference Kourentzes26]. In contrast, scale-independent metrics such as mean absolute scaled error (MASE) and RMSSE allow for fair comparison across time series with vastly different units or scales.
In this paper, the first metric used is the RMSE. It measures the average magnitude of the errors, giving more weight to larger errors due to the squaring of terms. The result is in the same units as the time series:
 \begin{equation}{\rm{RMSE}} = \sqrt {{1 \over H}\mathop \sum \limits_{t = 1}^H {{({y_t} - {{\hat y}_t})}^2}}, \end{equation}
where
 $H$
is the number of forecasts,
 ${y_t}$
is the actual value at time
 $t$
and
 ${\hat y_t}$
is the forecast value at time
 $t$
.
Another error metric selected for performance evaluation was MASE. It is a scale-independent metric that compares the mean absolute error (MAE) of the forecast to the MAE of a simple NV benchmark in the training set. A value less than 1 indicates a superior prediction ability:
 \begin{equation}{\rm{MASE}} = {{{1 \over H}\mathop \sum \nolimits_{h = 1}^H \left| {{y_{t + h}} - {{\hat y}_{t + h}}} \right|} \over {{1 \over {T - 1}}\mathop \sum \nolimits_{t = 2}^T \left| {{y_t} - {y_{t - 1}}} \right|}},\end{equation}
where
 $H$
is the forecast horizon;
 ${y_{t + h}}$
and
 ${\hat y_{t + h}}$
are the actual and forecast values in the test data (samples which have a time index after
 $T$
), respectively; and the denominator represents the scaling by the NV error on the training data of size
 $T$
.
Furthermore, in the current study, the training and prediction times are key metrics for evaluating the practical efficiency of the proposed approach. The training time quantifies the computational cost of running the combination methods, highlighting the cost and feasibility of model development and retraining, particularly on large datasets. Conversely, the prediction time (or inference time) measures the speed time at which the final trained model can generate a forecast for a new time series. This metric is fundamental for assessing the method’s ability to operate in fast-response design or low-latency prediction environments, ensuring that the models can be delivered to meet operational demands. Together, these two metrics provide a comprehensive view of the approaches’ overall speed and scalability, balancing the cost of learning with the benefit of rapid application.
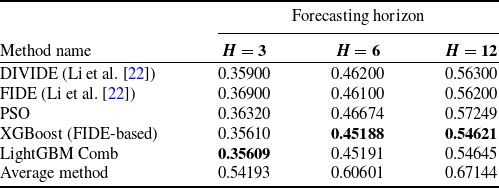
RMSSE results of the combination approaches

Table 1 Long description
A table comparing RMSSE results of different combination approaches across various forecasting horizons. The table has 6 rows and 4 columns. The columns are labeled as Method name, H = 3, H = 6, and H = 12. The rows are labeled with different methods: DIVIDE, FIDE, PSO, XGBoost (FIDE-based), LightGBM Comb, and Average method. Row 1: DIVIDE, 0.35900, 0.46200, 0.56300. Row 2: FIDE, 0.36900, 0.46100, 0.56200. Row 3: PSO, 0.36320, 0.46674, 0.57249. Row 4: XGBoost (FIDE-based), 0.35610, 0.45188, 0.54621. Row 5: LightGBM Comb, 0.35609, 0.45191, 0.54645. Row 6: Average method, 0.54193, 0.60601, 0.67144.
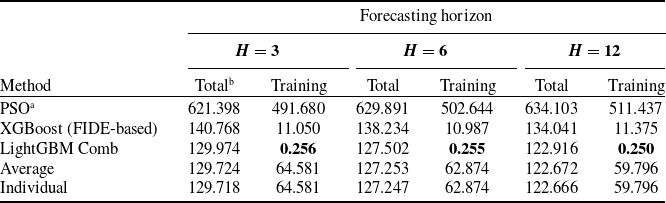
Run-time comparisons of the combination approaches

Table 2 Long description
A table comparing run-time of combination approaches for different forecasting horizons. The table has 5 rows and 7 columns. The columns are labeled as Method, Total for H = 3, Training for H = 3, Total for H = 6, Training for H = 6, Total for H = 12, and Training for H = 12. The rows are labeled as PSO, XGBoost (FIDE-based), LightGBM Comb, Average, and Individual. Row 1: PSO, 621.398, 491.680, 629.891, 502.644, 634.103, 511.437. Row 2: XGBoost (FIDE-based), 140.768, 11.050, 138.234, 10.987, 134.041, 11.375. Row 3: LightGBM Comb, 129.974, 0.256, 127.502, 0.255, 122.916, 0.250. Row 4: Average, 129.724, 64.581, 127.253, 62.874, 122.672, 59.796. Row 5: Individual, 129.718, 64.581, 127.247, 62.874, 122.666, 59.796.
a “Train” time here refers to the weights optimisation time.
b All times are in minutes.
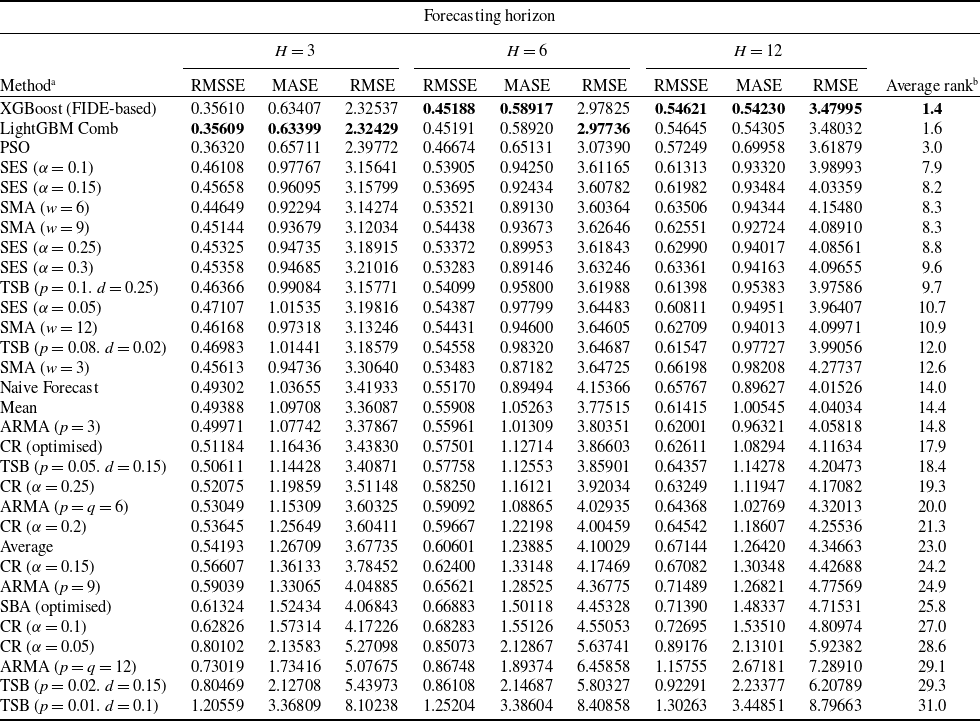
Accuracy results of individual and combination methods

Table 3 Long description
A table with 35 rows and 12 columns comparing the accuracy of individual and combination methods for forecasting horizons H = 3, H = 6, and H = 12. The columns are labeled RMSSE, MASE, RMSE for each horizon, and Average rank. The rows are labeled with different methods such as XGBoost, LightGBM Comb, PSO, SES, SMA, TSB, Naive Forecast, Mean, ARMA, CR, and SBA. Each row contains values for RMSSE, MASE, RMSE for each horizon, and the average rank. Notable trends include the methods XGBoost and LightGBM Comb having the lowest average ranks, indicating higher accuracy.
a The parentheses values have the main parameters of each method.
b The sum of all the method (line) rank position (in each column) divided by the total of metrics evaluated (9).
4.0 Results and discussion
All experiments were conducted on a PC with the following hardware configuration: an Intel(R) Xeon(R) CPU with 4 cores, operating at up to 3.10 GHz, supplemented by 32 GB of RAM. The software stack was built on a Linux Debian 6.1.0 operating system, running Python 3.11. The main libraries used to implement the combination approaches were xgboost [Reference Chen and Guestrin27] 2.1.2, lightgbm [Reference Corporation28] 4.6.0 and pyswarms [Reference Miranda, Aurelio, Abellera, Dungo and Bituin29] 1.3.0, with all code managed and executed within an Anaconda environment. To implement the individual time series models, the following Python packages were used: statsmodels [Reference Seabold and Perktold30] (version: 0.14.4), sktime [Reference Löning, Bagnall, Ganesh, Kazakov, Lines and Király31] (version: 0.34.0), pmdarima [Reference Smith32] (version: 2.0.4) and darts [Reference Herzen, Lässig, Piazzetta, Neuer, Tafti, Raille, Pottelbergh, Pasieka, Skrodzki, Huguenin, Dumonal, Kościsz, Bader, Gusset, Benheddi, Williamson, Kosinski, Petrik and Grosch33] (version: 0.31.0). Finally, the tsfresh [Reference Christ, Braun, Neuffer and Kempa-Liehr34] (version: 0.21.1) package was used to support features generation. This setup provided sufficient computational resources to handle the large-scale time series reference set and to ensure rapid convergence during training.
To ensure comparisons with the experimental design adopted by Ref. [Reference Li, Kang, Petropoulos and Li22], the entire experiment was executed, with three fixed-origin/multi-step forecasting horizons for testing. Specifically, the horizons evaluated were
 $H = 3$
,
 $H = 6$
and
 $H = 12$
(Tables 1, 2 and 3, respectively), which match the settings reported in Ref. [Reference Li, Kang, Petropoulos and Li22] and enable a consistent assessment of the relative performance of the proposed methods. Furthermore, the same horizon value was used to define the validation interval size, i.e. the test and validation intervals have the same size. The results obtained under each horizon configuration are summarised in Table 1, allowing a clear comparison of how forecast accuracy varies with the prediction horizon. Table 1 presents the main results comparing the combination-based approaches.
The results presented in Table 1 show that the proposed LightGBM Comb and the XGBoost (FIDE-based) combination approaches provide the most accurate forecasts across all evaluated horizons, consistently outperforming the DIVIDE and the original FIDE benchmarks proposed by Ref. [Reference Li, Kang, Petropoulos and Li22]. For the shortest horizon (
 $H = 3$
), the proposed approach, LightGBM Comb, achieves the lowest RMSSE, slightly outperforming XGBoost (FIDE-based) and clearly surpassing both baseline methods (i.e. DIVIDE and FIDE). As the forecast horizon increases to
 $H = 6$
and
 $H = 12$
, XGBoost (FIDE-based) attains the best overall results. However, LightGBM Comb has very close results, demonstrating comparable predictive capability. In contrast, the PSO-based combination yields higher RMSSE values, performing worse than both boosting methods and gradually diverging from FIDE and DIVIDE at longer horizons, which suggests sensitivity to horizon length and increased variability in optimisation-based weighting. The average method (i.e. average of individual methods’ output predictions) performs considerably worse than all others across all horizons, suggesting that equal-weight combinations may be inadequate for intermittent demand forecasting. Overall, the findings highlight the robustness and superior accuracy of the LightGBM Comb and XGBoost (FIDE-based) approaches, confirming their effectiveness across multiple forecast horizons.
Table 2 shows the run-time (in minutes) differences among the considered methods, considering all series. The table summarises the run-time performance of different forecast approaches across three forecasting horizons. The column ‘Training’ indicates the time required to train each method, and the column ‘Total’ shows the time needed for each method to run the complete two-phase procedure described in Section 3. The bold values emphasise the lowest values in each column. It should be noted that the ‘Total’ for the Individual methods includes the time to fit with the training interval and retraining with the training and validation interval data. Furthermore, the ‘Total’ time for Average is slightly longer than that of the Individual methods, as it considers the time required to calculate the average of the predictions (generally around
 $0.006$
minutes across all series). For the other methods, i.e. PSO, LightGBM Comb and XGBoost (FIDE-based), the ‘Total’ column already considers the time required to train the individual models. The primary aspect of the current study’s contribution lies in the ‘Training’ time for the combination approaches, and therefore, these times have been separated for clarity.
The run-time results reveal substantial differences in computational efficiency among the evaluated combination approaches. It is worth highlighting that a characteristic of combination methods is that their execution times are tied to the time required to adjust and generate the forecasts of the individual methods, as well as combination weights optimisation; therefore, any gain or reduction in the time needed to calculate the weights of the combination strategies can imply an overall increase.
The PSO-based method is the most computationally expensive technique. Its training (optimisation) times range from 491 to over 511 minutes, depending on the horizon. Such a high computational cost may render PSO inapplicable for large-scale or time-sensitive forecasting applications, despite its competitive forecasting accuracy.
In contrast, both meta-learning approaches (i.e. XGBoost and LightGBM Comb) deliver good computational time performance. ‘Training’ and ‘Total’ times remain stable across all forecast horizons. For example, with values around 10–11 minutes for XGBoost (FIDE-based) training and around
 $0.2$
minutes for LightGBM Comb. LightGBM Comb is the fastest method, requiring less time than XGBoost (FIDE-based). This efficiency advantage reinforces the suitability of LightGBM Comb as a scalable meta-learning approach capable of handling large collections of (intermittent) time series with a modest computational usage.
Baseline approaches, such as FIDE and DIVIDE, did not report execution times in a manner that allows for comparison in this study. The average method provides a lower bound reference for the ‘Total’ cost, as it is a simpler operation (calculating the average of the forecasts), with the time of this approach being dominated by the time of the individual methods. However, it should be noted that it does not always exhibit good predictive performance (refer to Table 1); meanwhile, our XGBoost (FIDE-based) implementation serves as a good benchmark for comparison.
Overall, the results show that LightGBM Comb offers the best balance between computational time and accuracy, achieving state-of-the-art forecasting performance while maintaining low run-time overhead. It should be noted that, with LightGBM, the training time required was reduced by
 $96{\rm{\% }}$
(on average) compared to XGBoost (FIDE-based). This makes it a strong candidate and a prominent choice for real-world applications where both predictive accuracy and computational efficiency are critical.
The full results, presented in Table 3, show a consistent pattern across all accuracy metrics and forecast horizons. The table presents a comprehensive comparison of forecasting methods, where each method corresponds to a combination method or an individual model (or variant defined by its main parameters). For each method, its performance is evaluated across three forecasting horizons (i.e.
 $H = 3$
,
 $H = 6$
and
 $H = 12$
). Within each horizon, three error metrics (i.e. RMSSE, MASE and RMSE) are reported. The final column, Average Rank, summarises overall performance by ranking each method across all horizons and metrics, providing a single comparative indicator where lower values denote better average performance. This structure facilitates both detailed metric analysis and high-level comparison across the complete set of forecasting techniques.
The two combination approaches based on meta-learning (i.e. XGBoost and LightGBM Comb) clearly outperform all the individual methods, including classical intermittent demand models (e.g. CR, TSB and SBA), statistical baselines (e.g. Naive, Mean and ARMA), and simple methods such as moving averages and exponential smoothing. LightGBM Comb achieves the lowest RMSSE for
 $H = 3$
, while XGBoost (FIDE-based) provides the best results for
 $H = 6$
and
 $H = 12$
. Although their differences are minimal, this confirms that both gradient-boosted tree approaches are highly effective in this context. However, the computational time of LightGBM Comb is significantly lower than that of XGBoost (FIDE-based). Importantly, the PSO combination method outperforms most individual forecasting models, highlighting the benefit of optimising weight combinations, but still falls short of the performance achieved by LightGBM Comb and XGBoost (FIDE-based), particularly at larger horizons.
The results also underscore the limitations of simple averaging (average method), which performs reasonably but remains clearly inferior to all optimised combination strategies. This reinforces the importance of data-driven weighting schemes, for example, through meta-heuristics such as PSO or by meta-learning models like XGBoost and LightGBM. Additionally, the findings show that LightGBM Comb provides the optimal balance of accuracy and computational efficiency. At the same time, the inclusion of a diverse set of parameterised base individual methods significantly enhances the effectiveness of the combination strategies. In addition, the results suggest that the meta-learning approaches are well-suited to other demand forecasting contexts with intermittency, such as spare parts in sectors like maritime, defense and industrial maintenance, indicating strong potential for generalisation beyond the aeronautical sector.
5.0 Conclusion
This study introduced a forecasting combination framework that employs LightGBM as a meta-learning model (LightGBM Comb) to generate combination weights for intermittent demand time series coming from the aeronautical context. The experimental results demonstrate that LightGBM Comb is an efficient and accurate alternative for forecast combination, consistently matching or surpassing the performance of the XGBoost (FIDE-based) implementation while requiring substantially less computational time. Across all the demand horizons and error metrics evaluated, LightGBM Comb delivered state-of-the-art accuracy, outperforming classical intermittent demand specialised models, statistical baselines, heuristics and averaging approaches. These findings reaffirm that gradient-boosted tree methods, when used as meta-learners, can effectively leverage time series features to assign adaptive and high-quality combination weights, resulting in robust improvements over individual models.
From a practical perspective, the proposed LightGBM Comb approach offers several appealing advantages for real-world applications. Its computational efficiency and fast inference time make it particularly suitable for environments involving large volumes of time series, such as aeronautical logistics systems, inventory management platforms or fleet maintenance operations. Furthermore, the method’s ability to provide accurate forecasts with relatively modest training costs enables its application in real-time decision-making settings, where rapid model updates and on-demand forecasting are often required. This efficiency is coupled with the flexibility to incorporate a diverse pool of base forecasting models, thereby increasing robustness across heterogeneous demand patterns.
Despite these strengths, some limitations must be acknowledged. As a boosting-based approach, LightGBM Comb remains sensitive to hyperparameter specification, and achieving optimal performance may require careful calibration, especially when dealing with highly irregular or extremely sparse demand series. The method also relies on the availability of well-constructed and meaningful time series features, as well as on feature extraction and scaling, which can degrade the quality of the learned weights if not applied properly.
Future developments could explore several directions. One avenue involves evaluating other gradient boosting frameworks or more advanced neural network architectures for weight generation. Another direction is to extend the methodology to non-intermittent demand scenarios or to hybrid datasets containing mixed demand profiles, such as trends, cycles, seasons and other patterns. Expanding the experimental design to support multi-horizon forecasting or rolling-window evaluation would also enable a more thorough understanding of temporal stability and adaptation. Finally, applying the approach to additional datasets from different sectors, such as manufacturing, retail or energy, would help assess its generalisability and strengthen its applicability beyond the aeronautical domain.
Overall, this work provides strong empirical evidence that LightGBM constitutes an effective, scalable and accurate meta-learning solution for forecast combination, offering a powerful tool for organisations that rely on reliable demand prediction in complex and data-intensive environments.
Supplementary material
The supplementary material for this article can be found at https://doi.org/10.1017/aer.2026.10175.
Acknowledgements
Rui A. M. Araújo thanks “Instituto de Sistemas e Robótica - ISR - Coimbra”, “Fundação para a Ciência e Tecnologia” (FCT), reference UID/PRR/00048/2025, DOI https://doi.org/10.54499/UID/PRR/00048/2025.
Competing interests
The authors declare that they have no known competing financial interests or personal relationships that could have appeared to influence the work reported in this paper.