Introduction
Neuropsychiatric symptoms (NPS) are common in patients with mild cognitive impairment (MCI) and Alzheimer’s disease with dementia (AD dementia) (Geda et al., Reference Geda2013). NPS are not only a considerable burden for patients, caregivers, and healthcare systems, but also increase the risk for cognitive deterioration and institutionalization (Maresova et al., Reference Maresova, Hruska, Klimova, Barakovic and Krejcar2020). While the severity and prevalence of NPS increase with cognitive impairment (M et al., Reference M, Molano, Castro and Zarranz2010), it is unclear if this association reflects common mechanisms of cognitive symptoms and NPS, and the brain structural correlates of NPS in patients with MCI or AD dementia are largely unknown. A better understanding of the mechanisms of NPS in patients with these age-related cognitive disorders could help develop more targeted and efficacious treatment alternatives.
Structural MRI has been used to assess the brain morphological correlates of NPS, with diverging results (Alves et al., Reference Alves2017; Boublay et al., Reference Boublay, Schott and Krolak-Salmon2016; Milham et al., Reference Milham, Craddock and Klein2017). For instance, while one study showed more atrophy in temporal and parietal regions in depressed compared to nondepressed AD dementia patients (Lebedeva et al., Reference Lebedeva2014), another study suggested less atrophy in the medial temporal cortex in depressed AD dementia patients (Enache et al., Reference Enache2015). Further, compared to non-delusional AD dementia patients, delusional AD dementia patients showed left medial orbitofrontal, superior temporal (Whitehead et al., Reference Whitehead2012), or cingulate cortex atrophy (Serra et al., Reference Serra2010). Apathy has more consistently been associated with atrophy or decreased metabolism of the ACC and other frontal regions including medial prefrontal areas and the striatum (Stella et al., Reference Stella2014; Victoroff et al., Reference Victoroff2018) or the temporal lobe (Guercio et al., Reference Guercio2015). Methodological differences and inconsistencies in study design, sample size, statistical approach, and in the definition and selection of NPS may partly explain the lack of consistency and replicability of results. While some studies compared regional brain volumes in groups of patients with or without NPS (Apostolova et al., Reference Apostolova2007; Dhikav et al., Reference Dhikav, Sethi and Anand2014; Enache et al., Reference Enache2015; Howanitz et al., Reference Howanitz, Bajulaiye and Losonczy1995; Nakaaki et al., Reference Nakaaki2013), others tested for linear associations between NPS severity and regional brain volumes (Serra et al., Reference Serra2010; Trzepacz et al., Reference Trzepacz2013). Various tools were used to define NPS including the Neuropsychiatric Inventory – Questionnaire (NPI-Q) (Zahodne et al., Reference Zahodne, Gongvatana, Cohen, Ott and Tremont2013), the Cornell Scale for Depression in Dementia (CSDD) (Enache et al., Reference Enache2015), the NPI-Q domain for apathy (Apostolova et al., Reference Apostolova2007), the Apathy Evaluation Scale (Starkstein et al., Reference Starkstein2009), or clinical signs alone (Howanitz et al., Reference Howanitz, Bajulaiye and Losonczy1995). Most studies have examined a set of a priori selected brain regions and a priori selected individual NPS. However, NPS tend to covary (van der Linde et al., Reference Van der Linde, Dening, Matthews and Brayne2014), appear as clinical syndromes, and have been linked to disparate regions across the brain (Rosenberg et al., Reference Rosenberg, Nowrangi and Lyketsos2015). Studies focusing on a small subset of NPS and brain regions may therefore lack the sensitivity to more widespread associations. Instead of confining the search to a small set of predefined regions, including all cortical and subcortical brain MRI measures derived using FreeSurfer enabled us to examine associations between NPS and brain structure across the brain in an unbiased fashion. Lastly, small studies with mostly fewer than 50 included subjects may lead to over- or underestimation of subtle brain structural or NPS changes, which is a likely source of the previous diverging findings.
Here, in a sample of 235 patients with MCI or AD dementia, we tested for associations between NPS and MRI-based measures across the whole brain, including regional cortical thickness and volume, as well as subcortical volumes using FreeSurfer (Fischl, Reference Fischl2012). We estimated the factor structure of the 12 NPI-Q severity indices by means of a principal component analysis (PCA) and tested for associations between the emerging factor scores and brain MRI features. We used factor scores for reasons of parsimony and to increase power. Based on previous findings, we hypothesized NPS to be associated with the thickness and volume of frontotemporal regions, including the anterior cingulate cortex (ACC) (Boublay et al., Reference Boublay, Schott and Krolak-Salmon2016). We used linear models to test for associations between the brain MRI measures and NPI-Q component scores and corrected for multiple comparisons using false discovery rate (FDR), and, for transparency, we performed an additional item-level analysis.
Material and methods
Design and sample
This is a cross-sectional study assessing associations between NPS and brain MRI in patients with MCI and AD dementia. We analyzed data obtained from outpatients (n = 241) at the Memory Clinic and inpatients (n = 44) at the Old Age Psychiatry Unit at Oslo University Hospital. After visual quality check (see below), MRI data from 50 patients were excluded. The outpatients are included in the Norwegian Registry of Persons with Cognitive Symptoms (NORCOG), the inpatients in the Quality Register for Old Age Psychiatry Patients (KVALAP). Both registries are run by the Norwegian National Advisory Unit on Ageing and Health (Aldring og helse) and the Oslo University Hospital. In this study, we included only those patients with MCI and AD dementia for whom data on structural MRI, Mini-Mental State Examination (MMSE) (Folstein et al., Reference Folstein, Folstein and McHugh1975), and the informant-based NPI-Q score (Kaufer et al., Reference Kaufer2000) were available as a complete bundle, collected within an interval of 180 days (mean = 52.0, SD = 117.0).
An overview of recruitment is provided, please see Figure S1 published as Supplementary material online attached to the electronic version of this paper. The study is approved by the Norwegian Data Protection Authority and the Regional Committee for Medical and Health Research Ethics (REK), inclusion and collection of data are based on patients’ and relatives’ written informed consent.
Diagnostic and clinical assessments
Trained consultants examined the patients following a common research protocol and assessed clinical diagnoses of AD dementia according to ICD-10 (1992) and of MCI according to ICD-10 and Winblad criteria (Winblad et al., Reference Winblad2004). We included dementia patients with a diagnosis of AD dementia (n = 133) (criteria as in ICD-10 F00.-*; G30.-*). Diagnostic assessment consisted of medical history, mental state, and physical examination, various assessment scales, blood samples, and structural MRI. Diagnostic assessment has in detail been described (Bakkane Bendixen et al., Reference Bakkane Bendixen, Hartberg, Selbaek and Engedal2016; Bendixen et al., Reference Bendixen and Engedal2016; Kristiansen et al., Reference Kristiansen and Engedal2013; Siafarikas et al., Reference Siafarikas2018).
We used the validated Norwegian version of the MMSE to assess cognitive impairment (Engedal et al., Reference Engedal, Haugen, Gilje and Laake1988). The NPI-Q, based on the NPI (Cummings et al., Reference Cummings1994), is an informant-based questionnaire assessing NPS in clinical practice and is widely used and validated (Kaufer et al., Reference Kaufer2000). It includes 12 neuropsychiatric items: delusions, hallucinations, agitation/aggression, depression, anxiety, elation/euphoria, apathy/indifference, disinhibition, irritability/lability, motor disturbance, nighttime behavior, and appetite/eating. For each of the 12 items, the interviewer asks an initial screening question with response options “Yes” (present) and “No” (absent). If the response is “Yes,” the informant rates the severity of the symptoms on a 3-point scale (mild, moderate, and severe), i.e. each symptom scored 0–3. To identify subgroups of NPS, factor analysis of NPI-Q items was performed with principal component extraction method. The validated Norwegian version was used in this study (Rogne et al., Reference Rogne and Ulstein2012)
Magnetic resonance imaging acquisition
MRI scans were obtained from three scanners: A GE 3T SignaHDXT with a sagittal T1-weighted fast spoiled gradient-echo (FSPGR) sequence (TR =7.8 ms; TE = 2.956 ms; TI = 450 ms; flip angle = 12°; voxel size = 1.0 × 1.0 × 1.2 mm; 170 sagittal slices); a GE 3T Discovery GE750 scanner with a T1w BRAVO sequence (TR = 8.16 ms, TE = 3.18 ms, TI = 450 ms, flip angle = 12o, voxel size = 1.0 × 1.0 × 1.0 mm, 256 sagittal slices); and a Siemens 1.5 T Avanto scanner with a sagittal MPRAGE sequence (TR = 1900 ms, TE =3.1 ms, TI = 1100 ms, flip angle = 15o, voxel size (reconstructed) = 0.48 × 0.48 × 1.0 mm, 160 sagittal slices).
All MRI datasets were rigorously quality controlled. This included visual assessment of the segmentations, minor manual intervention to correct for segmentation errors, if deemed applicable, and exclusion of datasets with low quality due to motion artifacts (n = 50).
The T1-weighted datasets were processed in FreeSurfer 5.3 to estimate vertex-wise cortical thickness and volume (Dale et al., Reference Dale, Fischl and Sereno1999). Subcortical volumes were calculated by the automated procedure for volumetric measures of the brain structures in FreeSurfer (Fischl et al., Reference Fischl and Dale2000). A total of 170 brain MRI variables were included.
Statistical analyses
All analyses were performed in SPSS v. 22 and R v. 4.0.2 (R Core Team, 2017). Demographic and clinical patient characteristics were described as means and standard deviations (SD) or frequencies and percentages. ANOVA was applied to compare continuous variables across patient groups. Chi-square test was used for comparison of categorical variables across patient groups. We submitted severity indices for all NPI-Q items to PCA, extracting four components based on Kaiser’s criterion of eigenvalues equal to or higher than 1, before applying varimax rotation.
To test for associations between the NPI-Q severity component scores (rotated components RC1, RC2, RC3, RC4) and regional cortical thickness and brain volumes we used a two-step procedure. First, we estimated generalized additive models (GAM) (Wood, Reference Wood2017), using the R-package “mgcv” to adjust MRI variables for scanner (and ICV in case of volumes) using the following model specifications: Y = s(Age, bs = "cr”, k = 10) + Sex +Diagnosis (MCI/AD dementia) + RC1 + RC2 +RC3 + RC4 + ICV + Scanner, where Y refers to the MRI – measures, bs – parameter refers to the smooth function, “cr” specifies cubic splines, while the k – parameter specifies the number of basis functions. The scanner-residualized MRI variables were then used as dependent variables in linear models with NPI-Q component scores as independent variables, covarying for age, sex, and diagnosis (Y−Age + Sex + diagnosis [MCI/AD dementia] + RC). The four NPI-Q components were tested in separate models. Since cognitive status may influence psychiatric symptoms, we also tested for interactions between NPI-Q component scores and diagnosis on MRI features. Multiple testing was adjusted for by FDR (Benjamini et al., Reference Benjamini and Hochberg1995). The vectors of all p-values from all tests within the PCA-score models, as well as tests performed for the NPI-Q item models, were submitted to FDR correction. We report standardized β coefficients (B-values) as effect sizes of the associations between NPS and MRI features.
For transparency, we conducted, in addition, similar analyses using the individual NPI-Q items agitation, apathy, anxiety, depression, and nighttime behavior instead of PCA-based scores.
Results
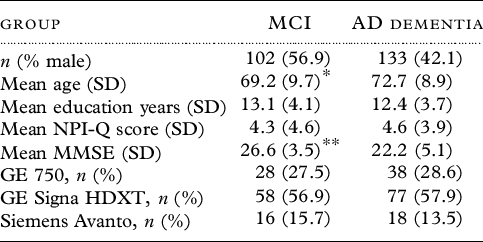
We included 235 patients (n = 102 MCI, 56.9% male; n = 133 AD dementia; 42.1% male). MMSE was significantly higher in MCI than in AD dementia (p < 0.001). Clinical and demographic data of the sample are shown in Table 1.
Sociodemographic and clinical data

Significant difference between groups: * p < 0.05; ** p < 0.001 (ANOVA).
Factor structure of NPS
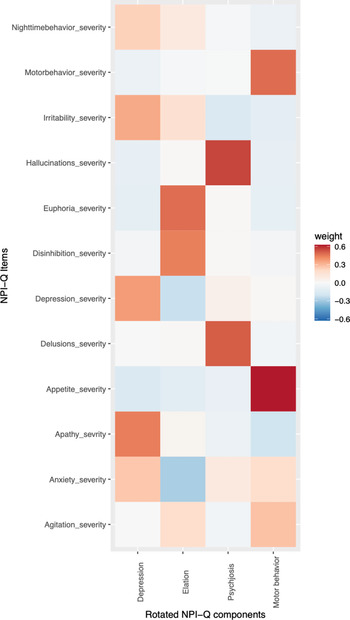
The PCA (Figure 1) reduced the NPI-Q items to four factors jointly explaining 60% of the total variance. Based on the item loading, we labeled the factors elation (consisting of euphoria and disinhibition), psychosis (consisting of hallucinations and delusions), depression (consisting of depression, apathy, anxiety, irritability, and nighttime behavior), and motor behavior (consisting of motor behavior, agitation, and appetite).
Factor solution for the severity indices of the NPI-Q items in our cohorts. The rows reflect the NPIQ items and the columns reflect the emerging factor scores from the PCA. The values reflected in the colorcoding represent the correlation between each item and the factor score (rotated NPI-Q components: RC1 = elation; RC2 = psychosis; RC3 = depression; RC4 = motor behavior).

Associations between demographic and clinical variables and brain MRI
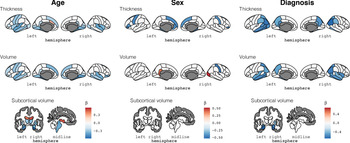
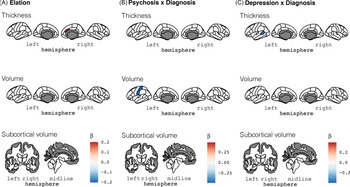
Figures 2 and 3 summarize the results from the linear models testing for associations between MRI features with diagnosis (MCI, AD dementia), age, sex, and NPS regression scores.
Diagnosis, age, sex, and MRI features of the brain. Associations between demographic characteristics and diagnosis and brain features. Significant (pFDR < .05) associations are shown, and the colors represent the corresponding B-value from the linearmodel. Age, female sex and AD dementia are overall associated with thinner cortex and smaller volumes.

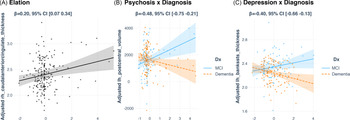
NPS regression scores and MRI features of the brain. Associations between NPS regression scores and MRI characteristics. A) Main effects from linear modelstesting for associations between NPS factor scores and MRI features. Significant (pFDR < .05) associations are shown, and the colors represent the corresponding B-value from the linear model. We found a positive association between elation and the right ACC thickness. B) and C) Interaction effects between group (MCI versus AD dementia) and NPS factor scores on MRI features. Significant (pFDR < .05) interactions were found on the associations between psychosis and the left post central gyrus and between depression and the thickness of the banks of the left superior temporal sulcus.

Diagnosis, age and sex, and MRI features
Compared to patients with MCI, patients with AD dementia showed thinner cortex, encompassing parietal, occipital, and temporal lobe regions, and smaller cortical and subcortical volumes, with the strongest effect observed in the hippocampus (Figure 2). Overall, age was negatively correlated with cortical thickness and brain volumes, and women exhibited thinner cortex in frontal and parietal regions; smaller right post-central volume, larger right lateral occipital, and left isthmus cingulate cortex.
NPS factor scores and associations to MRI features
Figure 3 shows the associations between the factor scores and MRI features. FDR adjustment revealed a significant positive association (B = 0.20, pFDR < 0.005) between elation and cortical thickness of the right caudal ACC across MCI and AD dementia. In addition, we found significant interactions between diagnosis and psychosis on the left post-central volume (B = −0.48, pFDR < 0.0010) and between diagnosis and depression on the thickness of the banks of the left superior temporal sulcus (B = −0.40, pFDR < 0.005). Both interactions reflected significant positive associations between NPS and the MRI feature in patients with MCI and negative associations in patients with AD dementia (Figure 4). No significant associations were found between motor behavior and MRI features.
Plots for interaction slopes. Associations between NPS factor scores and brain MRI features in significant regions of interest. Scatter plots depicting associations between A) elation and the right ACC thickness across MCI and AD dementia, B) psychosis and left postcentral volume in MCI vs AD dementia and C) depression and thickness of the left banks of the superior temporal sulcus in MCI vs AD dementia.

Individual NPI-Q items and associations to MRI features
FDR-adjusted linear models revealed no significant associations between NPI-Q items and MRI features. Including an interaction term, revealed significant interactions between NPI-Q item and diagnosis for apathy on the volume of the banks of the left superior temporal sulcus (B = −0.41, pFDR < 0.005) and the left superior frontal volume (B = −0.39, pFDR < 0.005); for nighttime behavior on the left temporal pole volume (B = −0.44, pFDR < 0.005); for anxiety on the left entorhinal volume (B = −0.38, pFDR < 0.005) on the left inferior lateral ventricle (B = 0.37, pFDR < 0.005) and on the third ventricle (B = 0.36, pFDR < 0.005); and for depression on the volume of the left cerebellum cortex (B = 0.45, pFDR < 0.0010). Please see Figure S2 published as Supplementary material online attached to the electronic version of this paper.
Discussion
Patients with MCI or AD dementia frequently experience NPS, but whether the cognitive symptoms and NPS share common brain mechanisms is unclear. Here, we investigated the associations between data-driven NPS domains and brain morphology in a large sample of in- and outpatients with MCI or AD dementia. In line with previous studies (Ghazi-Saidi et al., Reference Ghazi-Saidi, Walsh, Shan and Banks2018; Hogstrom et al., Reference Hogstrom, Westlye, Walhovd and Fjell2013; Westlye et al., Reference Westlye2009), increasing age and cognitive impairment were associated with thinner cortex and smaller subcortical volumes throughout the brain, in particular encompassing the retrosplenial cortex, the temporal lobe, and the hippocampus. Our analysis revealed a significant positive association between elation and right ACC thickness across MCI and AD dementia, suggesting a thicker cortex with higher elation levels. In addition, significant interaction effects indicated that the associations between psychosis and the left post-central volume and between depression and the thickness of the left banks of the superior temporal sulcus significantly differed between patients with MCI and AD dementia. Overall, while the strength of the associations was moderate, these results supported our hypothesis of an association between NPS and the structure of frontotemporal regions, including the ACC.
The NPS factor elation, consisting of the NPI-Q items euphoria and disinhibition with nearly similar loadings, had a significant positive association to the thickness of the right ACC across groups. The ACC has been conceptualized as an executive region of the brain (Nowrangi et al., 2020) with an interface function between prefrontal cognitive and affective limbic regions (Stevens et al., Reference Stevens, Hurley and Taber2011). The ACC has been implicated as a key structure in the extended brain network supporting emotional regulation (Berthoz et al., Reference Berthoz, Blair, Le Clec’h and Martinot2002), and associations between atrophy of the ACC and euphoria and disinhibition have been reported (Serra et al., Reference Serra2010; Udo de Haes et al., Reference Udo De Haes, Maguire, Jager, Paans and Den Boer2007). While the thickness of the ACC was not significantly different between patients with MCI or AD dementia, the ACC was among the few regions showing positive associations with age, which is in line with previous observations in cross-sectional studies including older aged participants (Frangou et al., Reference Frangou2021; Salat et al., Reference Salat2004; Westlye et al., Reference Westlye2010). Although it has been suggested that this paradoxical age-related association to the ACC could reflect selection bias in elderly samples (Fjell et al., Reference Fjell, McEvoy, Holland, Dale and Walhovd2014), the neurobiology determining MRI estimated cortical thickness is highly complex and likely varies between brain regions and individuals. The lack of group differences and the positive association between caudal ACC thickness and elation indicates that mechanisms other than atrophy are involved in the development of elation. Mechanisms could include for example enhanced connectivity or increased activity (Balthazar et al., Reference Balthazar2014). Although the current findings need replication in independent samples, the specific association to elation symptoms may form the basis of more predictive brain imaging biomarkers and targeted interventions and is in line with theoretical and empirical accounts conceptualizing the ACC as a central structure in affect regulation.
The significant interactions between group and NPS on some brain features revealed that increasing severity of depression is associated with thicker cortex in the banks of the left superior temporal gyrus in patients with MCI, but a thinner cortex in this region in patients with AD dementia. The same pattern was found for the association between psychosis and the volume of the left post-central gyrus. The post-central gyrus includes the primary somatosensory cortex, which is a key constituent of the brain network representing and integrating somatic sensations such as touch, proprioception, and pain (Kropf et al., Reference Kropf, Syan, Minuzzi and Frey2019). While little is known about the involvement of the post-central gyrus in psychotic symptoms in AD dementia, negative correlations between post-central gyrus volume and the severity of hallucinations (García-Martí et al., Reference García-Martí2008) as well as an association of parietal hypoperfusion to hallucinations (Kotrla et al., Reference Kotrla, Chacko, Harper, Jhingran and Doody1995) have been reported in people with schizophrenia. It is unclear to which degree these findings can be generalized to AD dementia. In contrast to our findings, delusions in AD dementia have previously been associated with atrophy and hypoperfusion in the right frontal lobe (Ismail et al., Reference Ismail, Nguyen, Fischer, Schweizer and Mulsant2012), and further studies mapping the brain structural underpinnings of delusions are needed. It is further possible that MCI patients with relatively preserved brain structure and function may be more capable of insight into and expression of depressive and psychotic symptoms and have more available resources to compensate for these NPS, while AD patients with thinner cortex and smaller volumes may to a larger extent have lost these capacities. Some parallels may be seen to findings of enhanced salience network connectivity in the ACC and insula of AD patients with hyperactivity syndrome (Balthazar et al., Reference Balthazar2014), where it has been speculated that enhanced connectivity in these patients could lead to misperception of irrelevant events with consecutive hyperactivity.
Our finding of a negative association between depression and the thickness of the superior temporal gyrus in AD dementia concurs with the observation of smaller superior temporal volumes in patients with major depressive disorder compared to healthy controls (Takahashi et al., Reference Takahashi2010). Supporting a role of the superior temporal regions in depression, adolescents with major depressive disorders exhibited abnormal functional connectivity in a network including the left superior temporal gyrus (Cullen et al., Reference Cullen2009). Further, high level of anxiety, which is frequently comorbid with depression and also included in our depression factor, has been associated with lower metabolism in the left superior temporal gyrus in an FDG-PET study (Hashimoto et al., Reference Hashimoto2006). However, a previous MRI and FDG-PET study reported no significant associations between depression and neuroimaging markers in a predementia AD sample (Auning et al., Reference Auning2015), and the neuroanatomical correlates of depression in patients with age-related cognitive disorders remain unclear.
Motor behavior showed no significant associations with brain MRI features in our sample. The reason for this is unclear. A probable explanation is the relatively small variability of motor symptoms in our sample, and future studies including patients with more severe motor symptoms may reveal stronger links with brain morphometry. Another explanation could be that individual differences in motor symptoms may be primarily mediated by functional brain characteristics, and the few studies that found correlations of motor symptoms in the brain applied dynamic methods such as PET or SPECT (for review [Cipriani et al., Reference Cipriani, Lucetti, Nuti and Danti2014]).
Strengths of the current study include the relatively large sample size compared to previous clinical studies, the wide spectrum of NPS, and the use of aggregate scores from PCA which increases power and parsimony by reducing the number of variables, and our unbiased full-brain MRI approach. Limitations include a cross-sectional design that fails to detect changes over time. Further assessment of the temporal aspects of the associations between brain structure and NPS requires longitudinal analyses. Next, while we used a clinical and representative sample, the ICD-10-based MCI is an unspecific and heterogeneous syndrome with unclear etiology and probably comprises various diseases. In the dementia group, we included only those patients with a clinical diagnosis of AD dementia to form a homogenous dementia group. However, a clinical diagnosis of AD dementia without histopathological confirmation may include some misdiagnosis. We did not include healthy controls, which could have provided a relevant context from which to interpret the results. The included cohorts are clinical cohorts and in clinical practice, ICD-10 is used in Norway. We, therefore, did not use more current criteria for MCI and AD dementia. Lastly, while the additional item-level analyses replicated associations between symptoms of the depression factor (apathy and nighttime behavior) and the left temporal lobe, other associations were not replicated. In general, this inconsistency is in line with previous reports and demonstrates the effect of statistical approach on the outcome.
Our results linking elation to the ACC and depression to parts of the temporal lobe partly supported our hypothesis of an association between psychiatric symptoms and structural characteristics of frontotemporal brain regions in patients with MCI and AD dementia. The association between psychosis and the post-central gyrus indicates that the extended brain network underpinning psychiatric symptoms in patients with age-related cognitive disorders encompasses regions beyond the frontotemporal complex. The observed differences between MCI and AD dementia seem plausible considering that the AD dementia group comprises a defined disease, while the MCI group comprises patients with probably different diseases sharing cognitive symptoms compatible with a clinical diagnosis of MCI which, however, is a syndrome rather than a specific diagnosis. In fact, some MCI patients may have AD and progress to dementia, while others may remain stable and again others may recover. It is thus probable that atrophy underlies the development of depression and psychosis in AD dementia but not in our MCI sample. In this context, the association between elation and volume of the ACC may imply that disturbances in this region other than atrophy are involved in the development of elation independent of MCI or AD dementia. This may support the assumption that psychiatric symptoms are connected not only to atrophy, but also to dysfunction of functional neuronal networks or circuits. Nevertheless, it is possible that the pathology leading to cognitive deterioration contributes to the development of NPS by indirect mechanisms, for instance by interruption of these neuronal circuits. Interestingly, the regions associated with various NPS in our study have been reported to be linked with the default mode network (DMN), dysfunctions of which have been associated with AD dementia, amyloid accumulation, and APOE status (Buckner et al., Reference Buckner2005; Cordova-Palomera et al., Reference Cordova-Palomera2017; Rosenberg et al., Reference Rosenberg, Nowrangi and Lyketsos2015; Westlye et al., Reference Westlye, Lundervold, Rootwelt, Lundervold and Westlye2011). Studies including functional brain imaging methodology are needed to map the associations between functional and structural features in the DMN and their mediating roles in the development of NPS in patients with age-related cognitive impairment and dementia.
In conclusion, while the effect sizes were moderate and showed some divergence between factor-based and item-level analyses, the findings may inform current models of the neuronal correlates of NPS in patients with age-related cognitive disorders and form the basis for the development of more targeted interventions and tools for monitoring NPS in MCI and AD dementia.
Conflict of interest
Dr. Persson reports work with Roche BN29553 outside the submitted work. Dr. Geir Selbæk has received honoraria for participating in a meeting of the Norwegian advisory board for Biogen, regarding the aducanumab trials. Dr. Ole Andreassen is a consultant to HealthLytix. The remaining authors have no conflicts of interest to declare.
Source of funding
The study was funded by the Research Council of Norway (249795, 223273, and 276082), the South-Eastern Norway Regional Health Authority (2014097, 2019107, and 2020086), the European Research Council under the European Union’s Horizon 2020 research and Innovation program (ERC StG Grant 802998), and the Department of Psychology, University of Oslo. This paper represents independent research partly funded by the National Institute for Health Research (NIHR) Biomedical Research Centre at South London and Maudsley NHS Foundation Trust and King’s College London. The views expressed are those of the author(s) and not necessarily those of the NHS, the NIHR, or the Department of Health and Social Care.
Description of author(s)’ role
All authors made substantive contributions to the study, drafted or revised it critically, approved the version to be published, and agreed to be accountable for all aspects of the work. Nikias Siafarikas: idea and design of the study, data collection and supervision, quality control of MRI data, data analysis, manuscript writing; Dag Alnaes: data analysis, manuscript editing. Jennifer Monereo-Sanchez: data collection, quality control of MRI data, manuscript editing; Martina J. Lund: data collection, quality control of MRI data, manuscript editing; Geir Selbaek: idea of the study, study protocol, data collection supervision, manuscript editing; Maria Stylianou-Korsnes: study protocol, data collection supervision, manuscript editing; Karin Persson: data collection, manuscript editing; Maria Lage Barca: data collection, manuscript editing; Ina Selseth Almdahl: data collection, manuscript editing; Tormod Fladby: idea of the study, manuscript editing; Dag Aarsland: idea and design of the study, manuscript editing; Ole A. Andreassen: data collection supervision, manuscript editing; Lars T. Westlye: idea and design of the study, data collection supervision, manuscript editing.
Acknowledgments
We want to acknowledge the Norwegian register of persons assessed for cognitive symptoms (NorCog), for providing access to patient data (and/or caregiver data, and/or biological material).
Supplementary material
To view supplementary material for this article, please visit https://doi.org/10.1017/S1041610221000934.