The development of conduct problems (CPs) in early childhood is one of the strongest predictors of more serious delinquent behaviors at later developmental periods (e.g., Loeber & Dishion, Reference Loeber and Dishion1983). However, few studies have enrolled participants in toddlerhood and then repeated measurement during early childhood through school age, with a focus on the development of more serious forms of antisocial behavior (Aguilar, Sroufe, Egeland, & Carlson, Reference Aguilar, Sroufe, Egeland and Carlson2000; Shaw, Hyde, & Brennan, Reference Shaw, Hyde and Brennan2012). Coercive, harsh, and conflictual parenting practices are a salient risk factor for the development of clinically meaningful CPs (e.g., Odgers et al., Reference Odgers, Moffitt, Broadbent, Dickson, Hancox and Harrington2008; Scaramella & Leve, Reference Scaramella and Leve2004; Shaw, Gilliom, Ingoldsby, & Nagin, Reference Shaw, Gilliom, Ingoldsby and Nagin2003; Waller et al., Reference Waller, Gardner, Hyde, Shaw, Dishion and Wilson2012), and these problem behaviors similarly elicit more harsh parenting from caregivers (e.g., Frick, Cornell, Barry, Bodin, & Dane, Reference Frick, Cornell, Barry, Bodin and Dane2003; Gardner, Ward, Burton, & Wilson, Reference Gardner, Ward, Burton and Wilson2003; Patterson, Reference Patterson1982; Shaw & Bell, Reference Shaw and Bell1993).
Coercive family dynamics are particularly germane to the development of early CPs and more serious forms of later antisocial behavior (Patterson, Reference Patterson1982; Patterson, Reid, & Dishion, Reference Patterson, Reid and Dishion1992). Coercion theory (Patterson, Reference Patterson1982) describes a process of mutual reinforcement during which caregivers inadvertently reinforce children's difficult behaviors, which in turn elicits caregiver negativity, and so on, until the interaction is discontinued when one of the participants “wins.” These cycles may begin when the child reacts with anger or resistance to a caregiver's directive or request, evoking anger and hostility from the caregiver, which is often intensified as the coercive cycle escalates (Snyder, Edwards, McGraw, Kilgore, & Holten, Reference Snyder, Edwards, McGraw, Kilgore and Holten1993). Thus, children learn a pattern of relating within the family that then carries over into interactions with others outside the family, such as peers and teachers in the school setting. When coercive interactions dominate within the family, child CPs emerge and then stabilize throughout development (Granic & Patterson, Reference Granic and Patterson2006).
Coercion theory was unveiled in the context of clinical studies of aggressive school-age children, which emphasized intensive observations in the home over multiple weeks (Patterson, Reference Patterson, Mash, Hamerlynck and Handy1976). Negative reinforcement characterized the structure of the coercion process. As such, parents inadvertently strengthened children's aversive behavior by their cyclical reactions of withdrawal and giving in (Patterson & Cobb, Reference Patterson, Cobb and Hill1971; Patterson & Reid, Reference Patterson, Reid, Neuringer and Michael1970). This pattern was assessed in community samples of youths and found to predict escalations in CPs from middle childhood through adolescence (for a review, see Dishion & Patterson, Reference Dishion, Patterson, Cicchetti and Cohen2006). When the coercion model was applied to intervention studies, it was found that interventions targeting coercive parenting practices prevented escalation of CPs and other problem behaviors (e.g., emotional problems, substance use) one would expect among high-risk youths (Dishion, Patterson, & Kavanagh, Reference Dishion, Patterson, Kavanagh, McCord and Tremblay1992) and within families undergoing divorce and remarriage (Forgatch & Patterson, Reference Forgatch, Patterson, Weisz and Kazdin2010). Despite the appeal and promise of the coercion model for explaining early-onset CPs, few observational studies have systematically linked growth in CPs with dynamic changes in parent–child interactions, especially in early childhood (Martin, Reference Martin1981; Patterson, Reference Patterson, Reid, Patterson and Snyder2002; Scaramella & Leve, Reference Scaramella and Leve2004; Shaw, Keenan, & Vondra, Reference Shaw, Keenan and Vondra1994; Shaw et al., Reference Shaw, Winslow, Owens, Vondra, Cohn and Bell1998).
Patterson (Reference Patterson, Reid, Patterson and Snyder2002) described the transaction that defines the emergence of coercion in early childhood, which is functionally linked to parent–child exchanges of compliance and reactive aggression. Although in early childhood noncompliance and aggression are common, caregivers’ emotional and ineffective reactions can inadvertently lead to increases in conflict that provide fertile ground in which children learn to be generally oppositional. Thus, by preschool age a child may have become openly defiant in a family context in which she or he has learned to “shut off” demands that are unpleasant or unrewarding. The literature suggests that a reciprocal process of reinforcement occurs between children's noncompliance and coercive exchanges with caregivers; noncompliance is met with caregiver responses that trigger a coercive exchange, which then elicits increased noncompliance. Children with more behavioral difficulties seem to elicit parenting from caregivers that is more coercive, controlling, and negative (for a review, see Scaramella & Leve, Reference Scaramella and Leve2004). Patterson (Reference Patterson, Reid, Patterson and Snyder2002) hypothesized that it is the interaction between an infant with behavioral difficulties and a caregiver who is only marginally competent at responding accurately to the child's cues that initially sets the coercive cycle in motion, an idea that was initially tested by Martin (Reference Martin1981) and subsequently twice replicated by Shaw and colleagues: observational procedures revealed that infants with high levels of negative emotionality at 10–12 months in the context of low maternal responsiveness subsequently displayed more coercive interactions at 22–24 months and high levels of child oppositional and/or aggressive behavior between 36 and 42 months (Shaw et al., Reference Shaw, Keenan and Vondra1994, Reference Shaw, Winslow, Owens, Vondra, Cohn and Bell1998).
The interactional pattern between difficult-to-parent children and harsh parenting also has been consistently observed during videotaped interaction tasks. Fagot and Gauvain (Reference Fagot and Gauvain1997) found that more difficult children receive more feedback and directives from caregivers during problem-solving tasks conducted at 18 months of age but that the feedback involved more disapprovals and physical redirections (Gauvain & Fagot, Reference Gauvain and Fagot1995). Although toddlerhood and the preschool years are marked by increased willful noncompliance (Kochanska, Reference Kochanska1995) and aggression (Tremblay et al., Reference Tremblay, Nagin, Séguin, Zoccolillo, Zelazo and Boivin2004), caregivers’ directives naturally decrease during this developmental period (Kuczynski & Kochanska, Reference Kuczynski and Kochanska1990). As expected, children's strong, negative, noncompliant reactions have been found to elicit greater negative responses from caregivers (e.g., Braungart-Rieker, Garwood, & Stifter, Reference Braungart-Rieker, Garwood and Stifter1997; Hartup & van Lieshout, Reference Hartup and van Lieshout1995), which can be a precursor to increased coercive interactions in the home that shape expectations for social interactions in other contexts.
Early Coercion and School Adjustment
Normative socialization is arrested when coercive processes govern children's interactions with caregivers (Coie & Dodge, Reference Coie and Dodge1988; Dishion & Patterson, Reference Dishion, Patterson, Cicchetti and Cohen2006; Patterson, Reference Patterson1982). Arrested development of critical social and academic skills leads to increased exposure to risk processes and decreased exposure to prosocial learning opportunities downstream in early adolescent development. This process, called a developmental cascade, has been well documented with longitudinal data linking childhood CPs with more serious adolescent delinquent behavior (e.g., Dishion, Véronneau, & Myers, Reference Dishion, Véronneau and Myers2010; Dodge et al., Reference Dodge, Malone, Lansford, Miller, Pettit and Bates2009). However, as of this writing, the process in which garden variety noncompliance and aggression in toddlerhood lead to CPs at school age is less well documented. In particular, the question of child versus parenting contributions to the coercion dynamic over time in early childhood remains less understood.
Social interactional theories emphasize early caregiver–child interactions as an important influence on behavior problems at later developmental stages (e.g., Dishion et al., Reference Dishion, Véronneau and Myers2010; Keenan & Shaw, Reference Keenan, Shaw and McCord1995; Patterson, Reference Patterson, Reid, Patterson and Snyder2002; Shaw & Bell, Reference Shaw and Bell1993). Research has demonstrated that coercive, harsh, and overcontrolling parenting during early childhood contributes to adjustment difficulties during elementary school, including CPs (e.g., Campbell, Shaw, & Gilliom, Reference Campbell, Shaw and Gilliom2000; McFadyen-Ketchum, Bates, Dodge, & Pettit, Reference McFadyen-Ketchum, Bates, Dodge and Pettit1996; Shaw, Owens, Giovannelli, & Winslow, Reference Shaw, Owens, Giovannelli and Winslow2001). Of particular importance to our study are the results of the review by Shaw, Bell, and Gilliom (Reference Shaw, Bell and Gilliom2000), who concluded that the quality of the caregiving environment at age 2 significantly predicted clinical-level elevations of CPs reported by caregivers and teachers 6 years later. This relationship might be more salient for children with more difficult to control behaviors (e.g., Shaw et al., Reference Shaw, Keenan and Vondra1994, Reference Shaw, Winslow, Owens, Vondra, Cohn and Bell1998). There is increasing awareness of the deleterious outcomes associated with high levels of mutually coercive exchanges during the second year and persistence into the preschool period (Martin, Reference Martin1981; Shaw et al., Reference Shaw, Keenan and Vondra1994, Reference Shaw, Winslow, Owens, Vondra, Cohn and Bell1998). Instances of mutual negativity are almost inherent during caregiver–child interactions during toddlerhood and preschool. However, higher rates of this interaction pattern, and persistently high levels during early childhood, have been linked to children's problem behaviors at school entry (Dumas & LaFreniere, Reference Dumas and LaFreniere1993; Dumas, LaFreniere, & Serketich, Reference Dumas, LaFreniere and Serketich1995; Patterson, Reference Patterson1982; Patterson et al., Reference Patterson, Reid and Dishion1992).
Aims and Hypotheses
The purpose of this study was to examine the reciprocal influences between observed coercive caregiver–child interactions, caregiver-reported child oppositional/aggressive (OPP/AGG) behaviors, and observed noncompliance across the toddler to preschool period (ages 2–5). The OPP/AGG behaviors included items related to defiance, disobedience, destruction of belongings, and other related indicators. In addition, we examined the relationship between these variables and oppositional and defiant behaviors reported by teachers during the early elementary school years (assessed at ages 7.5 and 8.5). Noncompliance and OPP/AGG behaviors in early childhood are often the precursors to school-age oppositionality, which increases the likelihood of the child's remaining on a developmental trajectory of persistent CPs (e.g., Moffitt, Reference Moffitt1993).
The bidirectional relationship between coercive caregiver–child interaction and young children's OPP/AGG and noncompliant behaviors has rarely been examined during this developmental period, and no studies using dynamic systems methods have been conducted to examine this specific issue during the period from age 2 to age 5. Dynamic systems approaches, which capture the moment-to-moment shifts in the caregiver–child dyad, are the state-of-the-science method for the assessment of coercive processes (Granic & Patterson, Reference Granic and Patterson2006). Specifically, we tested the following hypotheses:
-
1. Although the relationship between coercive interactions and child behaviors are expected to be bidirectional, the path coefficients from coercive interactions to child behavior problems would be relatively stronger than those for the opposing influence of child behaviors on coercive interactions.
-
2. The initial levels and growth in caregiver-reported OPP/AGG, observed noncompliance, and greater duration of observed caregiver–child coercive interactions between ages 2 and 5 would be associated with teacher-reported oppositionality during early elementary school.
-
3. Randomization to the Family Check-Up (FCU) would result in steeper declines in caregiver-reported OPP/AGG behaviors and observed noncompliance during this developmental period. Similarly, participation in the intervention would result in shorter durations of observed caregiver–child coercive interactions at ages 3, 4, and 5, as hypothesized.
Potential moderators
Theory and empirical findings indicate the need to test for gender differences when examining the sequelae of coercive family processes during this developmental period. Having examined the extensive body of literature about early CPs, Patterson (Reference Patterson, Reid, Patterson and Snyder2002) speculated that gender differences contribute to the process by which coercive exchanges shape behavior in early childhood. He posited that males are more likely than females to react negatively to aversive parenting and to experience a “win” as a reinforcer, thus perpetuating coercive interaction patterns. For example, McFadyen-Ketchum and colleagues (Reference McFadyen-Ketchum, Bates, Dodge and Pettit1996) found that coercive interactions with caregivers prior to school entry were predictive of initial levels of CPs for both boys and girls. However, the association of coercion with a trajectory of CPs that followed differed by gender, with boys' CPs being more likely to increase and girls' CPs being more likely to decrease. In addition, Gray and colleagues (Reference Gray, Carter, Briggs-Gowan, Hill, Danis and Keenan2012) found that girls’ observed CPs were sensitive to context, whereas boys' CPs were not, suggesting potential gender differences in the association of early coercive interactions with caregivers and problem behaviors in the school.
We tested ethnic group membership as a potential moderator of coercive family dynamics in early childhood and school-age outcomes by (a) comparing European American families with families from all other ethnic groups in the sample and (b) comparing European American families with African American families. Although coercion theory has a relatively robust empirical grounding, familial contributions to the development of CPs in youths are potentially culturally bound because parents’ socialization strategies are guided by variability in optimal parenting practices that are largely based on a family's cultural values, beliefs, and racial socialization (Dunsmore & Halberstadt, Reference Dunsmore, Halberstadt, Mancini and Roberto2009; Yasui & Dishion, Reference Yasui and Dishion2007). One empirical example is a study by Lansford, Deater-Deckard, Dodge, Bates, and Pettit (Reference Lansford, Deater-Deckard, Dodge, Bates and Pettit2004), who followed 585 children from age 5 to 13 and found that growth in CPs during this period was related to harsh discipline for European American children but not for African American children. Evidence also suggests that coders from dominant racial or cultural groups rate minority families higher on coercion and other negative parenting practices (Yasui & Dishion, Reference Yasui and Dishion2008).
In addition, we tested intervention condition as a potential moderator of the relationship between the variables to ensure that our results were representative of naturally occurring processes. This is particularly relevant when the intervention is found to be effective.
Methods
Participants
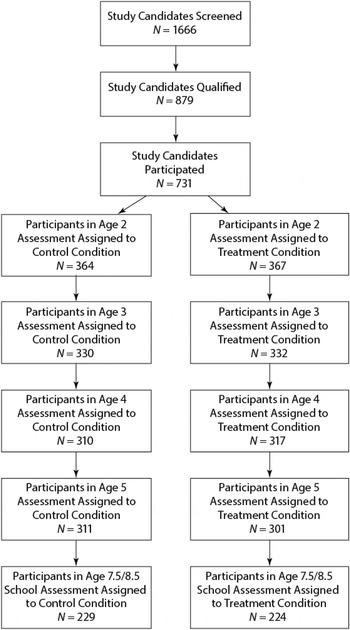
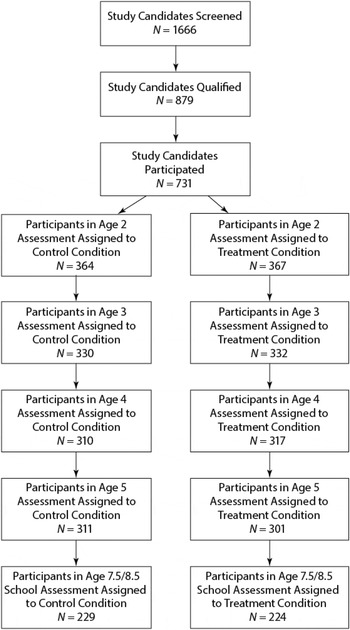
This study examined 731 mother–child dyads (49% female) recruited from the Women, Infants, and Children Nutrition Program (WIC) in three geographically and culturally diverse US regions near Charlottesville, Virginia (188 dyads); Eugene, Oregon (271); and Pittsburgh, Pennsylvania (272), for a randomized trial. Of the 1,666 WIC families with children between ages 2 years, 0 months and 2 years, 11 months screened, 879 indicated socioeconomic, family, or child risk factors for future child behavior problems and were invited to participate in the study. Of the 731 families who consented to participate, 367 were assigned to the FCU condition and 364 families to the control condition, which received WIC services as usual (e.g., vouchers for nutritionally healthful food items). The flow of participants through the recruitment and randomization procedures is shown in Figure 1. The primary caregivers who participated in the assessment tasks were predominantly biological mothers at each age (2: 96%; 3: 95%; 4: 94%; 5: 93%). Biological fathers and grandmothers had the next highest participation. The sample reflects cultural diversity, including African American (27.9%), European American (50.1%), and Latino/Hispanic (13.4%) families.
The participant flow. Participant figures at each age represent the number of originally enrolled families (N = 731) that completed the assessment each year.
Procedures
Home observation assessment protocol
Caregivers (i.e., predominantly mothers and, if available, alternative caregivers, such as fathers or grandmothers) and children who agreed to participate in the study were scheduled for a 2.5-hr home visit. Each assessment began by introducing the child to an assortment of age-appropriate toys and having them play for 15 min while the mother completed questionnaires. For ages 2 and 3, free play was followed by the primary caregiver and child participating in a clean-up task (5 min). Except for children age 2, a delay of gratification task followed (5 min). Next was a set of 3-min teaching tasks (two at age 2, three at age 3, and two at age 5). Then, different inhibition-inducing toys were introduced for 2 min each (two toys at ages 2 and 3 and one at age 5). Last, a meal preparation and lunch task followed (20 min total). Additional tasks were added when an alternate caregiver participated in the study (free play, cleanup, and inhibition). During the home assessments, assessment staff completed ratings of caregiver involvement with and supervision of their child (described in the Measures Section).
The FCU
The FCU is an ecological approach to family intervention and treatment designed to improve children's adjustment across settings (home, school, neighborhood) by motivating positive behavior support and other family management practices (e.g., effective limit setting, parental monitoring) in those settings. The FCU is a second-generation intervention grounded in the Parent Management Training–Oregon Model (Forgatch & Patterson, Reference Forgatch, Patterson, Weisz and Kazdin2010) and designed to be implemented in community settings with the potential for a high public health impact, such as schools. The FCU is a brief, three-session intervention that is individually tailored to the needs of youths and families on the basis of results obtained via an ecological assessment. Typically, the three meetings include an initial contact session, a home-based multiple-informant ecological observational assessment session, and a feedback session (Dishion & Stormshak, Reference Dishion and Stormshak2007). Feedback emphasizes parenting and family strengths yet draws attention to possible areas of change. One goal of the FCU feedback session is to enhance the family's motivation to change by using collaborative, therapeutic techniques based on motivational interviewing, such as promoting change talk and fostering motivation to address key problems in parenting. The Everyday Parenting curriculum (Dishion, Stormshak, & Kavanagh, Reference Dishion, Stormshak and Kavanagh2011) was used for subsequent intervention sessions aimed at family management. Research has indicated that participation in the FCU leads to reductions in problem behaviors during the preschool years (e.g., Dishion et al., Reference Dishion, Shaw, Connell, Gardner, Weaver and Wilson2008, in press; Gardner, Shaw, Dishion, Burton, & Supplee, Reference Gardner, Shaw, Dishion, Burton and Supplee2007). Therapists in this randomized trial were found to have delivered the FCU with adequate fidelity, which was related to improvements in parenting and subsequent changes in children's problem behaviors between ages 2 and 4 (Smith, Dishion, Shaw, & Wilson, Reference Smith, Dishion, Shaw and Wilson2013).
Measures
Dyadic coercive interactions
The videotaped interaction tasks involving the child and the primary caregiver were coded using the Relationship Affect Coding System (RACS; Peterson, Winter, Jabson, & Dishion, Reference Peterson, Winter, Jabson and Dishion2009). RACS is a dynamic systems measurement method consisting of three continuous streams of parallel behavior: verbal, physical, and affect. Verbal codes comprise positive, neutral, and negative talk and include verbal behavior change codes, such as positive structuring, neutral, and negative directives. Physical behaviors (e.g., handing each other objects, hugging) are coded as positive, neutral, and negative. Affect codes include anger/disgust, distress, ignoring, validation, and positive affect. The “off” codes of no talk, no physical, and neutral affect are used when the other codes in the verbal, physical behavior, or affect streams are not observed. The RACS coding was recorded using Noldus Observer XT, Version 11.0 (Noldus Information Technology, 2012), which allows for continuous coding of an interaction of child and caregiver simultaneously. Using this approach, it is possible to calculate durations and frequencies of behavior clusters for each family member and, even more essentially, the interaction dynamic between family members.
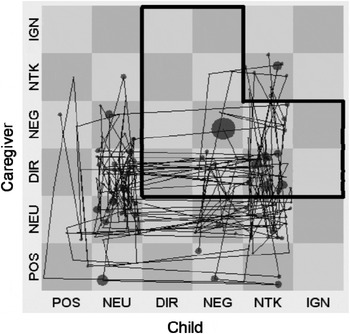
Addressing the complexity of three parallel behavior streams for two people necessitated further manipulation of the data streams. First, the verbal, physical, and affect streams were combined to create six behavior clusters (positive engagement, neutral engagement, no talk, directives, negative engagement, and ignore) that compose a state-space grid with one person on each axis (caregiver on the y axis and child on the x axis in Figure 2). A set of priority rules was formed from the three parallel streams. For instance, if the caregiver smiled and at the same time was observed saying something negative to the child, the negative verbal code trumped the smile (a positive affect code), and the caregiver's behavior was classified as within the negative engagement cluster, which is labeled NEG in Figure 2. The end result enables one to analyze and identify dyadic interaction patterns that can be graphed on a state-space grid (Hollenstein, Reference Hollenstein2007; Lewis, Reference Lewis2000). State-space grids have previously been adapted for the study of caregiver–child interactions and their relationship to child psychopathology (e.g., Granic, Hollenstein, Dishion, & Patterson, Reference Granic, Hollenstein, Dishion and Patterson2003; Hollenstein, Granic, Stoolmiller, & Snyder, Reference Hollenstein, Granic, Stoolmiller and Snyder2004). For a review of the development of antisocial behavior from a dynamic systems perspective, see Granic and Patterson (Reference Granic and Patterson2006).
Dyadic coercive interactions region on the state-space grid. Dyadic coerce region outlined in black. Lines within the grid indicate transitions between regions. The larger the circle, the longer the duration of time the dyad spent in the region. POS, postive engagement; NEU, neutral engagement; DIR, directive; NEG, negative engagement; NTK, no talk; IGN, ignore.
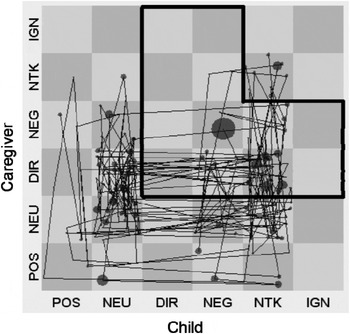
We then identified dyadic regions of the grid representing distinct and meaningful behavior patterns. In this study, dyadic coerce (i.e., mutually coercive behaviors between the caregiver and the child) was defined as either participant being negatively engaged (NEG) or directive (DIR), while the other member of the dyad responds by not talking (NTK), ignoring (IGN), NEG, or DIR. This region thus comprises 12 cells from the 36 total possible cells of the complete matrix, represented by the black outlined area in Figure 2. We then calculated the total duration of observed caregiver–child dyadic interactions in this region and divided that time by the overall session time to get a duration proportion score. Reliability coefficients were in the “good” to “excellent” range, with overall kappa scores of 0.93 at each age and percent agreement of 93, 94, 93, and 94 at ages 2, 3, 4, and 5, respectively. Kappa coefficients were obtained from Noldus Observer. The kappas are computed based on the duration and sequencing of coded behavior. Only interaction tasks (the teaching, inhibition, and meal tasks) administered at the home assessments across all four ages were included in the analysis.
Observed child noncompliance
During the home assessments, assessment staff completed macroratings of the child's compliance with parent directives. Child noncompliance with the primary caregiver was measured using the following three items from the Coder Impressions Inventory (Dishion, Hogansen, Winter, & Jabson, Reference Dishion, Hogansen, Winter and Jabson2004): (a) is the child compliant and cooperative with the caregiver's directives and requests? (reverse scored); (b) does the child seem dysregulated and difficult to manage, unable to control his/her behavior and emotions?; and (c) a rating of the overall quality of the child's compliance. The first two items were rated on a 9-point Likert scale (1 = not at all, 5 = somewhat, 9 = very much). To assess overall compliance (Item 3), raters selected one of the following options: committed compliance, situational compliance, passive compliance, refusal/negotiation, and defiance. Items were z scored prior to creating a composite because they were rated using different scales. The z scores were initially calculated for each age, resulting in a mean score of 0 at each assessment point. To accurately estimate a growth curve in subsequent analyses, z scores were recomputed across ages 2–5 to derive meaningful mean values from which a slope could be estimated. Internal consistencies (Cronbach α) for ages 2, 3, 4, and 5 were 0.86, 0.84, 0.84, and 0.86, respectively. Average interrater agreement was high at each age, ranging from 87% to 88% agreement.
Child OPP/AGG behavior
We created a measure of child OPP/AGG behavior from the Child Behavior Checklist for Ages 1.5–5 (CBCL; Achenbach & Rescorla, Reference Achenbach and Rescorla2001). The CBCL is an empirically validated measure of child behavior problems administered to primary caregivers at each assessment. Caregivers are asked to rate the validity of several statements regarding potential child behaviors by using a 3-point Likert scale in which 0 = not true, 1 = somewhat, sometimes true, and 2 = very true, often true. To generate a factor of OPP/AGG behavior that was both developmentally meaningful in the age 2–5 period and clinically relevant, individual items that were continuously present on the CBCL across ages 2, 3, 4, and 5 were chosen that mapped onto DSM-IV criteria for oppositional defiant disorder and conduct disorder, including their aggressive hallmarks (labeled as OPP/AGG for simplicity, eight items). A composite variable was computed by averaging the values for these items at each assessment age. Internal consistencies for the OPP/AGG scale were acceptable at each age (0.71, 0.75, 0.83, and 0.80 for ages 2, 3, 4, and 5, respectively).
Child oppositional behavior at school (ages 7.5 and 8.5)
Teacher-reported oppositional behavior in the classroom was assessed using the DSM-oriented Oppositional Defiant Problems Scale from the Teacher Report Form (Achenbach & Rescorla, Reference Achenbach and Rescorla2001) version of the CBCL. The Teacher Report Form is a well-validated measure of child problem behavior and was administered to the primary teacher of study participants at age 7.5 and age 8.5. Internal consistencies of 0.90 and 0.92 were obtained for the five-item scale at ages 7.5 and 8.5, respectively. Because of high levels of missing teacher reports (43% available at age 7.5, 52% available at age 8.5), either report was used as the outcome when only 1 year was available. A mean of the two scores was used when data were available at both time points. This approach yielded 453 available cases (62%). We used T scores in the final analysis.
Data analytic strategy
To address our hypotheses and simultaneously illuminate the developmental trajectories and processes involved in early coercive family interactions and child CPs, we first used an iterative approach to construct a model in a structural equation modeling framework. When conducting longitudinal inquiries in which the modeling of individual trajectories of change and the longitudinal prediction of one variable from another are of interest, a hybrid model combining latent trajectory (i.e., latent growth curve [LGC]) and cross-lagged modeling strategies is indicated. This modeling approach is a variant of the parallel process latent growth model and the autoregressive latent trajectory model described by Curran and Bollen (e.g., Bollen & Curran, Reference Bollen and Curran2004; Curran & Bollen, Reference Curran, Bollen, Collins and Sayer2001) and others. The LGC and cross-lagged modeling approaches have a long history in the developmental literature and have unique strengths and weaknesses in situations in which relationships between variables over time are proposed. They are often cast as competing means of analyzing longitudinal data (see Collins, Reference Collins2006), yet each grants primacy to certain longitudinal influences: cross-lagged models favor fixed and lagged effects, whereas latent trajectories focus on individual differences in change over time. The patent advantage of a hybrid model synthesizing latent trajectory and cross-lagged models is the simultaneous examination of the time-specific relationships between multiple variables (i.e., cross-lag) with their individual developmental trajectories. This approach sacrifices fixed effects in favor of the individual trajectories. Our modeling approach examined the relationship between observed caregiver–child coercive interactions at ages 2, 3, 4, and 5 with the latent trajectories of caregiver-rated child OPP/AGG behavior and observed child noncompliance at identical time points.
To address our first research question, we used a series of deviance tests to compare the relative strength of the association between the child behavior variables and coercive interactions. That is, we compared whether there was a significant difference between the two directions of the cross lags: one way going from coercive interactions to the child behavior and the other way from the child behavior to coercive interactions. A freely estimated model was compared with a model in which these paths were constrained to be equal. A significant decrement in model fit after imposing these constraints indicates that there are differences in the relative strengths of the associations by direction. This was done for each child behavior variable. We then conducted a deviance test of the overall model to test relative differences across the two indicators, which would be less susceptible to the potential bias of caregiver report and reduce any monomethod bias of the two observed variables (child noncompliance and coercive interactions).
Second, in addition to revealing the developmental course of, and relationship between, coercive interactions, caregiver-reported child OPP/AGG, and observed child noncompliance, we sought to examine whether the relationship of these early indicators was significantly predictive of teacher-reported oppositional behaviors in the school arena. Following the approach advocated by MacKinnon, Lockwood, Hoffman, West, and Sheets (Reference MacKinnon, Lockwood, Hoffman, West and Sheets2002), we examined indirect effects by testing the joint significance of the paths leading from the predictor through other variables to the outcome, also known as an intervening effect. The Model Indirect command in Mplus was used to test for significant indirect effects from the three age-2 variables to the teacher-reported CPs. We then tested for intervention effects per our third research question by using the intention-to-treat (ITT) analytic approach for randomized trials.
Third, we tested for the possible moderating effects of gender, ethnicity, and treatment group on the model by using a multiple-group analysis approach that compared fit indices of unconstrained and constrained models. We did not posit a specific direction of the moderating variables but expected potential racial and gender differences in teacher reported oppositional behaviors, given previous research (Fagot & Leve, Reference Fagot and Leve1998; Youngstrom, Loeber, & Stouthamer-Loeber, Reference Youngstrom, Loeber and Stouthamer-Loeber2000). Fourth, we conducted the analyses for the nonintervention subsample as well to compare results of the full sample. This additional step was intended to increase confidence in the generalizability of the findings.
Path modeling was conducted in Mplus 7.0 (Muthén & Muthén, Reference Muthén and Muthén2013). To include the full randomized sample in the analysis, we used maximum likelihood estimation with robust standard errors, which has been shown to provide unbiased estimates when data are missing at random or missing completely at random (MCAR; Little & Rubin, Reference Little and Rubin2002). Maximum likelihood estimation also provides more valid estimates when dependent variables are nonnormally distributed. There was some degree of missing data in our sample (see Table 1 for valid total numbers of each variable), but the data were MCAR (Little's Reference Little1988 MCAR test), χ2 (423) = 436.21, ns, so the missing data did not introduce bias into the analyses. The alpha was set to 0.05.
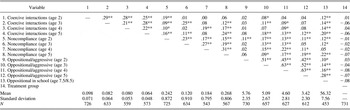
Intercorrelations between study variables
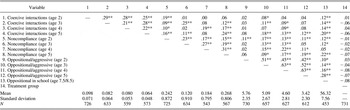
*p < .05. **p < .01.
Results
Intercorrelations among variables in this study are provided in Table 1, along with means and standard deviations and the number of available observations. The duration of time caregivers and children spent in coercive interaction during the home assessment tasks declined over time from age 2 to age 5. Primary caregivers’ ratings of child OPP/AGG and the observer ratings of noncompliance similarly declined between ages 2 and 5. Examination of the correlations revealed that relationships between variables were largely in the expected direction. Coercive interactions were significantly and modestly intercorrelated among the three measurements (r = .21–.29; α = 0.05). Intercorrelations among observed noncompliance (r = .15–.31) and caregiver-reported OPP/AGG (r = .45–.63) were similarly significant. These three variables were somewhat correlated within ages and across ages, but the relationships were not consistently significant. With the exception of noncompliance assessed at age 4 (r = .05), all other predictor variables were significantly correlated with teacher-reported oppositional behaviors at school (r = .10–.28).
Building the model
The first step in our model-building process was to examine the fit of the two LGCs in our sample. Model fit for all analyses was examined using the chi-square statistic, comparative fit index (CFI; Bentler, Reference Bentler1990), and root mean square error of approximation (RMSEA; Steiger, Reference Steiger1990). Chi-square statistics measure the amount of discrepancy between the unrestricted sample covariance matrix and the restricted covariance matrix. Small chi-squares correspond to better fit to the data. CFI provides a measure of complete covariation of a hypothesized model with the independent model. Values greater than 0.95 indicate good fit to the data (Bentler, Reference Bentler1992). RMSEA values less than 0.05 indicate good model fit, and values up to 0.08 represent reasonable errors of approximation (Browne & Cudeck, Reference Browne, Cudeck, Bollen and Long1993). Standardized root mean square residual (SRMR) is an index of absolute model fit defined as the standardized difference between the observed and predicted correlation. Values less than 0.08 are generally considered good fit (Hu & Bentler, Reference Hu and Bentler1999).
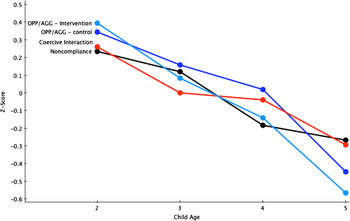
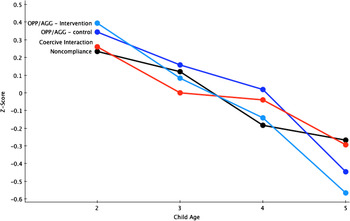
The unconditional LGC of caregiver-reported OPP/AGG was found to be a better fit to a quadratic effect, χ2 (1) = 9.44, CFI = 0.988, RMSEA = 0.107, SRMR = 0.020, than to a linear effect, χ2 (5) = 76.15, CFI = 0.900, RMSEA = 0.140, SRMR = 0.063. A linear effect was the best fit for the LGC of observed noncompliance, χ2 (5) = 9.59, CFI = 0.960, RMSEA = 0.035, SRMR = 0.033. When included in the same model, the two curves provided acceptable fit to the data for the purposes of model building, χ2 (16) = 36.42, CFI = 0.979, RMSEA = 0.042, SRMR = 0.053. Slope estimates of OPP/AGG (linear = −0.361, quadratic = −0.136) indicate a downward trajectory that becomes steeper over time. The LGC of noncompliance had a significant downward linear trend (−0.179). The slope and quadratic parameters of both curves were significantly different from zero (p values < .05). Figure 3 illustrates the trajectories of observed child noncompliance, OPP/AGG (caregiver reported), and coercive interactions between ages 2 and 5.
(Color online) Trajectories of child noncompliance, caregiver-reported child oppositional and aggressive behaviors, and caregiver–child coercive interactions. OPP/AGG, caregiver-reported oppositional and aggressive behavior on the Child Behavior Checklist. We created Z scores for each variable by using the mean of the four time points (ages 2–5). There was a significant intervention effect on the slope of OPP/AGG, which is why it is presented separately for the intervention and control groups.
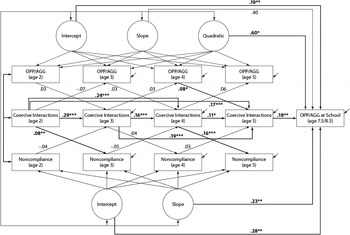
In the second step we examined fit when including observed coercive interactions in a cross-lagged model with each of the growth curves independently. Fit statistics were adequate for the purposes of model building, OPP/AGG: χ2 (4) = 8.08, CFI = 0.996, RMSEA = 0.037, SRMR = 0.016; noncompliance: χ2 (9) = 11.78, CFI = 0.992, RMSEA = 0.021, SRMR = 0.022, so we proceeded to include both LGCs in a model with observed coercive interactions in a cross-lagged fashion with both curves. The measurements of OPP/AGG and noncompliance within each growth curve were correlated with the respective measures of coercive interactions but not with each other, because the slopes and intercepts of the growth curves were allowed to correlate. The resultant fit statistics indicated good fit to the data, χ2 (23) = 37.10, CFI = 0.989, RMSEA = 0.029, SRMR = 0.023, and we added the outcome variable of teacher-reported child oppositional behaviors at school. Model fit was significantly improved by including additional paths between coercive interactions at age 2 to ages 4 and 5 directly, as well as age 3 to age 5 directly. These paths were used in each model that included coercive interactions.
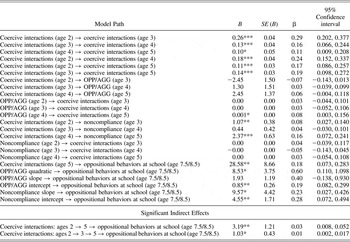
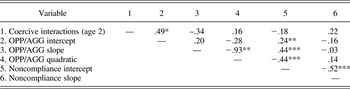
Analysis of the final model presented in Figure 4 began with an examination of fit. With adequate model fit, χ2 (29) = 46.15, CFI = 0.987, RMSEA = 0.028, SRMR = 0.026, we proceeded by examining the results of the path model. The path coefficients for the model in Figure 4 are provided in Table 2. Table 3 provides the correlations estimated by Mplus between the slopes and intercepts of the growth curves, which were allowed to correlate with one another and with coercive interactions at age 2. Stability coefficients indicated a significant relationship between successive observations of coercive interactions, despite the overall decline in mean levels of coercion between ages 2 and 5. Direct paths from coercive interactions at age 2 to age 4 and age 5, and age 3 to age 5, were also significant. The path from age 4 OPP/AGG to age 5 coercive interactions was significant. Age 2 and age 4 coercive interactions significantly predicted subsequent noncompliance at ages 3 and 5, respectively.
The path model. OPP/AGG, caregiver-reported oppositional and aggressive behavior on the Child Behavior Checklist. Bold paths are significant at p < .05. Correlations between variables measured within age are not shown in the figure for readability.

Results of path analysis
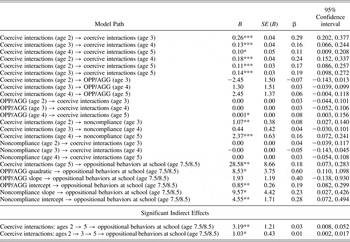
Note: The effect is considered significant if the 95% confidence interval does not contain zero. OPP/AGG, oppositional/aggressive.
*p < .05. **p < .01. ***p < .001.
Estimated standardized correlations between observed coercive interactions at age 2 and slopes and intercepts of latent growth curves

Note: OPP/AGG, oppositional/aggressive.
*p < .05. **p < .01. ***p < .001.
Relative strength of the associations
We first determined the average strength of the association for each cross-lag direction by constraining them to be equal, one direction at a time. This model includes four directions of cross-lagged relationships: OPP/AGG → Coercive interactions (mean β = 0.05); Coercive interactions → OPP/AGG (β = 0.00); Noncompliance → Coercive interactions (β = 0.00); Coercive interactions → Noncompliance (β = 0.07). Deviance tests resulted in significant differences in the relative strength of the relationships between child problem behaviors and coercive interactions in all three ways tested: (a) paths from OPP/AGG to coercion are relatively stronger compared with the other direction; (b) paths from coercive interactions to noncompliance are relatively stronger; and (c) paths from coercive interactions to the child behavior variables (β = 0.033), measured simultaneously, are relatively stronger than the opposing relationship (β = 0.027).
Predicting school-age oppositional behaviors
Concerning the association between study variables and children's oppositional behavior in school as reported by teachers, coercive interactions at age 5 were a significant predictor. A significant indirect effect was found from age 2 coercive interactions through subsequent assessments of coercion (age 2 to age 5 and age 2 to age 3 to age 5; see Table 2). The 95% confidence intervals of these adjacent paths do not contain 0 and are thus considered significant indirect effects (MacKinnon et al., Reference MacKinnon, Lockwood, Hoffman, West and Sheets2002). The slope and intercept of the noncompliance LGC was significantly related to the outcome, such that greater initial levels of observed noncompliance and less steep declines over time predicted greater oppositional behaviors in the classroom. The intercept of the OPP/AGG LGC was similarly related to later behavior problems in school. The quadratic term of OPP/AGG was significant. The final model accounted for a significant amount of the variance in the outcome (R 2 = .18, SE = 0.047, p < .001).
Intervention effects
We tested for intervention effects by using an ITT analytic framework of randomized group assignment. The intervention condition was regressed on the slope of each LGC, the quadratic term of the OPP/AGG LGC, teacher-reported oppositional behaviors, and coercive interactions at ages 3, 4, and 5. Assignment to the FCU was associated with steeper declines in parent report of OPP/AGG from age 2 through 5, compared with control group outcomes (B = −0.12, SE = 0.04, β = −0.08, p < .05). Figure 3 illustrates this significant difference in the decline of OPP/AGG by including the slope of the intervention and control groups separately: After beginning at similar levels, the intervention group falls below the control group at age 3, and the difference widens at age 4 and remains even wider at age 5. No significant effects were found on coercive interactions.
Moderation
Multiple potential moderating variables were tested using a step-wise multiple-groups analysis approach. We tested for differences in the structural covariance of the model based on gender, ethnic group membership, and intervention group assignment by using a chi-square deviance test, which compares the fit of two groups when paths are freely estimated and when they are constrained to be equal across groups. Constraining the paths to be equal across the groups did not result in a significant decrement in model fit, as evidenced by the chi-square deviance test, when comparing males and females, intervention group assignment, European American and nonmajority group membership, and European American and African American families, indicating that the relationship between the paths in the model did not significantly differ across the groups tested.
Analysis of nonintervention group
In addition to tests of moderation by intervention group assignment, we also ran the model using only families in the control group to further ensure that the intervention did not significantly alter the key findings in this study. Overall, the results were analogous to those found for the full sample, as evidenced by the directionality and relative strength of the relationships between the variables. However, the test yielded fewer statistically significant paths, which was likely due to power issues (N = 364). It is important that the model provided good fit to the data, χ2 (29) = 44.98, CFI = 0.979, RMSEA = 0.039, SRMR = 0.034, and accounted for a similar degree of variance in teacher-reported oppositionality (R 2 = .24, SE = 0.077, p < .01) compared to the full model (R 2 = .18, SE = 0.047, p < .001). Teacher-reported oppositionality was found to be significantly associated with the slope (B = 11.97, SE = 5.34, β = 0.35, p < .05) and intercept (B = 7.34, SE = 3.49, β = 0.51, p < .05) of the noncompliance LGC and the indirect effect of coercion from age 2 to age 5 (B = 3.81, SE = 2.01, β = 0.03, p = .058). The intercept and quadratic parameters of the OPP/AGG LCG were again strongly associated with school-age oppositionality but were not statistically significant (p > .05) as they had been in the full sample: intercept (B = 0.90, SE = 1.06, β = 0.20) quadratic (B = 5.10, SE = 7.08, β = 0.32). In terms of the relative strength of the relationship between coercive family interactions and child behaviors, the former was similarly found to be significantly stronger in this analysis (β = 0.045, β = 0.022).
Discussion
A number of theoretical models hypothesize and have found support for a relationship between children's behavioral characteristics and coercive interactions with caregivers during early childhood. Higher levels of oppositional and aggressive behavior in toddlerhood appear to reliably predict CPs and other deleterious outcomes at subsequent developmental periods (e.g., Loeber & Farrington, Reference Loeber and Farrington2000; Shaw & Gross, Reference Shaw, Gross and Lieberman2008), as does a preponderance of coercive interactions (e.g., Dishion & Patterson, Reference Dishion, Patterson, Cicchetti and Cohen2006; Keenan & Shaw, Reference Keenan, Shaw and McCord1995; Patterson, Reference Patterson1982). However, studies with rigorous measurement during early childhood have been lacking in the literature (Patterson, Reference Patterson, Reid, Patterson and Snyder2002; Scaramella & Leve, Reference Scaramella and Leve2004). It is essential to observationally assess caregiver–child coercive interactions given the problems associated with using caregiver report to assess these dynamics (Dishion & Patterson, Reference Dishion and Patterson1999). In our study, coercive interactions were rigorously assessed by using a sophisticated, relational observational coding procedure and state-of-the-science dynamic systems measurement methods at four time points. Inclusion of observed (noncompliance) and caregiver-reported symptoms of CPs at four time points, measured yearly by trained coders, addressed the weaknesses of previous empirical examinations of coercion during this developmental period and strengthened the conclusions of our study. The link between coercive family interactions and later child outcomes is well established (e.g., Dishion & Patterson, Reference Dishion, Patterson, Cicchetti and Cohen2006; Shaw et al., Reference Shaw, Gilliom, Ingoldsby and Nagin2003); it is the mutual influences of coercion and child behaviors over time that begs for further inquiry.
In this study, we sought to address the limitations just noted. We tested three specific hypotheses. First, we predicted that the paths from coercive interactions to child behavior problems would be relatively stronger than the opposing influence of child behaviors on coercive interactions. This hypothesis was supported: coercive interactions had a relatively stronger relationship to child behaviors in the following years, suggesting that coercive interactions between children and caregivers drive escalations in child oppositional and aggressive behavior as well as noncompliance. Although this pattern of findings might be partially accounted for by measurement method (i.e., stronger relations were found between observed noncompliance and coercive caregiver–child interactions than between parent-reported child OPP/AGG and observed coercion), this finding contrasts with Patterson's (Reference Patterson, Reid, Patterson and Snyder2002) prediction that children's noncompliance and oppositional behaviors perpetuated coercive cycles in early childhood.
Our second hypothesis, that teacher-reported oppositional behaviors during early elementary school would be significantly associated with initial levels and growth over time in caregiver-reported OPP/AGG and observed noncompliance, was supported. Higher initial levels (i.e., intercept of the LGCs) of both factors were related to more CPs in early elementary school. A less steep decline in the slope of noncompliance was also associated with higher teacher ratings. The same pattern was found for the slope parameter of caregiver-reported OPP/AGG LGC, but it was nonsignificant. The quadratic function of OPP/AGG was significant, suggesting that children who remain more oppositional and aggressive across the preschool years are likely to be rated as oppositional in elementary school. Caregiver–child coercive interactions, beginning at age 2, were also predictive of school-age oppositional behaviors. Coercion was relatively stable from year to year during the developmental period between ages 2 and 5, and this indirect effect was related to oppositionality in school. The strongest effect was found for the direct path from age 2 to age 5 and then to CPs in school, further suggesting that higher rates of early coercion that persist are a primary process by which CPs develop in childhood. This finding is consistent with findings from previous research (e.g., Shaw et al., Reference Shaw, Winslow, Owens, Vondra, Cohn and Bell1998, Reference Shaw, Owens, Giovannelli and Winslow2001).
Taken together, these results paint a clearer picture of the relationship between children's behaviors, coercion dynamics, and children's oppositionality in the school context. As children become increasingly mobile and the potential grows for noncompliance and aggression to occur in response to caregiver directives, the duration of coercive interactions hits its peak. Although noncompliant and aggressive child behaviors are likely to increase the potential for engaging in coercive exchanges (Patterson, Reference Patterson1982), early coercive exchanges appear to be the prominent amplifying factor in the developmental trajectory of CPs from early childhood to school age. Coercion and child CPs typically decline during this period; when CPs persist, children are more likely to display CPs in the classroom. High levels of coercive interactions in the home increase the likelihood that teachers experience similar behaviors in the classroom. Similarly, teachers likely observe the child engaging in coercive exchanges in the classroom with peers. Coercive interactions and CPs in the classroom often result in the child's being rejected by prosocial peers, and he or she starts down a negative developmental trajectory toward later antisocial problems (e.g., Dishion et al., Reference Dishion, Véronneau and Myers2010; Dodge et al., Reference Dodge, Malone, Lansford, Miller, Pettit and Bates2009). Aggression, noncompliance, and other child behaviors undoubtedly contribute to the developmental cascade, yet our study results strongly indicate that coercive processes play an important amplifying role in this process. These results held for children of both genders and families of diverse racial and ethnic backgrounds.
Intervention effects and clinical implications
With the collective empirical evidence of the role of coercive family dynamics in the development of youth problem behaviors and related outcomes, it is not surprising that a number of family-based treatments target coercive dynamics. However, because this was a prevention trial, many of the families in this sample who participated in the intervention services were not engaged in coercive interactions and their young children were not demonstrating clinically elevated levels of CPs. In fact, previous research with this sample revealed intervention effects to be most pronounced in families whose children demonstrated clinically elevated oppositional behavior at age 2 (Dishion et al., Reference Dishion, Shaw, Connell, Gardner, Weaver and Wilson2008). Although some family-based interventions have achieved reductions in coercive family interactions (e.g., Conduct Problems Prevention Research Group, 1999; Reid, Eddy, Fetrow, & Stoolmiller, Reference Reid, Eddy, Fetrow and Stoolmiller1999), our analyses indicate that coercion was only moderately reduced in the intervention group at one time point (age 3), despite the longer term effects on oppositional behavior at home and in the school (Dishion et al., Reference Dishion, Brennan, Shaw, McEachern, Wilson and Jo2014). We hypothesize that increasing levels of positive behavior support in parents has an independent effect on the salience of coercive conflict in the home, providing the conditions under which children learn more positive behaviors and coping strategies. Regardless, the randomized intervention did not seem to alter the relationship between coercion dynamics and child behaviors tested in the overall model, as the results held in both the control and intervention groups.
Another study involving the same sample focused more intensively on the families with children who displayed clinically elevated oppositional behavior at age 2 and on changes in coercion dynamics as a function of the FCU (Smith, Dishion, Moore, Shaw, & Wilson, Reference Smith, Dishion, Moore, Shaw and Wilson2013). One important aspect of coercion is that it involves emotionally driven interaction dynamics that are often attributable to overlearned patterns of behavior and therefore difficult to control and regulate. Changing these parenting dynamics requires more direct feedback and training. Video feedback procedures are one particularly relevant therapeutic technique. This technique and its potential mechanism of action have been found to reduce caregivers’ coercive behaviors with their young children during the preschool years (Smith et al., Reference Smith, Dishion, Moore, Shaw and Wilson2013). Therapists’ behaviors and techniques were examined during the FCU assessment feedback session of a clinical subsample (N = 79) of the participants in this study. We found that the inclusion of video feedback procedures during the age 2 FCU, which consists of showing caregivers brief videotaped clips of desirable interactions with their children (i.e., the FCU's ecological assessment) to reinforce positive parenting practices, reduced caregivers’ negative schemas of their child. This in turn was found to be an intervening variable in reducing coercive parenting behaviors 3 years later (age 5). This finding is consistent with a complementary study finding that more negative caregiver relational schemas about the child predict a less steep decline in observed coercive interactions during early childhood (Smith, Dishion, Shaw, & Wilson, Reference Smith, Dishion, Shaw and Wilson2014). As such, interventions ought to target the underlying parental beliefs and schemas that govern and maintain coercive patterns of responding to and interacting with their child. The lack of intervention effect on coercion in our study notwithstanding, results clearly indicate that the FCU has an effect on children's CPs during this period, which most likely occurs by improving family management strategies, such as positive behavior support (Dishion et al., Reference Dishion, Shaw, Connell, Gardner, Weaver and Wilson2008). The Smith et al. (Reference Smith, Dishion, Moore, Shaw and Wilson2013) study also measured coercion differently and focused on caregivers’ negative engagement and directives, not the mutual or dyadic coercive interactions examined in this study.
The link between early coercion in the family and later behavior problems in the school context has implications for the prevention of school bullying. Teacher reports of child behaviors at school are likely based, at least in part, on their observations of the child engaging in aggressive and coercive interactions with peers. Following a developmental cascade framework, early family-based intervention targeting coercive dynamics is a sensible strategy. Interventions such as the FCU, in conjunction with evidence-based programs embedded in schools (e.g., Olweus & Limber, Reference Olweus and Limber2010), would likely reduce the substantial prevalence rates of school bullying (Stassen Berger, Reference Stassen Berger2007). This multidimensional prevention strategy might be more effective than school-based programs alone given the strong familial influences on aggressive behavior.
Limitations
Despite numerous strengths of this study, some limitations and caveats must be mentioned. First, the sample represents a low-income group of mothers and children, which limits the generalizability of our findings to families with fewer economic and contextual risk factors. The developmental correlates of early coercive processes are likely to be most prominent in high-risk families in which caregivers are under greater stress and have fewer resources, such as those with mental health and substance use issues and single and teen parents. However, socialization processes are salient in all families, suggesting that our findings are likely to hold in a representative sample as well.
Second, intervention effects of this study may be underestimated in that a highly conservative ITT approach was used, which does not account for families’ engagement status (i.e., receipt of the FCU) and instead treats assignment to the intervention condition equally regardless of whether the family engaged in the FCU. For this reason, prevention scientists have begun to use analytic approaches that account for engager status, such as complier average causal effect models (Jo, Reference Jo2002). Complier average causal effect models could not be used to analyze the intervention effects of this study's complex modeling approach, because it is limited to evaluating a single longitudinal outcome and does not allow for examination of the relationship between variables.
Along similar lines, the context of this study, a randomized intervention trial, is a potential limitation for examining naturally occurring developmental processes. Perhaps due to a lack of robust intervention effects on coercive dynamics, the results of analyses using the full sample were sustained by analyses of the control group only. This additional element of the study increases our confidence that the relationships reported in this study are representative of typical developmental processes. No moderation by intervention condition provides further support for this contention.
Third, one of the aims of this study was to determine the relationship between coercive interactions and child behaviors, which has largely been the dominion of social learning theorists (e.g., Patterson, Reference Patterson1982). Because coercive interactions emerge in toddlerhood when caregivers begin to use directives to maintain the child's safety as mobility increases, it is not feasible to assess this variable much earlier than was done in this study. However, earlier indicators of the child's behavioral and interpersonal characteristics, such as temperament, attachment, and inhibitory control, could prove to be important covariates or moderators of the mutual influences explored in this study. Similarly, genetic factors and neuropsychological indicators could be included in future research, which is consistent with some prominent developmental models (Cicchetti, Reference Cicchetti1993; Moffitt, Reference Moffitt, Tonry and Morris1990; Scaramella & Leve, Reference Scaramella and Leve2004).
Fourth, combining LGC and cross-lag models allowed us to address our hypotheses. However, one drawback of the type of parallel process growth model we selected is that, unlike a traditional cross-lag analysis, the prediction of noncompliance and OPP/AGG from prior levels of dyadic coercion cannot be said to be above the stability of that variable because of the lack of direct paths between measurements of these variables (i.e., stability paths). The stability paths are essentially sacrificed to estimate the LGCs, which allow for greater flexibility to assess separate trajectories with unique time trends because the traditional cross-lag model with autoregressive parameters does not incorporate the specific random components underlying the trajectory of the child behaviors (Bollen & Curran, Reference Bollen and Curran2004). Autoregressive latent trajectory models might be a comparable alternative, but generally they can be used to examine the longitudinal relationship between only two variables of interest and not three.
Fifth, the measurement of each variable in this analysis could have contributed to our findings. Observers rated coercive dynamics and child noncompliance using the same interaction tasks, which as noted previously, could have led to monomethod bias in the final analysis. However, correlating these variables at each time point reduced this biasing effect. On a similar note, we used caregiver-reported OPP/AGG behaviors, which are subject to a number of potentially biasing effects, such as demand characteristics, intentional and unintentional over- or underreporting because of caregiver factors (e.g., depression, dismissing attachment), and a more subjective perspective of their child. Teacher reports also had a moderate degree of missing data (38%). Although it is a strength of the study to include multiple raters and methods of assessment, predicting an observed interaction pattern with another observed variable could have made it difficult to account for significant variance with a parent-report measure.
Conclusions
The contexts in which children are raised shape and influence their behavior. Interactions with caregivers are arguably the strongest predictor of later CPs outside of the home (e.g., Dishion & Patterson, Reference Dishion, Patterson, Cicchetti and Cohen2006; Shaw et al., Reference Shaw, Bell and Gilliom2000). Coercive family dynamics are mutually influenced by caregivers’ reactions to children's behaviors, the child's response to the caregiver, and so forth (Patterson, Reference Patterson, Reid, Patterson and Snyder2002). Toddlers demonstrating more oppositionality and aggression are more likely to elicit directives from caregivers and potentially initiate coercive exchanges if the child fails to comply with the request. Our study indicates that early coercive family processes amplify children's OPP/AGG behaviors and noncompliance and predict oppositionality in school. We found evidence indicating that coercive interactions are a relatively stronger predictor of subsequent child noncompliance and oppositional behaviors than are the child behaviors that amplify coercion. Overall, oppositional and noncompliant behaviors decline fairly rapidly during this developmental period; however, a higher preponderance of coercive exchanges appears to reduce the rate of decline, and CPs persist into the school arena. The FCU was found to improve the rate of decline in caregiver-reported OPP/AGG but did not appreciably reduce coercive interactions or noncompliance, indicating a need to refine treatment approaches to target these variables. Alternatively, because coercive interactions are somewhat normative during toddlerhood, perhaps parent training interventions achieve effectiveness through other mechanisms of change, such as decreasing coercion indirectly by directly increasing positive parenting.
Moving forward, studies of this nature might consider including additional child and caregiver risk factors. Evidence suggests that prenatal (e.g., Fagot, Pears, Capaldi, Crosby, & Leve, Reference Fagot, Pears, Capaldi, Crosby and Leve1998), genetic (see Raine, Reference Raine, Wilson and Petersilia2002, for a review), and caregiver characteristics, including maternal depression (e.g., Goodman & Gotlib, Reference Goodman and Gotlib1999) and caregivers’ antisocial behaviors (e.g., Patterson, Reference Patterson, Cox and Brooks-Gunn1999), also contribute to the emergence of coercive family interactions and the subsequent emergence of children's CPs. Based on the known long-term correlates of early-starting CPs and more serious forms of antisocial behavior, understanding the developmental processes that contribute to early and persistent problem behaviors is key and paves the way for effective intervention and prevention strategies that curtail this deleterious trajectory.