Introduction
Marking the onset of women’s reproductive phase, the timing of menarche is a marker of vulnerability for a plethora of physical and mental illnesses.Reference Choi and Yoo 1 Specifically, earlier age at menarche (AAM) has been associated with increased risk for vascular diseases,Reference Canoy, Beral and Balkwill 2 type 2 diabetes mellitus,Reference He, Zhang and Hunter 3 , Reference Janghorbani, Mansourian and Hosseini 4 and breast and endometrial cancers.Reference Berkey, Frazier, Gardner and Colditz 5 – Reference Rosner, Colditz and Willett 8 Earlier AAM has also been consistently associated with increased depressive and anxious symptomatology.Reference Black and Klein 9 – Reference Trépanier, Juster and Marin 13 Finally, more risky sexual behaviors and younger age of first intercourse also correspond with earlier AAM.Reference Baams, Dubas, Overbeek and van Aken 14 , Reference Vaughan, Van Hulle, Beasley, Rodgers and D’Onofrio 15 As such, earlier AAM represents a risk factor of poor physical and psychological health.
One important developmental factor that directly influences AAM is early life exposure to environmental stressors. Fetal exposure to maternal stress [prenatal maternal stress (PNMS)] in animals interferes with reproductive ability,Reference Herrenkohl 16 reproductive behaviorReference Frye and Orecki 17 and the structure of brain regions associated with reproductive function.Reference Anderson, Rhees and Fleming 18 , Reference Moyer, Herrenkohl and Jacobowitz 19 In humans, sources of severe stress during childhood such as military conflicts,Reference Tahirović 20 physical or sexual abuse,Reference Mendle, Leve, Van Ryzin, Natsuaki and Ge 21 , Reference Boynton-Jarrett, Wright and Putnam 22 as well as maternal harshness,Reference Belsky, Steinberg, Houts and Halpern-Felsher 23 changes in family dynamicsReference Culpin, Heron, Araya and Joinson 11 , Reference Moffitt, Caspi, Belsky and Silva 24 , Reference Wierson and Long 25 and interpersonal family stressors,Reference Ellis and Garber 26 have been associated with earlier AAM. Whether PNMS influences pubertal timing in humans remains unknown.
Previous studies from our labReference Dancause, Laplante and Fraser 27 , Reference Dancause, Laplante and Hart 28 and othersReference Hohwu, Zhu and Graversen 29 , Reference Bhat, Beilin, Robinson, Burrows and Mori 30 have demonstrated that PNMS and maternal–fetal hypothalamic–pituitary–adrenal (HPA) axis (a neuroendocrine stress axis) activityReference Stout, Espel, Sandman, Glynn and Davis 31 have programming effects on offspring metabolic functions. Higher PNMS is associated with increased childhood body mass index (BMI),Reference Dancause, Laplante and Fraser 27 , Reference Hohwu, Zhu and Graversen 29 , Reference Stout, Espel, Sandman, Glynn and Davis 31 obesity risk,Reference Dancause, Laplante and Fraser 27 changes in early childhood adiposity levelsReference Dancause, Laplante and Hart 28 and increased insulin secretion during adolescence.Reference Dancause, Veru, Andersen, Laplante and King 32 This is of particular importance, as higher BMI and adiposity during infancy and childhood have also been recurrently associated with earlier AAM.Reference Ong, Emmett and Northstone 33 – Reference Salgin, Norris and Prentice 37 Thus, it is possible that the effect of PNMS on AAM could be mediated through altered metabolic functions.
We are currently investigating the effects of PNMS on offspring development using a prospective, longitudinal study following children of mothers who experienced a natural disaster during their pregnancies.Reference King, Dancause, Turcotte-Tremblay, Veru and Laplante 38 The advantages of using a natural disaster as the source of stress are (1) disasters have a sudden onset, allowing for the clear demarcation of the timing during gestation that the fetus was exposed to the effects of the stressor; (2) disasters affect large numbers of pregnant women at various stages of their pregnancy; (3) the objective degree of hardship to the disasters can be readily quantified; (4) disasters are ‘independent’ stressors, that is, they are outside the influence of individuals, which circumvents the potential genetic confound of maternal psychological functioning (e.g. depression, anxiety); and (5) given their independent nature and relative random distribution, disasters allow the researcher to separate out each woman’s objective degree of exposure to the disaster from her degree of subjective distress.
In January 1998, a series of freezing rainfalls hit the southern region of Quebec, Canada, creating layers of ice on infrastructures and power lines. During the coldest month of the year, the thick ice forced the collapse of power lines, which were down for up to 6 weeks, leaving over three million people without electricity during that time. Capitalizing on this natural disaster, within 6 months of the storm (June 1998) we recruited women who had been pregnant during the ice storm or who became pregnant within 3 months of the storm. This preconception group was included because maternal preconception stress, in the months and years before conception, has immediate and long-term postnatal effects on offspring development.Reference Cheng, Park and Wisk 39 – Reference Zaidan and Gaisler-Salomon 45 We assessed the degree of the women’s objective exposure to the ice storm and their subjective distress. Their children have been evaluated on multiple developmental measures, including self-report data through questionnaires and face-to-face evaluations of their cognitive, behavioral, physical and motor development. Previous research conducted on the Project Ice Storm cohort demonstrated effects of PNMS on cognitive, affective as well as metabolic functions.Reference King, Dancause, Turcotte-Tremblay, Veru and Laplante 38
The objective of the present study is to explore the association between different aspects of PNMS and AAM by considering potential direct and indirect effects through changes in childhood BMI. We predicted both direct and indirect effects of PNMS, with higher PNMS predicting earlier AAM, both directly, as well as indirectly through increased BMI during childhood.
Materials and methods
The Research Ethical Board of the Douglas Hospital Research Center approved all phases of this study. Written informed consent was obtained from parents and written informed assent from adolescents.
Participants
Within 6 months of the ice storm, eligible women (i.e. 18 years of age or older, pregnant or who became pregnant within 3 months of the ice storm, French-speaking and living in the Montérégie region southeast of Montreal, Québec during the ice storm) were identified by their physicians who agreed to mail Project Ice Storm consent forms and questionnaires to them. Details pertaining to the identification and recruitment of subjects have been presented elsewhere.Reference Laplante, Zelazo, Brunet and King 46 A total of 87 girls with their mothers were recruited for the study. We invited all families of girls who were still in the study to participate in this phase of the project when the girls were 13.5 (n=33) and 15.5 (n=26) years of age. Of those, eight girls completed the 13.5-year questionnaire only, one girl completed the 15.5-year questionnaire only and 25 girls completed both questionnaires for a total of 34 girls. Three girls who completed at least one questionnaire did not provide information about their AAM, leaving a total 31 girls with available AAM. For 22.6% of girls, PNMS was experienced before conception, and 29.0, 25.8 and 22.6% of girls were exposed to the ice storm in the 1st, 2nd or 3rd trimester of pregnancy, respectively. We compared these 31 girls with those that were lost to follow-up (n=56) from the original sample in terms of PNMS, socio-economic status (SES) scores and BMI at 5.5 years. The two groups did not differ significantly on any variables included in the analyses for this project, although for objective hardship, the mothers of the 31 girls in the study tended to have higher values (M=9.77, s.d.=3.72) than the original sample (M=8.05, s.d.=4.16) (P=0.063).
Outcome variable
AAM was collected through a self-report questionnaire when the girls were 13.5 and/or 15.5 years of age. The following question was asked: ‘How old where you when you had your first menstruation (years__ months__)?’ If AAM was reported at both ages, only the 13.5-year report was kept. It has been documented in previous studies that self-reporting of menarche within a year or two of achieving menarche is a reliable measure of AAM.Reference Moffitt, Caspi, Belsky and Silva 24 , Reference Koo and Rohan 47 , Reference Petersen, Crockett, Richards and Boxer 48
Predictor measures
Measures of a population’s objective stress in response to each natural disaster must be custom made to represent their unique exposure. In our case, the mothers rated their objective hardship to the storm on three categories of exposure, as done in other disaster studies: Loss (e.g. total financial loss), Scope (e.g. days without electricity) and Change (e.g. time spent in a shelter).Reference Bromet and Dew 49 Each category ranged from 0 (no exposure) to 8 (high exposure). The sum of all categories created a total objective hardship scoreReference McFarlane 50 called Storm24. See Laplante et al.Reference Laplante, Zelazo, Brunet and King 46 for a list of items and the details of scoring.
Subjective distress was assessed using a validated French versionReference Brunet, St-Hilaire, Jehel and King 51 of the widely used Impact of Event Scale – Revised (IES-R).Reference Weiss and Marmar 52 The 22-item IES-R describes symptoms from three categories relevant to post-traumatic stress disorder: intrusion (thoughts and images), hyperarousal and avoidance. The IES-R instructions for respondents allow investigators or clinicians to ‘write in’ the traumatic event in question. Participants, thus, responded on a five-point Likert scale, from ‘Not at all’ to ‘Extremely,’ the extent to which each item described how they felt over the preceding 7 days in response to the ice storm crisis. The internal consistency of the total score was 0.93.Reference Brunet, St-Hilaire, Jehel and King 51 We used the total score in all analyses.
When the children were 5.5 years of age, standing height was measured to the nearest 0.5 cm, and weight was measured to the nearest 0.5 kg (Conair ‘Thinner’ digital scale, model HW118). Children were measured without shoes but with clothing; weights were not corrected for clothing weight. Sex- and age-specific BMI scores were calculated for each child using Centers for Disease Control and Prevention norms.Reference Kuczmarski, Ogden and Grummer-Strawn 53
Timing of fetal exposure to the ice storm was determined using the number of days between each mother’s anticipated due date and January 9, 1998, the date corresponding to the peak of the ice storm.
Confounding variables
Children’s birth weight and height were obtained from information recorded in the youth’s Vaccination Booklet, which all mothers in Quebec receive from the hospital upon discharge with their newborn, and verified from hospital records. Ponderal index was used because it is a better measure of intrauterine growth, and has been shown to have higher sensitivity, specificity, as well as positive and negative predictive value than birth weight for gestational age.Reference Fay, Dey, Saadie, Buhl and Gebski 54 , Reference Khoury, Berg and Calle 55 Ponderal index was calculated using the following formula: [weight (g)/height3 (cm)]×100. Mothers reported their cigarette usage (cigarettes/day) during pregnancy in a questionnaire mailed to them 6 months after their due dates. Socio-economic status (SES) was estimated using the Hollingshead scale.Reference Hollingshead 56 Potential developmental stressors were also added. Obstetric complications were determined by maternal recall using an adaptation of the scale used by KinneyReference Jacobsen and Kinney 57 and verified using hospital records. We used the total number of obstetric complications experienced by the women that were rated as moderate to severe using the McNeil-Sjöström Scale for Obstetric Complications.Reference McNeil and Sjöström 58 Major maternal life events were reported by the mothers 6 months and 5.5 years postnatal using the Life Experiences Survey.Reference Sarason, Johnson and Siegel 59
Statistical analysis
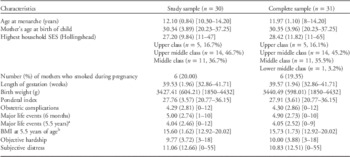
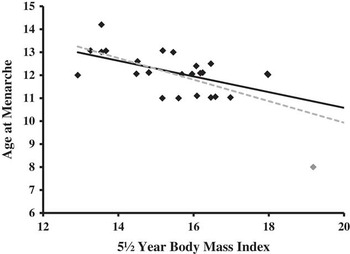
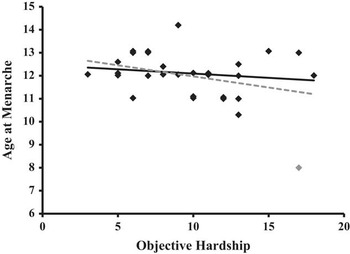
Descriptive statistics of the sample are reported with means and standard deviations for continuous variables, and frequencies and proportions for categorical variables (Table 1). Pearson’s correlation coefficients were calculated to show the zero-order correlation between predictor variables and AAM. Among the 31 girls, one girl had very early AAM (age 8 years), which was at least 2 years earlier than all the other girls. Further exploration revealed high values for both her mother’s objective stress and her own BMI at 5.5 years (shown in Figs 2 and 3). To avoid regression analysis results being greatly influenced by this single observation, the participant was excluded from all regression analyses.
Sample characteristics showing means (SD) [ranges] for continuous variables, and frequencies [percentages] for categorical variables when the extreme case was included (complete sample) or excluded (study sample)

SES, socio-economic status; BMI, body mass index.
a Data unavailable for eight mothers.
b Data unavailable for four girls.
We conducted mediation analyses to assess whether PNMS has direct or indirect effects (through BMI at 5.5 years of age) on AAM (Fig. 1), and unstandardized regression coefficients (B) are reported. Based on the literature, the mother’s SES and smoking status, as well as the child’s ponderal index at birth, are predictive of AAM and thus were selected as potential confounders.Reference Yermachenko and Dvornyk 60 Similarly, obstetric complications as well as perinatal major maternal life events and major maternal life events at 5.5 years of age were selected to test for potential effect of postnatal stress. Given the small sample size, a model over fitting problem would occur if all potential confounders were added into the model simultaneously. To avoid this problem and to ensure that the estimated effects of PNMS were not seriously confounded, we first constructed the models without any adjustment, and then we added each of the potential confounders into the model to verify their impact on the results. We reported and interpreted only the results that remained consistent across adjustments.
Scatter plot for the association between body mass index (BMI) at age 5.5 years and age at menarche. One girl (gray symbol) exposed to high-objective stress had a BMI of 19 and her period began at 8 years of age. This extreme case was removed from all statistical analyses. The black line indicates the correlation with the outlier removed from the analyses. The gray line indicates the trend with the outlier included in the analyses.

Despite the small sample size, we also conducted exploratory sensitivity analyses testing for potential effects of gestational exposure, by running the mediation analysis and removing each trimester (preconception, 1st, 2nd, 3rd) at a time.
We used the PROCESS procedure for SAS for the mediation analysis.Reference Hayes 61 We used the bootstrapping technique to create 95% confidence intervals (CI) around the estimated effects of PNMS. All results presented are unstandardized. An effect is considered statistically significant if the 95% CI excludes 0. All analyses were performed using SAS statistical software (Version 9.2; Cary, NC, USA).
Results
Table 1 shows the characteristics of the study sample. On average, participating mothers were 30 years of age at the birth of their children and the majority were classified as upper middle SES. Less than 20% of mothers reported smoking during their pregnancy. Most of the children (93.5%) were full term at birth. At 5.5 years of age, only three girls (11.5%) were classified as obese.
In total, 17 out of 31 (54.8%) participants reported their AAM at both the 13.5- and 15.5-year assessments. The correlation between reports was high (r=0.856) and the difference between the mean values of the two reports is minor: mean values are 11.82 for the 13.5-year assessment and 12.09 for the 15.5-year assessment. All of the girls had attained menarche by 15.5 years of age.
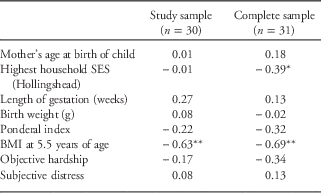
Among the predictor variables, only BMI at 5.5 years was significantly correlated with AAM (Table 2; Fig. 1). Neither subjective nor objective hardship (Fig. 2) significantly correlated with AAM (Table 2).
Scatter plot for the association between objective hardship score and age at menarche. A direct effect of objective hardship on age at menarche was not found. Note that one girl (gray symbol) exposed to a higher level of objective hardship (measured with Storm24) had her menarche at 8 years of age, and was excluded from the statistical analyses so as to avoid the regression results being greatly influenced by this single observation. The black line indicates the correlation with the outlier removed from the analyses. The gray line indicates the trend with the outlier included in the analyses.

Pearson’s correlation coefficients between potential predictors and puberty variables in the sample when the extreme case was included (complete sample) or excluded (study sample)

SES, socio-economic status; BMI, body mass index.
*P=0.03; **P<0.01.
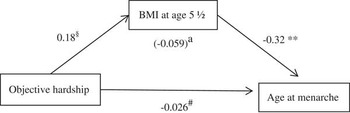
Results from mediation analyses indicated that objective hardship had no direct effect on AAM [B=−0.026, 95% CI (−0.13, 0.076)], but had a significant indirect effect [B=−0.059, 95% CI (−0.18, −0.0035)] through BMI at 5.5 years, indicating that higher objective hardship stress resulted in earlier AAM through higher BMI scores at 5.5 years of age (Fig. 3). Adjusting for maternal SES, smoking or the ponderal index of the child did not alter the results. Similarly, adjusting for source of peri- and postnatal stress did not change the results with the exception that life event stress at 5.5 years of age changed the effect from being significant to be borderline significant [B=−0.055, 95% CI (−0.169, 0.022)]. Mediation analyses on the effect of subjective stress revealed no significant direct [B=0.044, 95% CI (−0.20, 0.29)] nor indirect effects [B=−0.0066, 95% CI (−0.20, 0.12)].
Regression coefficients for the relationship between objective hardship and age at menarche (AAM) as mediated by girls’ body mass index (BMI) at 5.5 years. Unstandardized regression coefficients are presented for the direct as well as indirect effects of objective hardship on AAM (in parentheses). Regression: **P=0.002; § P=0.079; # P=0.60; a95% confidence interval excludes 0.

Finally, the sensitivity analyses on the mediation model for the 22.6% of the girls whose mothers experienced the disaster before conceiving revealed very similar results. For example, the regression coefficient of the indirect effect of objective hardship through BMI at 5.5 years of age was B=0.056 (95% CI −0.17, 0.0041), almost identical to the initial results. Sensitivity analyses sequentially excluding the girls exposed in the 1st, 2nd and 3rd trimesters demonstrated that the mediation effect remained significant when the 2nd trimester girls were excluded from the analysis [B=−0.1034, 95% CI (−0.2441, −0.0156)], whereas the effect was not statistically significant when the 1st [B=−0.0328, 95% CI (−0.1531, 0.0186)] or the 3rd [B=−0.0586, 95% CI (−0.2042, 0.0024)] trimester girls were excluded separately.
Discussion
The present study revealed a significant mediating effect of childhood BMI on the relation between PNMS and the daughters’ AAM. To our knowledge this is the first study to report an effect of PNMS on girls’ pubertal timing. Specifically, higher-level objective hardship, which included total financial loss, restricted access to essential resources and important changes experienced during the ice storm, led to a higher BMI at 5.5 years of age in their daughters, which in turn predicted earlier AAM. This effect remained significant even when controlling for maternal SES during pregnancy, prenatal maternal smoking levels and the girls’ own ponderal indices, factors known to influence both BMI and AAMReference Windham, Zhang, Longnecker and Klebanoff 62 – Reference Ferris, Flom, Tehranifar, Mayne and Terry 67 (reviewed in Reference Yermachenko and Dvornyk 60 ). In addition, reported peri- and postnatal stress did not alter the findings (with the marginal effect of major maternal life events at 5.5 years of age). Results of the sensitivity analysis suggest that the study’s findings are robust, and that maternal stress ranging from preconception throughout the gestational period is related to long-lasting effects on offspring development (e.g. 39–45).
The present results are consistent with the hypothesis that prenatal environmental stressors can affect reproductive systems through their effects on metabolism (Fig. 3). Previous work from our groupReference Dancause, Laplante and Fraser 27 , Reference Dancause, Laplante and Hart 28 , Reference Cao-Lei, Elgbeili and Massart 68 and othersReference Hohwu, Zhu and Graversen 29 , Reference Hohwu, Li, Olsen, Sorensen and Obel 69 have demonstrated significant associations between PNMS and metabolic profiles in childhood. In two different populations exposed to natural disasters (the 1998 Quebec ice storm and the 2008 Iowa flood), it was found that greater PNMS predicted greater risk of obesity at 5.5 years of ageReference Dancause, Laplante and Fraser 27 and a greater increase in adiposity levels between 2.5 and 4 years of age.Reference Dancause, Laplante and Hart 28 Similar findings were observed through prenatal parental separationReference Hohwu, Zhu and Graversen 29 and prenatal maternal bereavement.Reference Hohwu, Li, Olsen, Sorensen and Obel 69 , Reference Li, Olsen and Vestergaard 70
Mutually regulated, energy metabolism and fertility are closely connected, particularly in women.Reference Martos-Moreno, Chowen and Argente 71 , Reference Della Torre, Benedusi, Fontana and Maggi 72 Under- and over-nutrition have been consistently related to delayed and advanced puberty, respectively.Reference Yermachenko and Dvornyk 60 It is well established that variations in body composition during childhood (from 3 to 10 years of age) impact pubertal timing such that greater BMI is associated with earlier AAM.Reference Ong, Emmett and Northstone 33 , Reference Salgin, Norris and Prentice 37 , Reference Boyne, Thame and Osmond 73 – Reference Zhai, Liu and Zhao 79 Changes in nutritional conditions and adiposity are considered central factors that are contributing to the secular trend in reduced pubertal age in Western countries and more recently in China and India.Reference Parent, Franssen, Fudvoye, Gérard and Bourguignon 80 , Reference Parent, Teilmann and Juul 81 Adding to the current body of the literature, our results also suggest that increased adiposity in girls at 5.5 years of age predicts earlier AAM. Although the exact mechanisms linking childhood adiposity to AAM are still unknown, increased adiposity has been reported to impact the activity of the hypothalamic–pituitary–gonadal (HPG) axis through molecules such as kisspeptinReference De Bond and Smith 82 and leptin,Reference Pérez-Pérez, Sánchez-Jiménez and Maymó 83 both central regulators of metabolic and reproductive functions. The relation between girls’ BMI levels and menarchal timing has also been related to changes in the levels of sex hormone-binding globulin (SHBG) such that lower SHBG levels in girls with greater BMI predicted earlier AAM.Reference Pinkney, Streeter and Hosking 36 Higher adiposity in children has also been found to increase aromatization of androgens to estrogens.Reference de Ridder, de Boer and Seidell 84
Investigating both subjective and objective domains of PNMS, we found that only objective hardship (loss of electricity, financial loss, injuries, change in daily routine)Reference Laplante, Zelazo, Brunet and King 46 reduced AAM through its effect on girls’ BMIs. Subjective distress had no association, suggesting a dissociation between the women’s storm-related hardships and their psychological reactions to these events; in fact, these measures are only weakly positively correlated in this cohort,Reference King and Laplante 85 and were not correlated among the girls included in this subsample (r=0.21, P=0.24). This is in contrast to our other natural disaster cohorts (Iowa and Queensland floods), where objective hardship and subjective distress positively correlated with one another to a stronger degree.Reference King and Laplante 85 Furthermore, recent analyses on the Iowa flood cohort revealed that both objective hardship and subjective distress predicted an increase in childhood adiposity,Reference Dancause, Laplante and Hart 28 whereas previous Ice Storm findings have consistently demonstrated that only objective hardship predicted changes in offspring metabolic functions.Reference Dancause, Laplante and Fraser 27 , Reference Dancause, Veru, Andersen, Laplante and King 32 , Reference Cao-Lei, Dancause and Elgbeili 86
Although speculative, it is possible that certain parameters associated with the objective experiences of the ice storm (e.g. limited heating, continued risk of injury from ice built up on roads and infrastructures) influenced the metabolic development of the offspring, irrespective of the mothers’ subjective experience. Moreover, we suspect that the nature of the disasters (an ice storm affecting a large area of southern Quebec, and a flood primarily affecting only areas immediately adjacent to rivers) led to differing distributions of the objective hardship within the two cohorts, potentially ‘allowing’ our measure of subjective distress to play a more prominent role in influencing subsequent phenotypes of the flood-exposed children. Thus, more research is needed to establish how interactions between different aspects of the human stress experience (objective and subjective stress) and the nature of the stressor may differentially affect offspring development.
Contrary to our hypothesis, we did not find direct effects of PNMS on AAM. One possible explanation is the lack of sufficient power for detecting small effects (i.e. B for direct effect=−0.09) due to the small sample size. However, it is also possible that metabolic pathways are more sensitive to disruption by a prenatal stressor depending on the stressor type and pattern of exposure, in turn affecting the reproductive system. For example, in humans, direct effects of PNMS on girls’ AAM have been found, whereas mothers who reported smoking >20 cigarettes/dayReference Windham 66 or who smoked daily during their entire pregnancyReference Behie and O’Donnell 64 had girls with an earlier AAM. Moreover, extensive work in animals has demonstrated that PNMS can directly alter female offspring reproductive functions.Reference Barrett and Swan 87 Indeed, in rodents, PNMS disrupts the typical development of brain regions associated with reproductive behavior and physiologyReference Anderson, Rhees and Fleming 18 disrupts normal sexual behavior,Reference Frye and Orecki 17 and can advanceReference Schopper, Klaus, Palme, Ruf and Huber 88 or delayReference Smith and Waddell 89 , Reference Leonhardt, Lesage and Croix 90 puberty. This suggests that PNMS can directly disrupt normal HPG axis function. However, the direction and magnitude of the effect may depend on an interaction with HPA axis. For example, decreasing or increasing fetal glucocorticoid exposure during specific gestational periods either advances or delays puberty onset, respectively.Reference Smith and Waddell 89 Thus, it is possible that the degree and type of stressor influences fetal exposure to glucocorticoids and in turn its capacity to directly interfere with the reproductive system.Reference O’Donnell, Bugge Jensen and Freeman 91
Exploration of possible timing effects through sensitivity analyses suggest that the 1st and 3rd trimesters may be particularly vulnerable periods to the indirect effect of PNMS on girls’ AAM through BMI at 5.5 years, an observation in line with recent findings by Hohwü et al.,Reference Hohwü, Li, Olsen, Sørensen and Obel 92 who demonstrated that men born to mothers experiencing a death in the family during their 1st and 3rd trimesters were at an increased risk of being overweight during early adulthood. Furthermore, effect of maternal bereavement experienced up to 6 months before conception was also associated with greater risk of offspring overweight. However, given our already small sample and that both the directions and the point estimates of the effect remained almost the same even when a significant proportion of the sample was excluded from the analyses, we caution against any strong conclusions regarding the timing effect in our sample. Mechanisms underlying the effect of maternal stress on metabolic programming from preconception to the 3rd trimester could involve changes within gene expression within the ovaReference Zaidan, Leshem and Gaisler-Salomon 93 and the developing embryo, as stress experienced in all prenatal periods have been found to influence different aspect of the metabolic system.Reference Rinaudo and Wang 94
Overall, our results demonstrate that through its effects on girls’ BMI during childhood, prenatal experience of objective hardship in mothers accelerates the onset of AAM, a well-known biomarker of both physical and psychological health adversities. Earlier AAM is associated with younger and greater risky sexual behaviors,Reference Baams, Dubas, Overbeek and van Aken 14 , Reference Vaughan, Van Hulle, Beasley, Rodgers and D’Onofrio 15 which in turn are associated with mental health problems including depression and drug abuse.Reference Ramrakha, Caspi, Dickson, Moffitt and Paul 95 Early maturing girls are also at a greater risk of being sexually assaulted in adolescenceReference Vicary, Klingaman and Harkness 96 and being targets of peer sexual harassment.Reference Mendle and Ferrero 97 , Reference Skoog and Bayram Özdemir 98 Finally, younger AAM has been associated with higher rates of spontaneous abortion.Reference Liestøl 99 , Reference Wyshak 100 Deleterious consequences of earlier AAM results in the interaction of complex biological and socio-cultural factors. Thus, there are important implications to the understanding of developmental determinants of AAM on girls’ and women’s health.
Strengths and limitations
Limitations of the present study include the modest sample size. Although we adjusted for a variety of suspected confounders, residual confounding is still possible and our sample size limited the number of analyses we could conduct. This also limited our ability to test timing effects. In addition, caution is appropriate in making inferences about other ethnic and socio-economic groups as our current sample was relatively socio-economically advantaged and ethnically homogenous. Thus, confirmation of our results in an independent replication with a larger and more diverse sample will be needed to ascertain the validity of our results.
The strengths of the present study include its prospective design and the use of a natural disaster as the source of stress allowing for the distinction between objective and subjective aspects of PNMS and their differential associations with offspring phenotypes. The independent nature of the stressor overcomes some of the current limitations that exist in most human PNMS studies that rely on factors that are not independent of maternal characteristics. Although the SES homogeneity of our sample may limit generalizability, it also likely reduced the confounding effects of SES and ethnicity, thereby increasing our power to detect biological effects. Furthermore, our longitudinal design allowed us to assess our participants approximately every 2 years for over 15 years, providing a more accurate measurement of AAM, as it was assessed within a few years after menses onset.
Future directions
The data show that PNMS, through its effects on BMI, predicts AAM, which is a biomarker of reproductive, physiological and psychological health. It will be important for future studies to assess whether other markers of reproductive function are also affected, such as ovarian function and reproductive hormones, particularly hypothalamic releasing hormones. One likely neural site that may be disrupted by PNMS is the hypothalamus that develops prenatally and is a key neural region involved in reproductive physiology and behavior, as well as energy metabolism. Future studies should also assess whether PNMS affects puberty and fertility in boys, potentially through its effects on BMI.
Acknowledgments
The authors thank Lorraine Dubois for obtaining the girls’ height and weight measurements at the 5.5-year assessment; Isabelle Bouchard for coordinating the 13.5- and 15.5-year assessments; and Louis-Phillipe Marquis, Marie-Eve Bouchard, Samuel Chagnon, Laurianne Drolet, Mathieu Rolhion, Marie-Pier Verner, Alexandra Oliveira Paiva and Laurence Lavoie for assisting in the data collection. Finally, the authors thank all the families in their study for their time and dedication.
Financial Support
Project Ice Storm has been funded by McGill University Stairs Memorial Fund and Canadian Institutes of Health Research (MOP-57849, MOP-79424 and MOP-111177), awarded to S.K. (principal investigator) and colleagues.
Conflicts of Interest
None.
Ethical Standards
The authors assert that all procedures contributing to this work comply with the ethical standards of the relevant national guidelines on human experimentation (Canada’s Tri-Council) and with the Helsinki Declaration of 1975, as revised in 2008, and has been approved by the institutional committee (Research Ethical Board of the Douglas Hospital Research Center).