Abbreviations
EEEnd-Effector
MMFMultimodal Fusion
FPNFeature Pyramid Network
RPNRegion Proposal Network
mAPMean Average Precision
FCNFully Connected Network
ROIRegions of Interest
DGADepth-Guided Attention
IoUIntersection over Union
CLSCurriculum Learning Strategy
FWFixed Weights
DDEDynamic Depth Estimation
SDStandard Deviation
MAEMean Absolute Error
FOVField of View
PDProportional-Derivative
TSRTask Success Rate
1. Introduction
During real-world operational tasks, Delta robots often encounter visual information errors due to variations in lighting conditions and differences in workpiece materials. The accurate and real-time capture, processing, and feedback of visual data is a critical prerequisite for ensuring precise positioning and efficient operation. To address these challenges, researchers worldwide have conducted extensive studies on visual servoing systems based on image-based visual servoing (IBVS), pose-based visual servoing (PBVS), and deep learning-based methods.
The IBVS method constructs feedback control signals by directly extracting feature information from images, thereby adjusting robot motion in real time to minimize image errors. Zhu et al. [Reference Zhu, Navarro-Alarcon, Passama and Cherubini1] connected visual features with the robot’s control inputs by utilizing principal components analysis on 2D contour subspace projections, while simultaneously generating object representations (e.g., feature vectors) and interaction models. Lagneau et al. [Reference Lagneau, Krupa and Marchal2] combined geometric B-spline models with sequential importance resampling particle filtering techniques, while also introducing an adaptive model-free shape servo control method, enabling dual-arm robots to manipulate linear objects without relying on mechanical properties or physical markers. Ghasemi et al. [Reference Ghasemi, Li and Xie3] proposed an innovative adaptive switching IBVS controller that decouples the rotation and translation motion of the camera, dividing the control process into three distinct phases. By employing variable gains, the controller enhances response speed and tracking accuracy. Briot et al. [Reference Zhu, Briot and Chriette4] analyzed three types of visual servo controllers: leg-direction-based visual servoing, line-based visual servoing, and image moment visual servoing. By establishing a localization error model that includes camera observation errors, they addressed the singularity issues of the controllers, thereby formulating an optimization design problem. Wang et al. [Reference Wang, Zhang, Fang and Li5] proposed a mobile robot visual servoing method based on virtual-goal-guided rapidly exploring random tree, utilizing a two-level framework of trajectory planning and tracking. Fried et al. [Reference Fried, Leite and Lizarralde6] propose an adaptive IBVS method that does not require camera calibration nor direct measurement of image feature velocities, employing a cascaded control structure: the upper layer uses indirect adaptive motion control to handle camera-kinematic uncertainties and depth-related parameters, while the lower layer employs Slotine–Li type direct adaptive dynamic control to compensate for robot dynamic uncertainties. Simultaneously, a partial state observer is designed to estimate the necessary quantities. Wang et al. [Reference Wang, Zhu, Zhang, Fang and Li7] utilize visual errors in real time to drive robot motion while simultaneously identifying the unknown depth from image points to the camera online. To address speed saturation limits, the controller incorporates a saturation function and compensation term in its design, ensuring the output speed operates within physical constraints, while adjusting the depth estimation through an adaptive law to eliminate model uncertainties caused by unknown depth. Under the virtual camera model, Chen et al. [Reference Chen, Lan, Liu, Zeng, Shang, Miao, Wang, Wang and Shen8] constrain the image feature error through error transformation and a prescribed performance function. Then, during the contact interaction phase, they introduce a robust adaptive stiffness force-admittance controller that adjusts the stiffness coefficient and estimates the disturbance upper bound in real time based on image error and contact force error, generating smooth and disturbance-resistant commanded image features to ensure the stability and compliance of the contact force. At the kinematic level, Wu et al. [Reference Wu, Jin, Liu, Yu and Yang9] employ an iterative linear quadratic regulator within a predictive control framework to design a velocity controller and generate reference velocities. At the dynamic level, they introduce a Gaussian process-based (GP) data-driven predictive controller to estimate unknown dynamics and design a torque control law, while also providing an upper bound on the GP prediction error. Kamath et al. [Reference Kamath, Zheng and Feroskhan10] construct an enhanced set of states by coupling the kinematic relationships of camera image features with the dynamics model of the aircraft, including image features, their derivatives, and aircraft dynamic variables. In the controller design, unknown depth-related quantities are handled through system augmentation and observers, resulting in a control law that relies solely on image measurements without the need for direct depth measurements. The aforementioned methods rely on local or simplified IBVS models, as well as manually set intermediate targets and switching conditions. This leads to challenges in ensuring global convergence and real-time performance, while also exhibiting high sensitivity to online data acquisition, sensor accuracy, and environmental noise. Consequently, this limits their robustness and control precision in complex scenarios.
The PBVS method is a technique that utilizes three-dimensional pose data obtained from a camera to achieve precise control of a robot’s spatial position and orientation through geometric reconstruction. Daraviña et al. [Reference Daraviña, Valencia, Holguin, Quintero, Ariza and Vergara11] used the Eye-to-Hand configuration in a 3-RRR parallel manipulator, optimized the sensor orientation, and combined PBVS and Kalman filtering to predict the trajectory of the object based on the initial parameters when the object was occluded, achieving continuous and precise tracking. Xie et al. [Reference Zhu, Xie and Shen12] combined PBVS and adaptive sliding mode control to enhance the trajectory tracking control of a 6-RSS parallel robot. They utilized the C-Track 780 optical measurement sensor to measure the pose of the robot end-effector (EE) in real time. The accuracy of pose estimation was improved through an adaptive Kalman filter, and a highly robust sliding mode controller was designed to address system uncertainties. Additionally, a radial basis function neural network was introduced for the automatic adjustment of control gains. Silva et al. [Reference Da Silva, Colombo, De Oliveira and De Oliveira13] combined PBVS with strain-based feedback control to enhance the vibration suppression capabilities of parallel manipulators equipped with flexible links. The sliding mode control strain feedback loop effectively reduces overshoot and position errors during operation, thereby significantly improving trajectory tracking performance. In conjunction with the requirements for precise positioning and trajectory tracking of parallel robots using the PBVS method, the aforementioned research adopted adaptive or hybrid control strategies to address complex motions. However, due to insufficient data sampling and inadequate noise handling strategies, inconsistencies arose in the estimation of key parameters (such as the Q matrix) in inverse kinematics. This issue is analogous to the error accumulation caused by an excessive reliance on local features in PBVS, ultimately affecting the stability and efficiency of the PBVS control framework in industrial applications.
The deep learning-based visual servoing method is a technique that automatically extracts and learns complex image features by constructing and training neural network models, enabling intelligent prediction and control of target states in dynamic environments. Ribeiro et al. [Reference Ribeiro, De Queiroz Mendes and Grassi14] utilized the Cornell Grasping Dataset to employ a CNN for simultaneous recognition of object pose and the selection of stable grasping contact points. Al-Shanoon and Lang [Reference Al-Shanoon and Lang15] proposed a framework called deep visual servoing, which utilizes a monocular RGB camera to overcome the limitations of traditional methods in real-world scenarios, such as lighting and occlusion. Han et al. [Reference Han, Ren and Zheng16] proposed a spectral adaptive law for online neural network training by replacing the traditional F-norm term in the Lyapunov function with a spectral norm regularization term. This approach enhances the robustness of closed-loop systems, reduces sensitivity to disturbances, and ensures that the network weights remain bounded through a mapping algorithm. Additionally, they utilized a neural network estimator for the online identification of the system’s composite Jacobian matrix, which not only avoids the time-consuming process of camera calibration but also allows for the design of a dynamic visual servo controller based on the identification results. Jiang et al. [Reference Jiang, Ishihara, Sugiyama, Oaki, Tokura, Sugahara and Ogawa17] proposed a deep learning method based on depth images for vision-guided robotic box picking, targeting efficient grasping of textureless planar objects. By utilizing a deep convolutional neural network to directly predict grasping points, the complex object segmentation process is avoided. Yu et al. [Reference Han, Yu, Batra, Boyd, Mehta, Zhao, She, Hutchinson and Zhao18] proposed a robot grasping framework based on the transformer model, designed for the safe handling of deformable objects such as fruits. By integrating visual and tactile information, the framework overcomes the limitations of traditional methods in dynamic contact interactions. Utilizing two exploratory actions (pinching and sliding), the model effectively extracts the physical characteristics of objects and employs deep learning techniques to predict safe grasping forces. Odira et al. [Reference Odira, Andreff, Petiet and Byiringiro19] adopt a two-stage training approach that first uses data generated by a physical model for pretraining, followed by fine-tuning with a small amount of measured data to improve path tracking accuracy and robustness. This method does not rely on image velocity measurements, cascade observers, or adaptive laws, and it is proven to ensure global stability and error convergence even in the presence of unmodeled dynamics. Hong et al. [Reference Hong, Albia, Kyzer, Cornelius, Mark, Hall and Wang20] proposed combining artificial neural networks with nonlinear model predictive control for visual path tracking of mobile robots, and employed a two-stage training strategy to enhance the generalization capability of the data-driven model. Kamath et al. [Reference Kamath, Anavatti and Feroskhan21] proposed a method that combines physics-informed neural networks (PINN) with dynamics-centered visual servoing: by learning an enhanced dynamics model through PINN, the changes in image pixels are directly mapped to the thrust and torque inputs of a multirotor. Simultaneously, PINN is used to model uncertainties in camera and vehicle parameters as well as dynamics modeling errors, thereby merging image noise and system disturbances into a unified disturbance term to improve robustness. The generalization ability of deep learning methods for robotic grasping and dynamic manipulation is crucial. However, relying solely on limited RGB or synthetic data, while neglecting depth information, object segmentation, and tuning for control gains, noise, and adaptability to complex objects, can increase grasping errors, energy consumption, and reduce positioning accuracy. Additionally, offline training and high computational complexity result in slow system responses and insufficient robustness, thereby limiting its industrial applications.
This paper considers the material differences of workpieces in unstructured environments based on Delta robot conditions and designs an improved Mask R-CNN instance segmentation model for segmenting target workpieces and the EE. By integrating a dynamic depth estimation algorithm, it enables precise and rapid object localization. The method is suitable for unstructured environments, which is crucial for the generalization of robotic systems. Meanwhile, it reduces localization errors while ensuring accuracy. Additionally, it enables real-time feedback processing, meeting the requirements of high-speed parallel robotic systems.
The contributions of our work are summarized as follows.
-
1. We design a hierarchical multimodal fusion module built on a dual-stream ResNet50–FPN backbone that aligns multi-scale RGB and depth features, improving mAP@0.5 from 84.7 to 95.2% while increasing parameters by only approximately 5.0%.
-
2. We introduce a depth-guided attention module that cross-modally reweights RGB-depth features spatially and channel-wise, boosting instance segmentation IoU from 0.68 to 0.81 while keeping mask inference latency at roughly 8.3 ms.
-
3. We propose a dynamic depth estimation method that uses noise–distance adaptive grids, within-grid median filtering, and inverse variance weighted median fusion, reducing depth MAE from 12.3 to 5.7 mm. Integrated with PD + Jacobian control, the full pipeline operates at roughly 40 Hz.
2. Multimodal learning Mask R-CNN
2.1. RGB-D multimodal fusion module
This network utilizes RGB-D multimodal fusion module (MMF) input to achieve heterogeneous feature extraction through parallel data streams. The RGB image stream receives 8-bit color data at a resolution of 1,280 × 720 × 3, processed through pixel-level normalization, as shown in Eq. (1):
 \begin{equation}\boldsymbol{{I}}_{\text{norm}}=\frac{\boldsymbol{{I}}_{\textrm{raw}}}{255}\end{equation}
where I norm represents the normalized image, while I raw is the original image, mapped to the range of [0,1]. The depth image stream processes 1,280 × 720 depth data in Z16 format, with the depth value intercepted in the range of [0, 2000] and then normalized, as shown in Eq. (2):
 \begin{equation}\boldsymbol{{D}}_{\text{norm}}=2\cdot \frac{\boldsymbol{{D}}_{\textrm{raw}}}{2000}-1\end{equation}
where D norm represents the normalized depth image, and D raw is the original depth image. This generates a normalized tensor aligned with the RGB modality, which is then normalized to the range of [−1, 1] using min–max scaling. This preprocessing strategy effectively eliminates noise from the depth sensor while preserving millimeter-level geometric accuracy.
The network has designed a hierarchical feature fusion mechanism, as depicted in Figure 1. Both streams utilize an improved ResNet50-FPN backbone network with shared parameters, which includes:
-
1. Shallow feature sharing: Weight sharing between Conv1-Conv3 layers to extract common edge and texture features.
-
2. Deep modality differentiation: Conv4-Conv5 layers differentiate into dedicated paths for RGB and depth, respectively, extracting color semantics and geometric structure features.
-
3. Multi-scale fusion: At the P3-P5 levels of the feature pyramid network (FPN) output, feature fusion is achieved through adaptive channel alignment and element-wise summation, as follows in Eq. (3):
 \begin{equation}\boldsymbol{{F}}_{\text{fusion}}^{i}={\textrm{Conv}}_{1\times 1}\left(\boldsymbol{{F}}_{\text{color}}^{i}\right)+{\textrm{Conv}}_{1\times 1}\left(\boldsymbol{{F}}_{\text{depth}}^{i}\right) \left(i\in \left\{3,4,5\right\}\right)\end{equation}
where
 $\boldsymbol{{F}}_{\text{fusion}}^{i}$
represents the fused feature map of the layer i,
 $\boldsymbol{{F}}_{\text{color}}^{i}$
denotes the feature map extracted from the RGB modality at the layer i, and
 $\boldsymbol{{F}}_{\text{depth}}^{i}$
denotes the feature map extracted from the depth modality at the layer i.
The 1×1 convolutional layer is used to unify the channel dimension (256→256), and the fused feature tensor is input into the subsequent region proposal network (RPN). This design significantly enhances the representation capability for occluded and reflective objects while reducing the number of parameters, as detailed in Table I.
Ablation study on MMF module (mAP@0.5).

MMF input preprocessing, (a) hierarchical feature fusion, (b) structure of the MMF module.

This layered fusion strategy retains spatial details at lower levels while integrating semantic context at higher levels. The output size of the fusion module is 14×14×256, and classification and bounding box regression are performed subsequently through the fully connected network (FCN). Additionally, a Softmax layer is used for the final class prediction.
Mask R-CNN network architecture based on RGB-D multimodal learning.

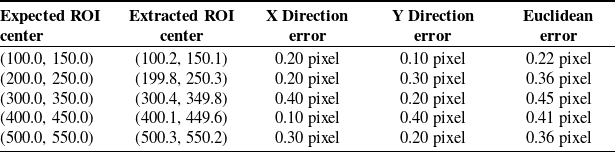
The network retains the architecture of Mask R-CNN and has made key improvements for robotic grasping scenarios, as shown in Figure 2: the RPN uses five anchor scales of {32, 64, 128, 256, 512} and three aspect ratios of 0.5, 1, and 2 to optimize the prior box distribution for robotic tasks; the regions of interest (ROI) align layer extracts 7 × 7 region features from the fused feature map, with a coordinate alignment error of less than 0.5 pixel, as detailed in Table II; the dual-task head consists of a classification-box regression head (Faster R-CNN) and a mask prediction head, which operate in parallel, with the latter incorporating a depth-guided attention mechanism, as discussed in Section 2.2.
Coordinate alignment error experiment.

The total number of parameters in the network is 46.3 million, which is an increase of only 4.8% compared to the baseline model.
2.2. Depth-guided attention module
In the Delta robot grasping task, the material of the target objects (such as metal and glass) and complex scenes (such as occlusion and reflection) pose significant challenges to mask prediction accuracy. The mask head of the traditional Mask R-CNN only relies on RGB features, which makes it difficult to effectively distinguish objects with similar geometry but different materials. To address this, this paper designs the depth-guided attention mechanism (DGA), which dynamically integrates information from the depth modality to enhance the robustness of mask predictions. The core idea can be expressed as Eq. (4):
 \begin{equation}\boldsymbol{{A}}_{\textrm{att}}=\sigma \!\left(\boldsymbol{{W}}_{\!a}\cdot \left[\boldsymbol{{F}}_{\text{fusion}};\,\boldsymbol{{F}}_{\text{depth}}\right]\right)\odot \boldsymbol{{F}}_{\text{fusion}}\end{equation}
where
A
att represents the attention weight matrix, σ denotes the Sigmoid activation function,
W
a
is the learnable weight parameter, [
 $\cdot\,;\,\cdot$
] indicates channel concatenation, and ⊙ signifies element-wise multiplication. This mechanism adaptively weights the fused features in both spatial and channel dimensions using deep features.
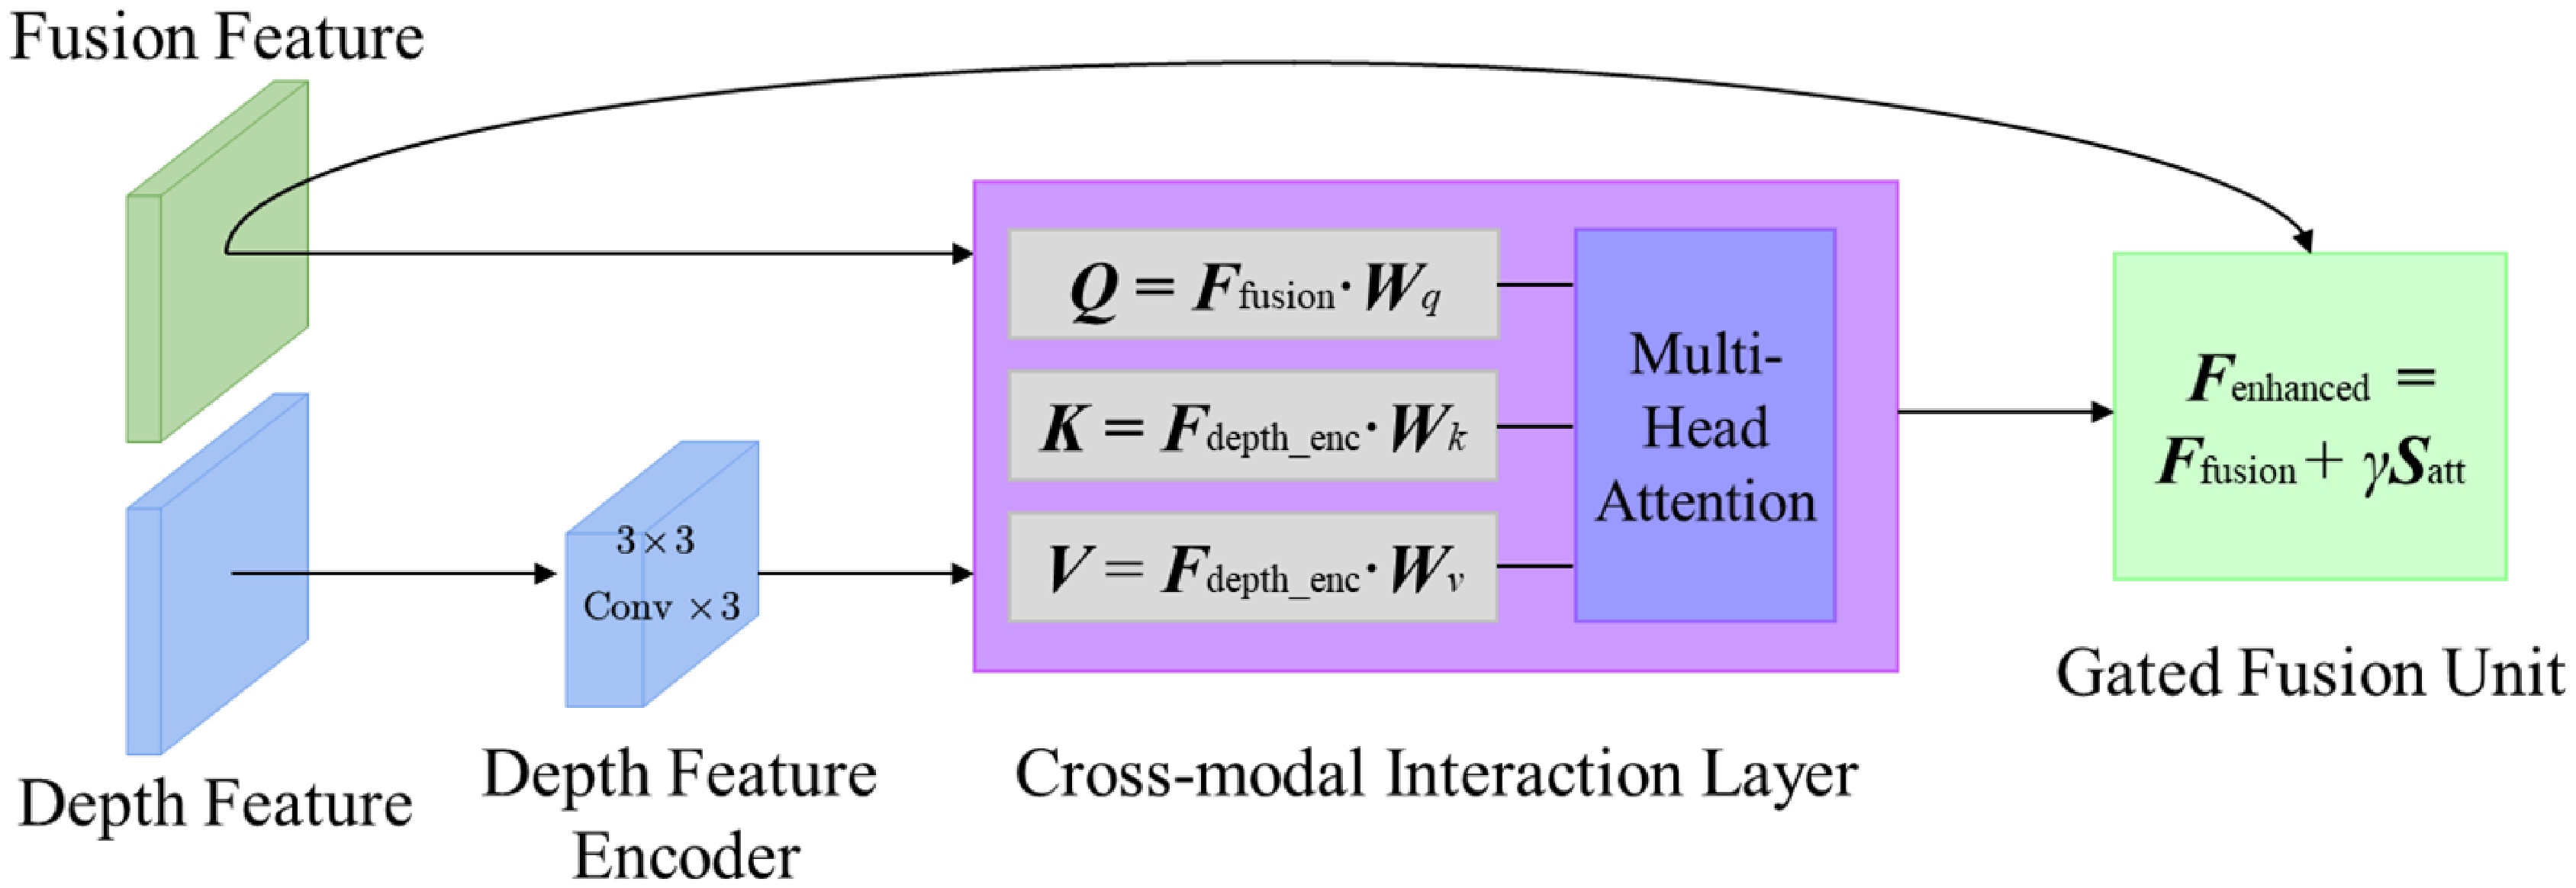
The DGA module consists of a deep feature encoder, a cross-modal interaction layer, and a gated fusion unit submodule, as shown in Figure 3. The deep feature encoder encodes the depth features F depth output by the FPN into a tensor with the same resolution as the fused features through three layers of 3 × 3 convolution. The cross-modal interaction layer computes the correlation between the fused features and the depth features using cross-attention, as follows in Eqs. (5) and (6):
DGA module.

 \begin{align} \boldsymbol{{Q}}=\boldsymbol{{F}}_{\text{fusion}}\boldsymbol{{W}}_{q}, &\quad\!\! \boldsymbol{{K}}=\boldsymbol{{F}}_{\text{depth}}\boldsymbol{{W}}_{k},\quad \boldsymbol{{V}}=\boldsymbol{{F}}_{\text{depth}}\boldsymbol{{W}}_{v} \end{align}
 \begin{align} \boldsymbol{{S}}_{\textrm{att}} &=\text{Softmax}\!\left(\frac{\boldsymbol{{Q}}\boldsymbol{{K}}^{T}}{\sqrt{d_{k}}}\right)\boldsymbol{{V}} \end{align}
where W q , W k , and W v represent the learnable weight parameters for Q , K , and V , respectively, while S att denotes the attention map. The gated fusion unit further integrates the attention map S att with the original fused features, using Eq. (7):
 \begin{equation}\boldsymbol{{F}}_{\text{enhanced}}=\boldsymbol{{F}}_{\text{fusion}}+\gamma \cdot \boldsymbol{{S}}_{\textrm{att}}\end{equation}
where γ is a learnable scaling factor, with an initial value of 0.1.
Ablation experiments on the synthetic dataset indicate that the DGA module significantly enhances segmentation accuracy in complex scenarios, as detailed in Table III.
Ablation study on DGA module (IoU).

To meet the real-time requirements of the Delta robot, the DGA module employs a lightweight design: channel compression reduces the number of attention channels from 256 to 64, with only a 0.8% loss in accuracy; sparse computation applies the DGA only at the P4 level of the FPN, resulting in a 22% increase in inference speed. On the Advantech EPC-P3086 industrial computer platform, the inference time for the mask prediction head that includes the DGA is 8.3 ms.
2.3. Fine tuning
To enhance the task adaptability of Mask R-CNN under multimodal inputs, this section employs a fine-tuning framework based on category reduction and domain adaptation. It reduces the 80 target categories from general scenes to 4 target categories specific to industrial scenarios, optimizing model parameters for dynamic grasping scenarios involving Delta robots. The tuning process combines the characteristics of the MMF module and the DGA module and realizes the migration of the model from general scenarios to industrial scenarios through a hierarchical parameter optimization strategy.
Using the Mask R-CNN pre-trained on the COCO dataset as the base model retains its general feature extraction capabilities. For four types of targets in industrial scenarios: PLA plastic workpieces, metal workpieces, glass workpieces, and EE, as shown in Figure 4. Remap the classification head by replacing the 80-class classification head of COCO with a 4-class classification head. The parameters of the MMF module and the DGA module are randomly initialized to avoid feature bias caused by modal differences.
Workpieces, (a) plastic workpiece, (b) metal workpiece, (c) glass workpiece, (d) EE.

Utilizing a layered parameter unfreezing mechanism to freeze the backbone network, the weights of the Conv1-Conv3 layers in ResNet50-FPN are fixed, preserving the ability to extract low-level edge and texture features. Modality-specific layer tuning is conducted, unfreezing the RGB and depth branch parameters in the Conv4-Conv5 layers to enhance the adaptability of the model to multimodal features in industrial scenarios. During the dynamic training of the DGA module, the cross-modal interaction layer and the gated fusion unit are actively involved throughout the training process, achieving adaptive fusion of geometric and semantic features through end-to-end learning.
In addition, to address variations in lighting conditions and sensor noise in industrial environments, a joint enhancement of 12,000 pairs of labeled RGB-D images was performed, as shown in Figure 5. First, geometric perturbations were applied, introducing random rotations within a ± 15° range, scaling between 0.8 and 1.2 times, and affine transformations to both the RGB and depth images. Next, modality-specific noise was added, with Gaussian noise of σ G = 0.05 introduced to the RGB channel, along with color disturbances of ΔH = ±0.1 and ΔS = ±0.3; the depth channel received simulated impulse noise at a density of 5% and bilateral filtering for denoising, enhancing the robustness of the model against anomalies in depth sensors. Finally, synthetic occlusions were added, randomly inserting occlusion samples covering 15–25% of the area in 20% of the training batches to improve the attention focusing capability of the DGA module.
Data augmentation, (a) geometric perturbation, (top) 10° counterclockwise and 15° clockwise rotation, and (bottom) affine transformation, (b) synthetic occlusion, (top) occlusion 15%, and (bottom) occlusion 30%, (c) modality-specific noise, (top left) σG = 0.05 ΔH = −0.1, (top right) σG = 0.05 ΔS = 0.3, (bottom left) 5% pulse noise, and (bottom right) bilateral filtering.

2.4. Training
For this network model, optimize the loss function and define a multi-task joint loss function, as follows in Eq. (8):
 \begin{equation}\mathcal{L}_{\text{total}}=\lambda _{1}\mathcal{L}_{\textrm{cls}}+\lambda _{2}\mathcal{L}_{\textrm{box}}+\lambda _{3}\mathcal{L}_{\text{mask}}+\lambda _{4}\mathcal{L}_{\textrm{dga}}\end{equation}
where
 $\mathcal{L}_{\textrm{cls}}, \mathcal{L}_{\textrm{box}}, \mathcal{L}_{\textrm{mask}}$
are the classification loss, bounding box regression loss, and mask segmentation loss, respectively, and
 $\mathcal{L}_{\textrm{dga}}$
is the attention supervision loss, as follows in Eq. (9):
 \begin{equation}\mathcal{L}_{\textrm{dga}}=||\boldsymbol{{S}}_{\textrm{att}}-\boldsymbol{{Y}}_{\text{edge}}||_{2}\end{equation}
where
 $\boldsymbol{{Y}}_{\text{edge}}$
is the object edges extracted from the depth map using the Canny operator as prior knowledge. The weight coefficients λ
1 to λ
4 adopt a curriculum learning strategy (CLS), as follows in Eq. (10):
 \begin{equation}\lambda _{i}\left(t\right)=\lambda _{i}^{\text{start}}+\left(\lambda _{i}^{\textrm{end}}-\lambda _{i}^{\text{start}}\right)\!\cdot \frac{t}{T}\end{equation}
where the initial weights are denoted as
 $\lambda _{i}^{\text{start}}$
and the final weights as
 $\lambda _{i}^{\text{end}}$
, with initial values of [1.0, 1.0, 0.5, 0.2]. These values are linearly adjusted over the training epochs to [0.8, 0.8, 1.0, 0.5] to balance the convergence speed of each task. The classification loss λ
1 and localization loss λ
2 decrease from 1.0 to 0.8 to reduce reliance on the foundational tasks, while the segmentation loss λ
3 increases from 0.5 to 1.0 to enhance attention to mask details. The attention supervision loss λ
4 rises from 0.2 to 0.5 to guide the model in learning geometric features in the later stages. For further details, see Table IV.
Curriculum learning strategy.

The CLS reduces the number of training iterations by 17%, as adjustments to task weights prevent early oscillations. The intersection over union (IoU) for the target object improves by 4.8%, demonstrating the effectiveness of the enhanced attention mechanism in the later stages. This approach avoids conflicts driven by tasks, allowing early high-weight classification and localization tasks to converge quickly, thereby providing reliable candidate ROI for subsequent segmentation and preventing mask predictions from failing due to localization errors. It alleviates optimization imbalances; if weights are fixed throughout (e.g., λ 3 = 1.0), complex tasks may interfere with foundational tasks due to excessively large gradient magnitudes. The phased adjustments enable a smoother transition, enhancing overall convergence. The effectiveness of the attention mechanism is strengthened, as increasing λ 4 in the later stages compels the model to refine segmentation edges using deep geometric information once the foundational tasks stabilize, such as the reflective areas of metal workpieces and the translucent areas of glass workpieces.
A custom dataset containing 12,000 pairs of RGB-D images, including workpieces such as PLA plastic, metal, and glass materials, is used for training and validation. The multimodal learning-based model in this paper achieves 95.2% mAP@0.5 and 87% IoU, exceeding the baseline model 84.7% mAP@0.5 and 73% IoU, exceeding the late feature fusion model 87.1% mAP@0.5 and the spatial attention model 80% IoU, respectively. As shown in Figures 6(a) and 7(a), the training curve demonstrates rapid convergence. The designed method achieves 90% mAP@0.5 and 80% IoU within 40 epochs. The performance comparison of the MMF module and the DGA module designed in this paper with other methods under fixed weights (FW) and CLS approaches are shown in Figures 6(b) and 7(b).
The MMF module, (a) training curve, (b) performance comparison.

The DGA module, (a) training curve, (b) performance comparison.

The model achieves a real-time inference speed of approximately 50 FPS on the Advantech EPC-P3086 industrial computer platform, ensuring that visual information can be processed and fed back in about 20 milliseconds.
3. Dynamic depth estimation
In the depth images generated by the Intel RealSense D455, there are also some common and significant issues, which can be summarized in the following two aspects:
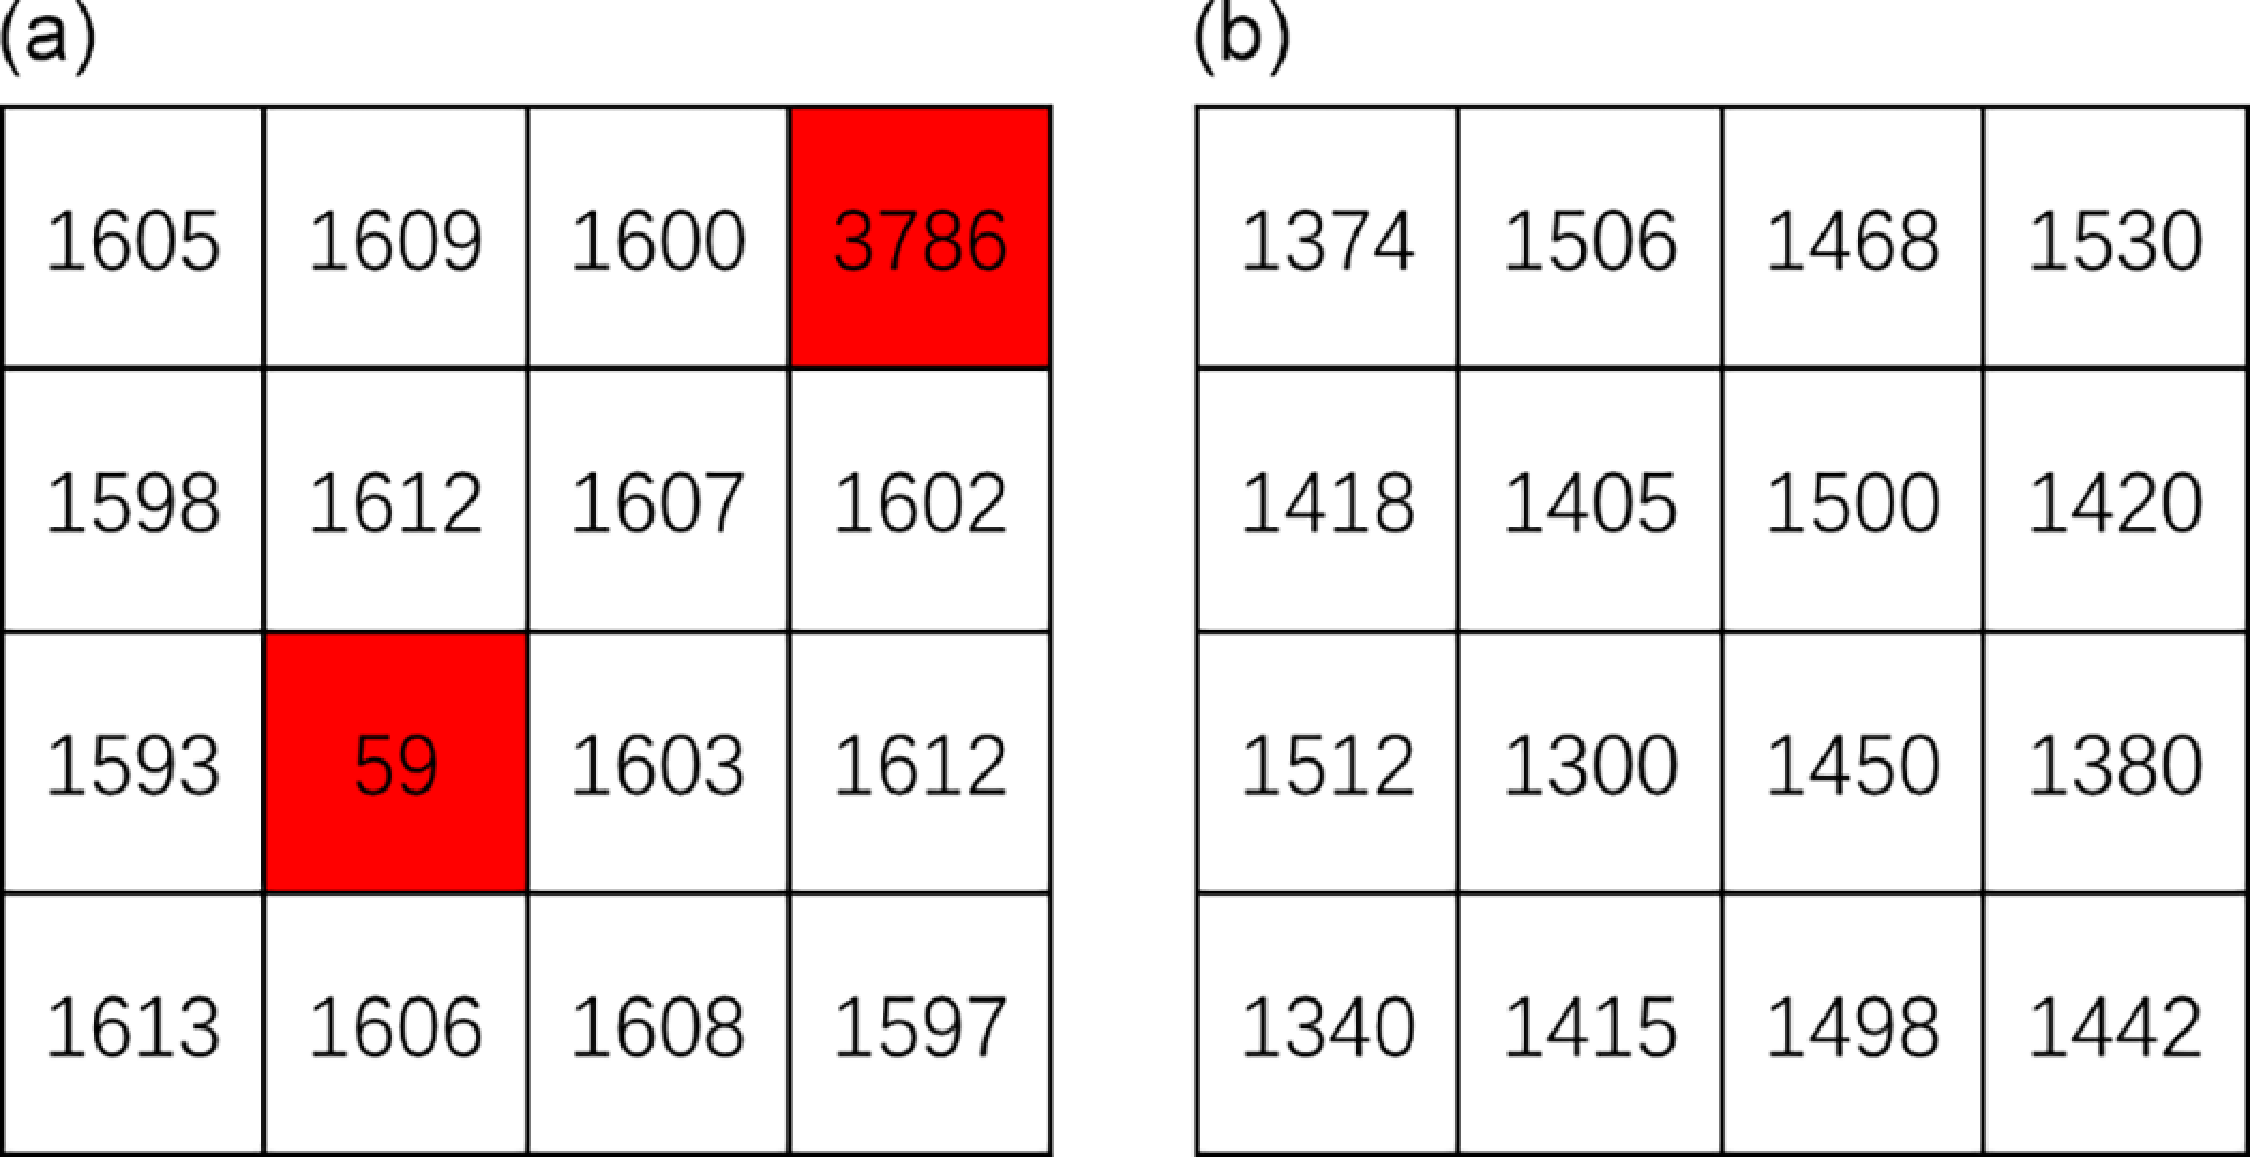
One is that the depth image contains erroneous pixel values that cannot accurately represent depth. For example, the pixel segment in the depth image shown in Figure 8(a) corresponds to an object at a depth of 1600 mm, and the values of the erroneous pixels (marked in red) differ significantly from the actual depth of the object.
Common issues with depth images, (a) local outlier, (b) depth fluctuation.

The other is that the depth values of the same object in the depth image are different and fluctuate. For example, the pixel segment is shown in Figure 8(b). These pixels correspond to a plane object with a depth of 1,400 mm. The pixel segment shows that the pixels on the same plane fluctuate by about 150 mm.
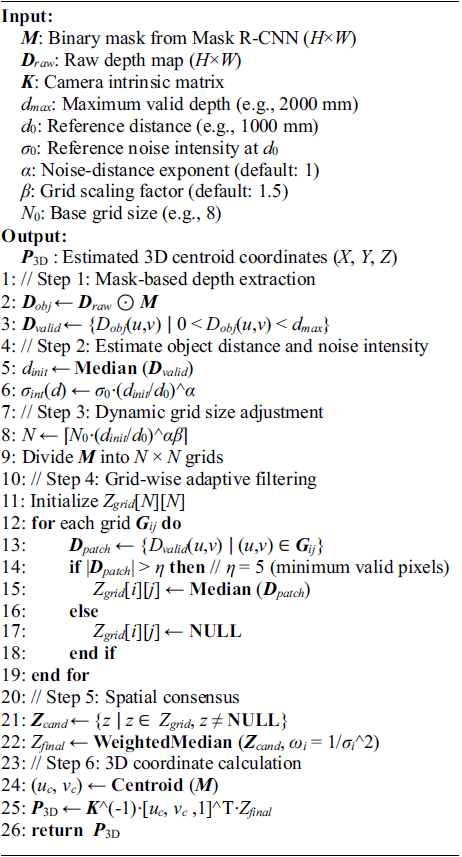
In order to solve the above problems, the following dynamic depth estimation (DDE) algorithm is designed, see Algorithm 1 for details. The main idea of the algorithm is: first take the instance segmentation mask in the depth image and divide it into n grid cells; then calculate the local depth Z grid of each grid cell to eliminate local outliers; then weight these local depths by inverse variance to obtain Z cand to suppress depth fluctuations; finally, concatenate the target mask centroid (u c , v c ) and the object depth Z final, and output the target three-dimensional coordinates P 3D through the camera model, see Section 4 for details.
Dynamic Depth Estimation.

Considering that the noise intensity σ int and the object distance d directly determine the statistical characteristics and reliability of depth data and are highly coupled with the physical model of the sensor, the influence of other variables (such as lighting and material) has been effectively isolated by the preliminary part of the model (MMF module, DGA module). This ensures the focus and efficiency of the depth estimation part; thus, the relationship between the two and the number of grid cells N is established.
The noise model of the depth sensor is usually Gaussian noise, and the noise intensity generally varies exponentially with the distance of the object from the sensor, as shown in Eq. (11):
 \begin{equation}\sigma _{int}(d)=\sigma _{0}\cdot \left(\frac{d}{d_{0}}\right)^{\alpha }\end{equation}
where σ int (d) is the noise intensity at the object distance d, σ 0 is the reference noise intensity, d 0 is the reference distance, which is generally the typical working distance of the sensor, and α is the relationship exponent, usually α ≈ 1. In general, the greater the noise, the more grid cells N are needed. By increasing the number of grid cells, multiple local depth values can be used to reduce the impact of noise and improve the accuracy of depth estimation, as shown in Eq. (12):
 \begin{equation}N(\sigma _{int})=\left[N_{0}\cdot \left(\frac{\sigma _{int}}{\sigma _{0}}\right)^{\beta }\right]\end{equation}
where N
0 is the number of reference grid cells,
 $\beta$
is the adjustment factor used to control the relationship between noise intensity and the number of grid cells, usually within [Reference Zhu, Navarro-Alarcon, Passama and Cherubini1, Reference Lagneau, Krupa and Marchal2]. Substituting (11) into (12) can be expressed as Eq. (13):
 \begin{equation}N(d)=\left[N_{0}\cdot \left(\frac{d}{d_{0}}\right)^{\alpha \beta }\right]\end{equation}
This relationship implies that as the distance d of an object increases, the noise σ int also increases, and the number of grid cells N correspondingly increases, thereby enhancing the stability and robustness of depth estimation.
When calculating the independent depth value of each grid cell, the minimum valid pixel threshold is set, and only when the number of valid pixels in the grid
 $\eta$
≥ 5 is involved in the calculation, the interference of sparse data is avoided and adaptive filtering is realized. Through the spatial consensus mechanism, the local depth values of the valid grid cells are weighted by inverse variance.
Let the local depth values in the effective grid cell G ij be Z cand = {z 1, z 2, …, z k }, with each value z i corresponding to a variance of σ i 2, as follows in Eq. (14):
 \begin{equation}\sigma _{i}^{2}=\frac{1}{n_{i}-1}\sum _{\left(u,v\right)\in \boldsymbol{{G}}_{ij}}\left(D\!\left(u,v\right)-\mu _{i}\right)^{2}\end{equation}
where D(u,v) is the depth value in the grid cell G ij , n i is the number of valid pixels in it, and μ i is the mean of the depth value in it, as follows in Eq. (15):
 \begin{equation}\mu _{i}=\frac{1}{n_{i}}\sum _{\left(u,v\right)\in \boldsymbol{{G}}_{ij}}D\!\left(u,v\right)\end{equation}
Sort Z cand by the median z i in ascending order to get the ordered sequence z (1), z (2), …, z (k); calculate the cumulative weight for each median, as follows in Eq. (16):
 \begin{equation}W_{j}=\sum _{i=1}^{j}\omega _{\left(i\right)}\end{equation}
where ω (i) is shown in Eq. (17):
 \begin{equation}\omega _{\left(i\right)}=\frac{1}{\sigma _{i}^{2}}\end{equation}
Find the minimum j that satisfies
 $W_j\geq 1/2W_k$
, to determine the median, then Z
final
= z
( j). The smaller the variance σ
i
2, the more stable the depth value of the grid, the larger the weight ω
i
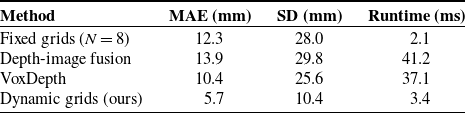
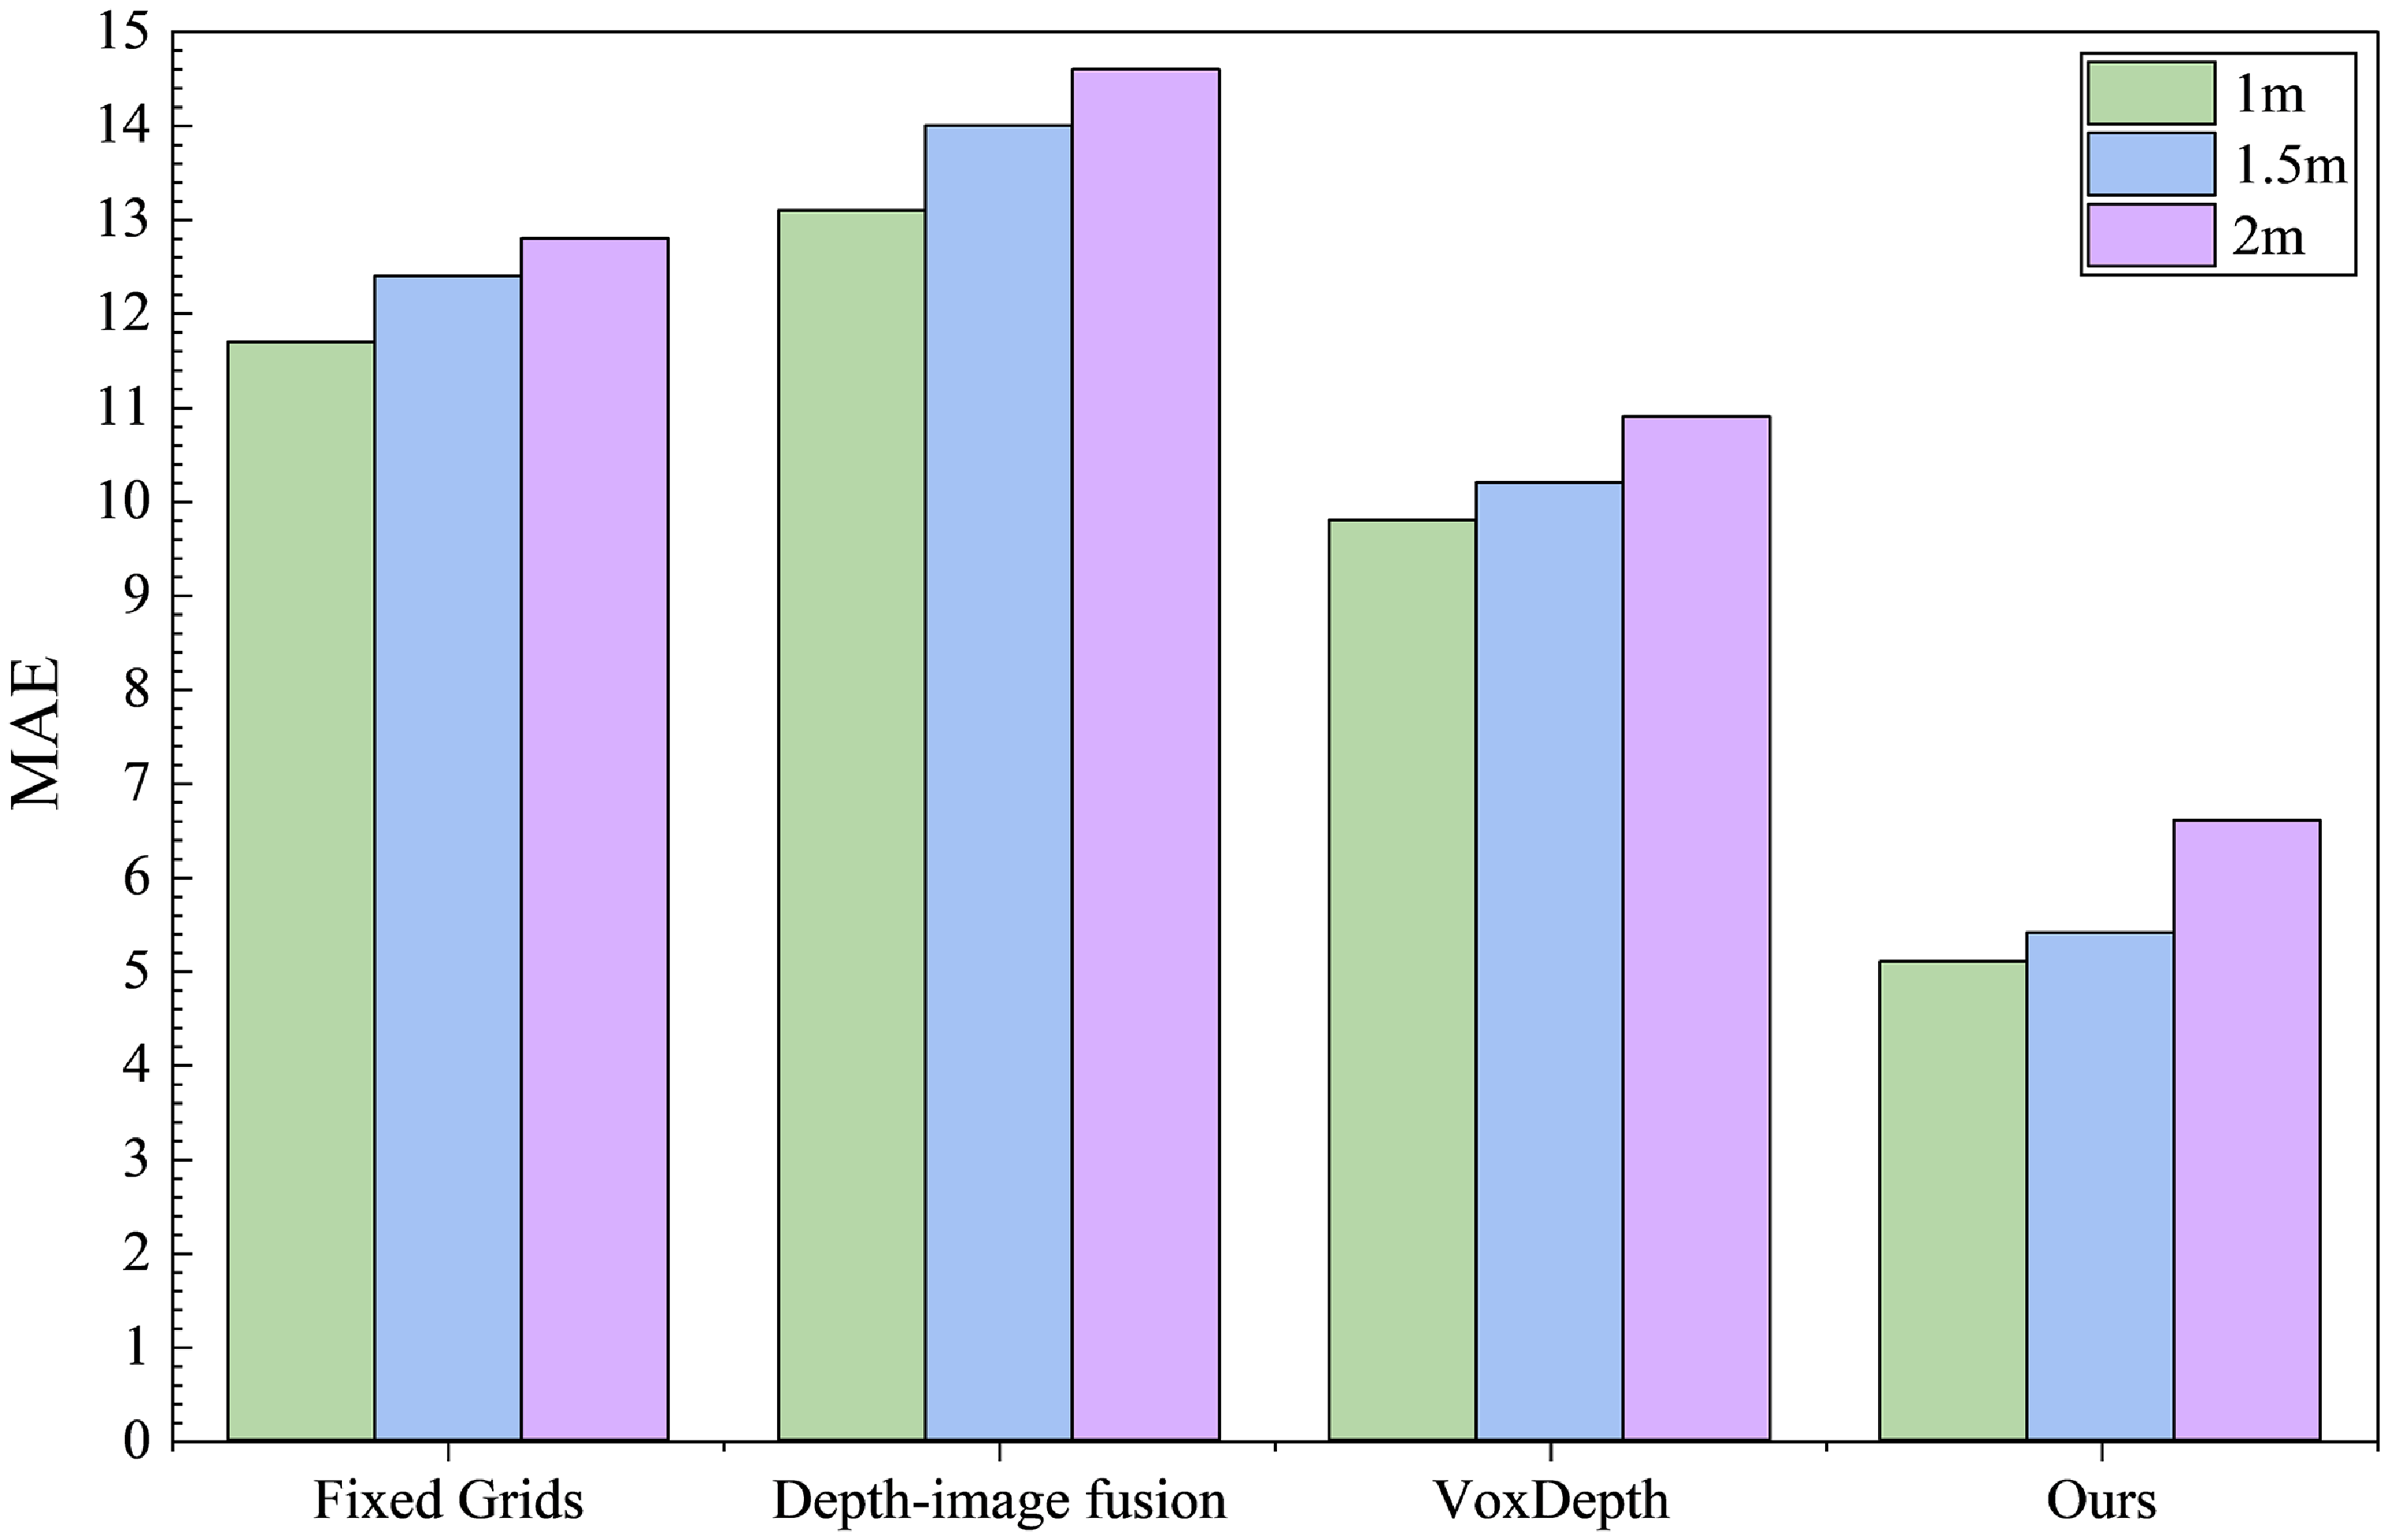
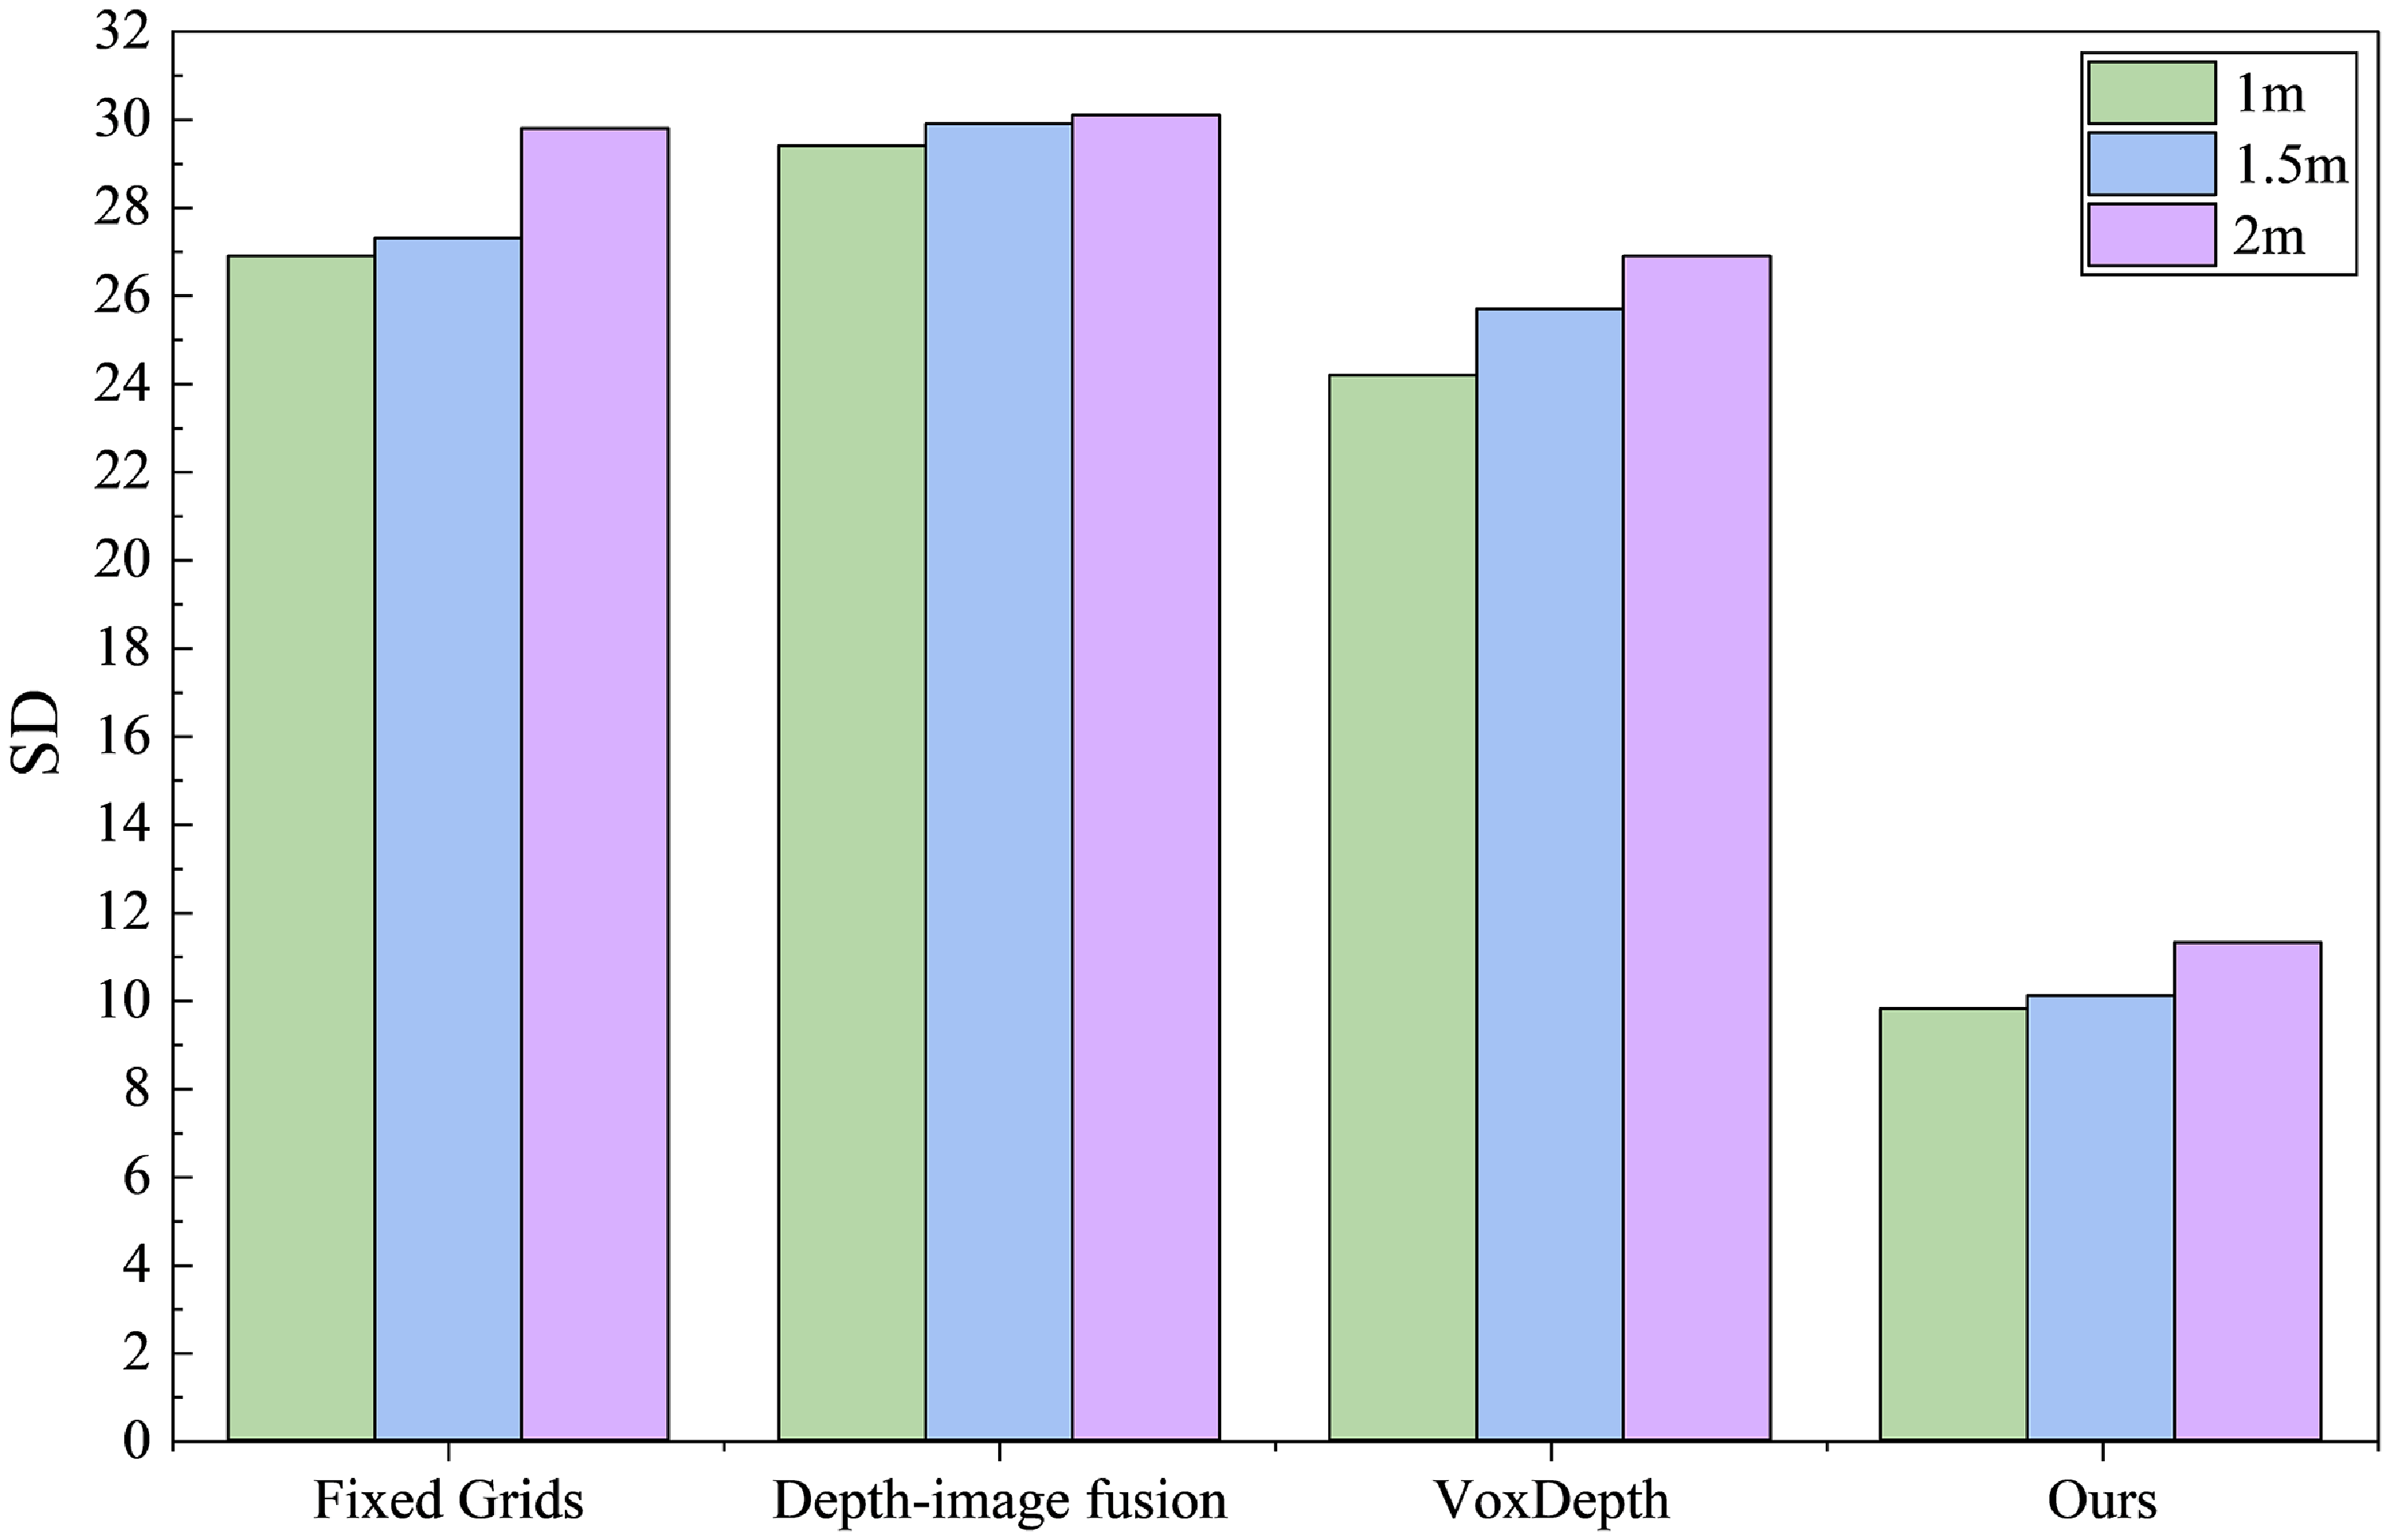
, and the greater the contribution to the final result. By weighting the median, the influence of high-variance grids that are severely affected by noise on the final depth estimation is weakened, thereby suppressing depth fluctuations. The measurement area selected is shown in Figure 9. Compared with the fixed grid strategy, Perezyabov et al. [Reference Perezyabov, Gavrilenkov and Afanasyev22] Depth-image fusion method, and Chakrabarty et al. [Reference Chakrabarty, Dixit and Sarangi23] VoxDepth method, the designed method reduces the depth fluctuation error by 54, 59, and 45%, respectively. For a plastic workpiece at a distance of 1,500 mm, the standard deviation (SD) of the depth estimation decreases from ±28 mm with the fixed grid, ±29.8 mm with the Depth-image fusion method, and ±25.6 mm with the VoxDepth method to ±10.4 mm, as detailed in Table V. Furthermore, testing has shown that although the LiDAR-visual-inertial SLAM system integrating visual point-line features of Hui et al. [Reference Hui, Zhou and Liu24] and the optical flow-based stereo visual odometry of Liu et al. [Reference Liu and Zhou25] achieve high accuracy, their processing times are 168.3 ms and 90.9 ms, respectively, which do not meet the requirements for real-time performance. Depth estimation experiments were conducted at distances of 1, 1.5, and 2 m from the workpiece, respectively. The MAE and SD statistical indicators for the four methods are shown in Figures 10 and 11.
Performance of regional depth estimation.

Objects’ measured areas, (a) uneven surface, (b) object’s edge.

MAE of depth estimation methods.

SD of depth estimation methods.

Mechanism schematic diagram of Delta robot.

4. Visual servo control
In order to facilitate the analysis of the motion rule of the robotic visual servo system, according to the research of Ni et al. [Reference Ni, Mei and Hu26], the kinematic model of the Delta robot is first established, and its mechanism is simplified to the structure shown in Figure 12. The dimensional parameters are detailed in Table VI.
Dimensional parameters of Delta robot.

As shown in Figure 12, the moving platform is simplified to a mass point
 $O^{\prime}$
, and the coordinate system O-xyz is established at the center of the static platform. In this coordinate system, the position vector
r
= (x y z)T of the moving platform reference point
 $O^{\prime}$
can be expressed as Eq. (18):
 \begin{equation}\boldsymbol{{r}}=\boldsymbol{{e}}_{i}+l_{1}\boldsymbol{{u}}_{i}+l_{2}\boldsymbol{{w}}_{i}, \quad i=1,2,3\end{equation}
where the modulus of
e
i
= e(cos
 $\beta$
i
, sin
 $\beta$
i
, 0) (i = 1, 2, 3) represents the difference in radius of the circumcircle between the moving platform and the static platform, and in Figure 12, it indicates the vector from O to A
i
;
 $\beta$
i
represents the structural angle of the static platform, with
 $\beta$
i
= (i−1)2π/3 − π/6; l
1, l
2,
u
i
, and
w
i
represent the limb lengths and unit vectors of the active and passive limbs in branch i, respectively, and
u
i
is shown in Eq. (19):
 \begin{equation}\boldsymbol{{u}}_{i}=\left(\cos \beta _{i}\cos \theta _{i}\quad \sin \beta _{i}\cos \theta _{i}\quad {-}\!\sin \theta _{i}\right)^{\textrm{T}}\end{equation}
where θ i represents the rotation angle of the active limb i (i = 1, 2, 3). By identity transformation, we get Eq. (20):
 \begin{equation}\boldsymbol{{w}}_{i}=\frac{1}{l_{2}}\left(\boldsymbol{{r}}-\boldsymbol{{e}}_{i}-l_{1}\boldsymbol{{u}}_{i}\right)\end{equation}
Taking the derivative of Eq. (18), we get Eq. (21):
 \begin{equation}\dot{\boldsymbol{{r}}}=l_{1}\dot{\theta }_{i}\left(\boldsymbol{{v}}_{i}\times \boldsymbol{{u}}_{i}\right)+l_{2}\boldsymbol{\omega }_{i}\times \boldsymbol{{w}}_{i}, \quad i=1,2,3\end{equation}
where
 $\dot{\boldsymbol{{r}}}$
represents the velocity vector of point
 $O^{\prime}$
;
 $\dot{\theta}_i$
represents the angular velocity vector of the active limb i; ω
i
represents the angular velocity of the passive limb i;
v
i
represents the unit vector perpendicular to the plane formed by
e
i
and
u
i
, and
v
i
is shown in Eq. (22):
 \begin{equation}\boldsymbol{{v}}_{i}=\left({-}\!\sin \beta _{i}\quad \cos \beta _{i}\quad 0\right)^{\textrm{T}}\end{equation}
The identity transformation yields Eq. (23):
 \begin{equation}\dot{\boldsymbol{\theta }}=\boldsymbol{{J}}_{q}^{-1}\boldsymbol{{J}}_{x}\dot{\boldsymbol{{r}}}=\boldsymbol{{J}}\dot{\boldsymbol{{r}}}\end{equation}
where J q = diag[l 1 w i T( v i × u i )] represents the direct Jacobian matrix, J x = [ w 1 w 2 w 3]T represents the indirect Jacobian matrix, and J represents the Jacobian matrix.
Layout of robot visual servo system.

Then the camera model is established, and its relationship with the robotic system layout is shown in Figure 13 and marked the robot coordinate system O-X R Y R Z R and the camera coordinate system O C -X C Y C Z C . The target can be described by the transformation relationship between the robot coordinate system and the pixel coordinate system, which involves the robot coordinate system, camera coordinate system, image coordinate system, and pixel coordinate system. Eq. (24) represents the transformation relationship between these coordinate systems.
 \begin{equation}Z_{C}\left[\begin{array}{c} u\\ v\\ 1 \end{array}\right]=\left[\begin{array}{ccc} \dfrac{1}{dx} &\quad\!\! 0 &\quad\!\! u_{0}\\[5pt] 0 &\quad\!\! \dfrac{1}{dy} &\quad\!\! v_{0}\\[5pt] 0 &\quad\!\! 0 &\quad\!\! 1 \end{array}\right]\left[\begin{array}{cccc} f &\quad\!\! 0 &\quad\!\! 0 &\quad\!\! 0\\[5pt] 0 &\quad\!\! f &\quad\!\! 0 &\quad\!\! 0\\[5pt] 0 &\quad\!\! 0 &\quad\!\! 1 &\quad\!\! 0 \end{array}\right]\left[\begin{array}{cc} \boldsymbol{{R}} &\quad\!\! \boldsymbol{{T}}\\[5pt] \boldsymbol{{O}} &\quad\!\! 1 \end{array}\right]\left[\begin{array}{c} X_{R}\\[5pt] Y_{R}\\[5pt] Z_{R}\\ 1 \end{array}\right]=\left[\begin{array}{cccc} f_{x} &\quad\!\! 0 &\quad\!\! u_{0} &\quad\!\! 0\\ 0 &\quad\!\! f_{y} &\quad\!\! v_{0} &\quad\!\! 0\\ 0 &\quad\!\! 0 &\quad\!\! 1 &\quad\!\! 0 \end{array}\right]\left[\begin{array}{cc} \boldsymbol{{R}} & \boldsymbol{{T}}\\ \boldsymbol{{O}} & 1 \end{array}\right]\left[\begin{array}{c} X_{R}\\[5pt] Y_{R}\\[5pt] Z_{R}\\[5pt] 1 \end{array}\right]\end{equation}
where Z
C
represents the depth distance measured by D455, u and v represent the horizontal and vertical coordinates in the pixel coordinate system. The matrix
 $\left[\begin{array}{ccc} \frac{1}{dx} & 0 & u_{0}\\ 0 & \frac{1}{dy} & v_{0}\\ 0 & 0 & 1 \end{array}\right]$
represents the transformation relationship matrix between the pixel coordinate system and the image coordinate system, d
x
and d
y
represent the width and height of a single pixel, u
0 and v
0 represent the pixel coordinates of the center point of the image. The matrix
 $\left[\begin{array}{cccc} f & 0 & 0 & 0\\ 0 & f & 0 & 0\\ 0 & 0 & 1 & 0 \end{array}\right]$
represents the transformation relationship matrix between the image coordinate system and the camera coordinate system, and f represents the focal length. The matrix
 $\left[\begin{array}{cc} \boldsymbol{{R}} & \boldsymbol{{T}}\\ \boldsymbol{{O}} & 1 \end{array}\right]$
represents the transformation relationship matrix between the camera coordinate system and the robot coordinate system, which is also the extrinsic parameter matrix.
R
represents the rotation matrix, with values of
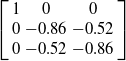 $\left[\begin{array}{ccc} 1 & 0 & 0 \\ 0 & -0.86 & -0.52\\ 0 & -0.52 & -0.86 \end{array}\right]$
,
T
represents the translation matrix, with values of
 $[ 85.00 \,\, -582.68 \,\, -406.27 ]^{\text{T}}$
, and
O
represents the zero matrix. X
R
, Y
R
, and Z
R
represent the three-dimensional coordinate values of the target in the robot coordinate system, respectively. In the second equation,
 $\left[\begin{array}{cccc} f_{x} & 0 & u_{0} & 0\\ 0 & f_{y} & v_{0} & 0\\ 0 & 0 & 1 & 0 \end{array}\right]$
represents the intrinsic parameter matrix, and f
x
and f
y
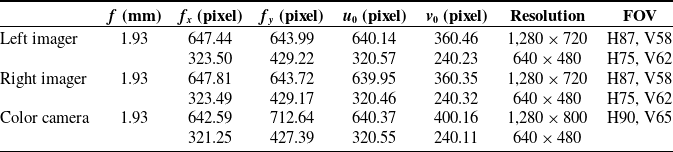
represent the equivalent focal length in the x-axis and y-axis directions, in pixels. After camera calibration, the intrinsic parameters of each imaging module of the Intel RealSense D455 were measured, and the key parameters obtained from the official technical documents [Reference Corporation27] are shown in Table VII. In addition, the baseline distance between the left and right imaging modules is 95 mm, and the field of view (FOV) of the infrared projector is H90° V63°.
Intel RealSense D455 intrinsic and key parameters.

Through the robot kinematic model and camera model, the three-dimensional coordinate information of the EE and the target workpiece can be obtained. Based on this, this paper designs a simple and efficient visual servo control strategy to achieve precise positioning and smooth movement of the Delta robot in a dynamic environment.
Let the current position of the EE be
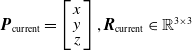 $\boldsymbol{{P}}_{\text{current}}=\left[\begin{array}{c} x \\[-3pt] y\\[-3pt] z \end{array}\right], \boldsymbol{{R}}_{\text{current}}\in \mathbb{R}^{3\times 3}$
, and the target position be
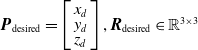 $\boldsymbol{{P}}_{\text{desired}}=\left[\begin{array}{c} x_d \\[-3pt] y_d\\[-3pt] z_d \end{array}\right], \boldsymbol{{R}}_{\text{desired}}\in \mathbb{R}^{3\times 3}$
. Define the position error as
 $\boldsymbol{{e}}_{p}=\boldsymbol{{P}}_{\text{desired}}-\boldsymbol{{P}}_{\text{current}}$
. To ensure that the system has a quick response and good robustness in a dynamic environment, this paper employs a proportional-derivative (PD) control law. Let the control input be the desired velocity of the EE
 $\dot{\boldsymbol{{r}}}_{d}$
; then the control law is designed as follows in Eq. (25):
 \begin{equation}\dot{\boldsymbol{{r}}}_{d}=\boldsymbol{{K}}_{p}\boldsymbol{{e}}_{p}+\boldsymbol{{K}}_{d}\dot{\boldsymbol{{e}}}_{p}\end{equation}
where
K
p
and
K
d
are positive definite gain matrices. This control law not only ensures the rapid attenuation of the error but also takes into account the dynamic response and anti-disturbance performance of the system. In order to obtain the joint control command, the relationship between the desired velocity
 $\dot{\boldsymbol{{r}}}_{d}$
of the EE in the operation space and the desired velocity
 $\dot{\boldsymbol{\theta}}_{d}$
of the joint space is also similar to Eq. (23), that is shown in Eq. (26):
 \begin{equation}\dot{\boldsymbol{\theta }}=\boldsymbol{{J}}\!\left(\boldsymbol{\theta }\right)\left(\boldsymbol{{K}}_{p}\boldsymbol{{e}}_{p}+\boldsymbol{{K}}_{d}\dot{\boldsymbol{{e}}}_{p}\right)\end{equation}
In order to verify the effectiveness of the control law, this paper uses the Lyapunov function method to perform stability analysis. Assume that the candidate Lyapunov function is shown in Eq. (27):
 \begin{equation}V=\frac{1}{2}\boldsymbol{{e}}_{p}^{\textrm{T}}\boldsymbol{{e}}_{p}\end{equation}
By selecting an appropriate PD gain, it can be satisfied that
 $\dot{{V}}\lt0$
, thus ensuring the global asymptotic stability of the closed-loop system.
5. Experiment
The system is deployed on a Delta robot platform equipped with an Intel RealSense D455 depth camera and Advantech EPC-P3086 industrial computer. The robot control frequency is set to 40 Hz to meet the requirements of high-speed operation. As shown in Figure 14, the model can achieve accurate segmentation on plastic workpieces, metal workpieces, glass workpieces, and EE.
Instance segmentation.

As shown in Figure 15(a), the 3D trajectory of the EE while performing the grasping task. Figure 15(b) illustrates that the EE velocity smoothly converges to the desired value within 0.25 s, demonstrating the quick response and stability of the system, while also meeting practical production demands of 60−80 times per minute. The end-to-end latency, which includes perception at 17.2 ms, depth estimation at 3.4 ms, and control computation at 1.2 ms, totals 21.8 ms, satisfying the real-time requirement of 40 Hz.
EE grasping, (a) trajectory, (b) velocity.

Record the endpoint pose of an experiment as
 $\hat{\boldsymbol{{T}}}=(\,\hat{\boldsymbol{{p}}}, \hat{\boldsymbol{{R}}})$
, with the ground truth target pose
 ${\boldsymbol{{T}}}^{*}=({\boldsymbol{{p}}}^{*}, {\boldsymbol{{R}}}^{*})$
. Where
 $\hat{\boldsymbol{{p}}}$
,
p
*,
 $\hat{\boldsymbol{{R}}}$
, and
R
* represent the actual and target position vectors and rotation matrices, respectively. The position error and the orientation error are defined as Eqs. (28) and (29):
 \begin{align} &\qquad\qquad\boldsymbol{{e}}_{p} =\left\| \hat{\boldsymbol{{p}}}-\boldsymbol{{p}}^{\textrm{*}}\right\|\\[-8pt]\nonumber \end{align}
 \begin{align} &\boldsymbol{{e}}_{\theta } =\arccos \left(\frac{\text{trace}\left(\boldsymbol{{R}}^{\textrm{*T}}\hat{\boldsymbol{{R}}}\right)-1}{2}\right) \end{align}
Let the task completion time be t done . The time from the start until the first moment the condition is met and remains stable for more than t hold seconds must be less than T max. A single experiment is judged as Eq. (30):
 \begin{equation}\text{success}=\begin{cases} 1&\text{if }\boldsymbol{{e}}_{p}\leqslant d_{th}\wedge \boldsymbol{{e}}_{\theta }\leqslant \theta _{th}\wedge t_{done}\leqslant T_{\max }\\ 0&\text{otherwise} \end{cases}\end{equation}
Comparison of visual servoing grasping methods.

Convergence curves of grasping error, (a) X error, (b) Y error, (c) Z error, (d) θ error.

The task success rate (TSR) is calculated by Eq. (31):
 \begin{equation}{\textrm{TSR}}=\frac{1}{N}\sum _{i=1}^{N}\text{succes}{\textrm{s}}_{i}\times 100\mathrm{\% }\end{equation}
where the position threshold d th = 0.01 m, the angle threshold θ th = 5°, the time limit T max = 5 s, and the stable holding time t hold = 1 s.
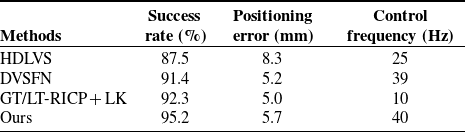
Furthermore, our method is directly compared with other existing visual servoing grasping approaches, as detailed in Table VIII. It can be seen that although the hybrid deep learning visual servoing (HDLVS) method proposed by Botezatu et al. [Reference Botezatu, Iancu and Burlacu28] can meet real-time requirements, its success rate and positioning accuracy need to be improved. The deep visual servoing feature network (DVSFN) method proposed by Luo et al. [Reference Luo, Zhang, Wang and Feng29] performs similarly to our method in terms of real-time capability and positioning accuracy, but still has a lower success rate. The GT/LT-RICP + LK method designed by Ruan et al. [Reference Luo, Ruan, Li and Chen30] combines the global template/local template-based RANSAC and iterative closest point unified algorithm (GT/LT-RICP) with Lucas-Kanade optical flow estimation. Although it has a high success rate and positioning accuracy, its control frequency makes it difficult to meet real-time requirements.
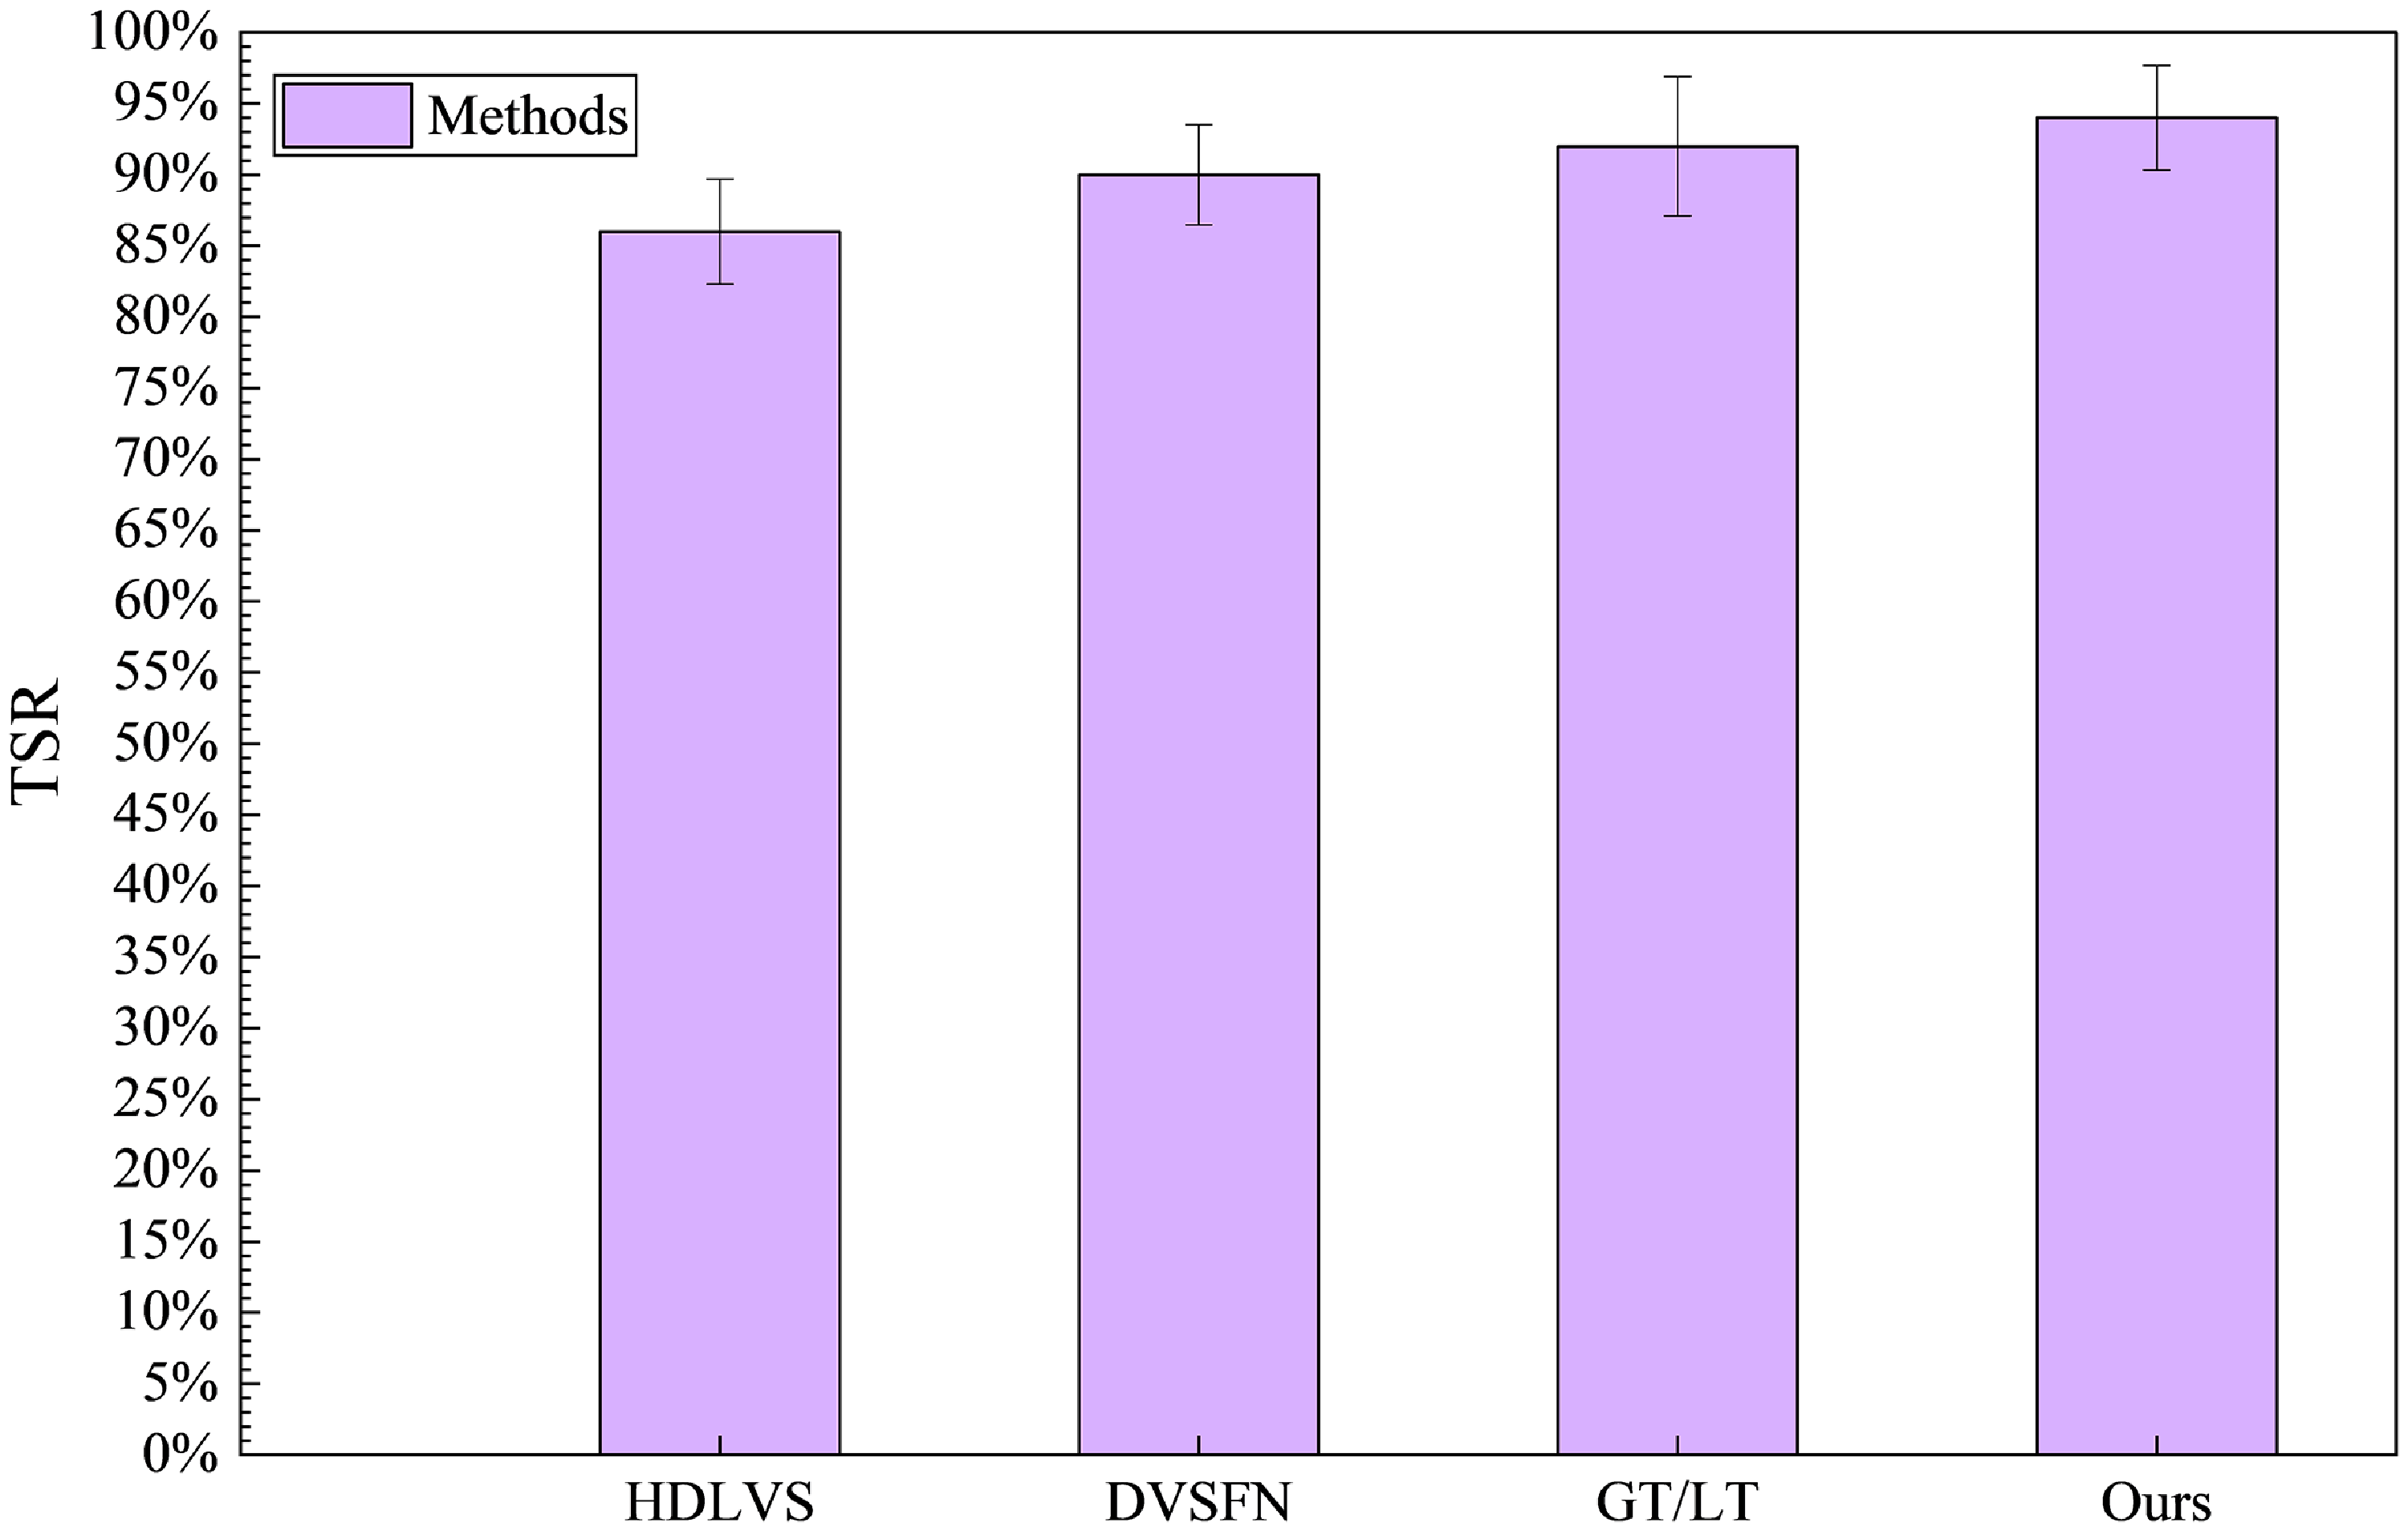
The displacement error curves, velocity error curves, and 3D trajectory comparison diagrams obtained from testing the above four methods are shown in Figures 16, 17, and 18, respectively. Conduct 50 parallel trials for each of the four methods, respectively, and obtain the TSR as shown in Figure 19. As shown in Figure 20, the image sequence of the robot grasping plastic, metal, and glass workpieces, respectively.
Convergence curves of velocity error, (a) vx
error, (b) vy
error, (c) vz
error, (d)
 $\omega$
error.

Trajectory comparison.

Four types of vision servo TSR.

Grasping image sequences.

6. Conclusions
This article addresses the vision-guided grasping tasks of Delta robots in unstructured environments and presents a comprehensive solution based on RGB-D multimodal learning. By integrating the heterogeneous features of RGB images and depth images, and combining an improved Mask R-CNN architecture with the DGA mechanism, it achieves high-precision instance segmentation and robust depth estimation. The key contributions are as follows:
-
1. MMF Architecture: A dual-stream ResNet50-FPN backbone network is designed, achieving cross-modal feature adaptive fusion at the P3-P5 levels through shallow feature sharing and deep modality differentiation. Experiments show that this strategy increases the segmentation mAP@0.5 to 95.2%, an improvement of 10.5% over the single-modal baseline, significantly enhancing the recognition capability for plastic, metal, and glass objects.
-
2. DGA Mechanism: Introducing the cross-modal interaction layer and the gated fusion unit, dynamically weighting geometric and semantic features. Ablation experiments show that the DGA module improves the segmentation IoU from 0.68 to 0.81, effectively alleviating issues of material ambiguity and reflective interference.
-
3. DDE Algorithm: Employing the noise-distance adaptive grid partitioning strategy, the MAE of depth estimation was reduced from 12.3 to 5.7 mm, with the SD decreasing by 63%. The use of inverse variance weighted median filtering helped to suppress the effects of sensor noise and depth fluctuations.
-
4. Real-time Visual Servo Control: Combining the PD control law with Jacobian kinematic mapping, stable tracking of the EE trajectory is achieved. The system has an end-to-end latency of 21.8 ms and supports high-frequency control at 40 Hz, meeting the real-time requirements of industrial scenarios.
This study provides reliable technical support for the autonomous operation of robots in the intelligent manufacturing industry, enhancing the practical applicability of visual servo methods in robotics and promoting their large-scale application in scenarios such as electronic assembly and logistics sorting. Although the methods presented in this paper have achieved significant improvements in accuracy and efficiency, future exploration could focus on compressing model parameters through neural architecture search to create lightweight algorithms; integrating tactile/force feedback to construct a visual-force control closed loop, thereby enhancing the safety of grasping deformable objects; and studying temporal feature fusion and predictive control algorithms for high-speed moving targets to overcome existing frame rate limitations.
Author contribution
Puxuan Ning developed the MMF module, DGA mechanism, DDE algorithm, and real-time control for the robot, implemented the applications, and wrote the article. Jiangping Mei contributed to supervision, technical correction, and verification of the robot’s algorithms and control, as well as the analysis of the results. Jinlu Ni conceived and led the robot development project and secured funding. Peichen Liu contributed to the revision of the article. Tianlin Wei and Xiaochen Su set up the experimental platform and assisted with experiments. All authors have read and approved the final version of the manuscript.
Financial support
This work was supported by the National Natural Science Foundation of China (Grant No.52375507).
Competing interests
The authors declare no conflicts of interest.
Ethical approval
Not applicable.