INTRODUCTION
Depression is more common in multiple sclerosis (MS) than in many other chronic diseases, with most lifetime prevalence estimates around 50% (Patten & Metz, Reference Patten and Metz1997; Sadovnick et al., Reference Sadovnick, Remick, Allen, Swartz, Yee and Eisen1996). However, after decades of research, it remains unclear what combination of factors is most important in predicting depression, as the consideration of disease factors such as lesion burden, brain atrophy, functional disability, fatigue, and cognitive dysfunction leave a substantial amount of variance unexplained. A recent model developed by Arnett, Barwick, and Beeney (Reference Arnett, Barwick and Beeney2008) proposes that stress, social support, and other factors may moderate the effect of disease factors on depression in MS. However, few studies have been conducted investigating the roles of these potential moderators.
Stress has consistently been shown to be positively associated with depression in MS and effect sizes are typically moderate to large (Aikens, Fischer, Namey, & Rudick, Reference Aikens, Fischer, Namey and Rudick1997; Arnett et al., Reference Arnett, Barwick and Beeney2008; Devins et al., Reference Devins, Styra, O’Connor, Gray, Seland and Klein1996; Gilchrist & Creed, Reference Gilchrist and Creed1994; Kneebone & Dunmore, Reference Kneebone and Dunmore2004; McCabew & De Judicibus, Reference McCabew and De Judicibus2005; Pakenham, Reference Pakenham1999; Patten et al., Reference Patten, Metz and Reimer2000; Ron & Logsdail, Reference Ron and Logsdail1989). While many of these studies have looked at timing and frequency of momentous negative life events, it has been shown that daily events, and how an individual evaluates these events, are more predictive of mental and physical health (Kanner et al., 1981; Lazarus & Folkman, Reference Lazarus and Folkman1984). Furthermore, everyday events and chronic daily stress have been found to increase the risk of MS exacerbations and the development of brain lesions more than acute stress (Mohr, Goodkin, Bacchetti, Boudewyn, Huang, Marrietta, et al., Reference Mohr, Goodkin and Bacchetti2000). The Hassles and Uplifts Scale is one common way of measuring an individual’s evaluation of everyday stressors and positive experiences, as well as recent, more significant life events (Kanner, Coyne, Schaefer, & Lazarus, Reference Kanner, Coyne, Schaefer and Lazarus1981). In the current study, the terms uplifts and positive experiences will be used interchangeably.
Studies using this and similar scales have shown that hassles and uplifts might be part of two separate systems, instead of representing extremes of the same continuum (Maybery, Jones-Ellis, Neale, & Arentz, Reference Maybery, Jones-Ellis, Neale and Arentz2006). For example, uplifts tend to affect only positive mood and hassles only negative mood (Maybery, Reference Maybery2003, Reference Maybery2004). Therefore, the balance between hassles and uplifts appears to provide the most meaningful information. For example, although individuals with many commitments and social connections might have many day-to-day hassles, this might only be a problem if they do not also have enough uplifts to counteract the stressors (Kanner et al., Reference Kanner, Coyne, Schaefer and Lazarus1981). This balance is especially important when studying depression, because work by Clark and Watson (Reference Clark and Watson1991) and others suggests that depression involves low levels of positive affect (PA) and high levels of negative affect (NA). In Clark and Watson’s model, low PA, defined as a lack of positive mood and experience, is unique to depression, while NA is high in both depression and anxiety. This suggests that when studying depression and its predictors, it is crucial to examine positive, as well as negative, experiences. Although depression is the most commonly diagnosed psychological disorder in MS (Arnett et al., Reference Arnett, Barwick and Beeney2008), almost all studies have focused on stress and negative emotionality. More exploration of positive experiences and mood in MS is needed.
The only published study that has examined uplifts independently in MS did not measure depression, but showed that patients experiencing an exacerbation reported fewer uplifts (Warren, Warren, & Cockerill, Reference Warren, Warren and Cockerill1991). Additionally, frequency of uplifts was correlated with positive reappraisal, planful problem solving, and seeking social support. Another study found that the difference between hassles and uplifts correlated with depression in MS patients after controlling for level of disability (Beeney & Arnett, Reference Beeney and Arnett2008).
A few studies on depression in MS have used measures similar to uplifts. Phillips and Stuifbergen (Reference Phillips and Stuifbergen2008) found that more positive experiences predicted lower levels of depressive symptoms in MS patients, even after controlling for functional disability. However, this study used an unstandardized measure of positive experiences. Moore, MacLeod, Barnes, and Langdon (Reference Moore, MacLeod, Barnes and Langdon2006) found that depressed MS patients had fewer positive thoughts about the future, and not more negative thoughts, compared with non-depressed patients. This has also been found in healthy depressed populations (MacLeod & Byrne, Reference MacLeod and Byrne1996). A third study found that reduced depression following phone-based therapy in MS patients was associated with increased benefit-finding (Hart, Vella, & Mohr, Reference Hart, Vella and Mohr2008). This effect was mediated by increased optimism and PA. No studies were found that examined factors that interact with uplifts to predict depression in MS. However, research has been conducted on variables that interact with stress.
One factor that has been shown to interact with stress in predicting depression in healthy individuals is social support. Social support is thought of as a coping resource or a buffer for the effects of stress, much like positive experiences (Cohen & Wills, Reference Cohen and Wills1985). Individuals in unsupportive social relationships have been found to have an increased likelihood of health and mood disturbance following stress (DeLongis, Reference DeLongis1985). In MS, studies have consistently found that social support is associated with lower levels of depression (Feinstein, O’Conner, & Feinstein, Reference Feinstein, O’Conner and Feinstein2002; King & Arnett, Reference King and Arnett2005; McCabe, McKern, & McDonald, Reference McCabe, McKern and McDonald2004; McIvor, Riklan, & Reznikoff, Reference McIvor, Riklan and Reznikoff1984; Schwartz & Kraft, Reference Schwartz and Kraft1999). Pakenham (Reference Pakenham1999) found that in certain patients, social support was a significant predictor of social adjustment to MS after 1 year. Finally, Schwartz and Frohner (Reference Schwartz and Frohner2005) found that more social support was associated with better self-reported mental health, and that it made a significant contribution beyond all related demographic and disease variables.
In summary, although stress and negative events have been thoroughly studied in MS, there is minimal research on these patients’ positive experiences. Positive and negative experiences may contribute uniquely to depression, and therefore both require investigation. Social support has also been shown to affect depression and to interact with stress, yet no studies have looked at the interaction of positive experiences and social support when predicting depression in MS. The current study aims to investigate whether social support can protect against the detrimental effects of having a high level of hassles, a low level of uplifts, or higher hassles than uplifts. We hypothesize that higher hassles, lower uplifts, and more hassles than uplifts will correlate with higher levels of depression and that social support will buffer these effects.
METHODS
Participants and Procedure
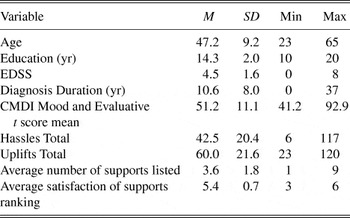
Ninety MS patients described in more detail elsewhere (Beeney & Arnett, Reference Beeney and Arnett2008) participated in the study (see Table 1). Participants were recruited through advertising in a newsletter, recruitment from MS support groups in the central Pennsylvania area, and flyers distributed locally. All participants in the study were initially diagnosed by board-certified neurologists according to the criteria of Poser et al (Reference Poser, Paty, Scheinberg, McDonald, Davis and Ebers1983). Diagnoses were subsequently updated in accord with the criteria of McDonald et al (Reference McDonald, Compston, Edan, Goodkin, Hartung and Lublin2001) criteria and all but two met criteria for MS based on this new system; these two patients met criteria for possible MS. Sixty-nine participants (77%) had a relapsing-remitting course, 17 (19%) had a secondary progressive course, and 4 (4%) had a primary progressive course according to Lublin and Reingold (Reference Lublin and Reingold1996) criteria. Seventy-eight participants (87%) were women and all were Caucasian.
Participant characteristics

Note
CMDI = Chicago Multiscale Depression Inventory (Nyenhuis et al., Reference Nyenhuis, Luchetta, Yamamoto, Terrien, Bernardin and Rao1998); EDSS = Expanded Disability Status Scale.
Participants were excluded if they had any of the following: (a) history of neurological disease other than MS, (b) history of drug or alcohol abuse, (c) history of developmental learning disability, (d) visual or motor disturbances that would prohibit testing without significant alteration of testing procedures, or (e) were currently experiencing a clinical exacerbation. Patients were excluded from the analysis if they were missing half or more of the Hassles and Uplifts or the Social Support Questionnaires (Included patients missed less than two items on average). Eight subjects were excluded from analyses for this reason. When these excluded subjects were compared with the included subjects they had a significantly higher EDSS rating and were more likely to be male. Subjects who had missing data but were still included in the analysis had their Hassles and Uplifts score prorated. One participant listed a satisfaction rating for each individual support listed; in this case support ratings were averaged for each item. Nonhuman supports were not counted (e.g., pets). Graduate students trained by a clinical neuropsychologist (P.A.) administered the tests. Participants were given 75 dollars as compensation for testing. Informed consent was obtained for all participants, and the study was approved by the Behavioral Committee of the University Institutional Review Board.
Measures
Chicago Multiscale Depression Inventory (CMDI)
The CMDI is a self-report questionnaire specifically designed for use in MS and other medical patient groups. The inventory consists of mood (e.g., sad, glum), evaluative (e.g., hated, useless), and vegetative (e.g., sluggish, unable to concentrate) scales of 14 items each. Examinees rate on a scale of 1–5 the extent to which each word or phrase describes them during the past week, including today, where 1 is “Not at All” and 5 is “Extremely.” Higher scores on the CMDI indicate higher levels of depression. The CMDI has been found to be a valid and reliable measure of depression (Nyenhuis, Rao, Zajecka, Luchetta, Bernardin, & Garron, Reference Nyenhuis, Rao, Zajecka, Luchetta, Bernardin and Garron1995; Nyenhuis et al., Reference Nyenhuis, Luchetta, Yamamoto, Terrien, Bernardin and Rao1998) in MS. To eliminate confounds between MS disease symptoms and vegetative depressive symptoms, and to follow the recommendation of Nyenhuis et al (Reference Nyenhuis, Rao, Zajecka, Luchetta, Bernardin and Garron1995) and the precedent of earlier work (Arnett, Higginson, Voss, Bender, Wurst, & Tippin, Reference Arnett, Higginson, Voss, Bender, Wurst and Tippin1999; Arnett, Higginson, Voss, Wright, et al., Reference Arnett, Higginson, Voss, Wright, Bender and Wurst1999), only an index that combined the Mood and Evaluative subscales was included in the analyses.
Hassles and Uplifts Scale (HUS)
The HUS (DeLongis, Reference DeLongis1985; DeLongis, Folkman, & Lazarus, Reference DeLongis, Folkman and Lazarus1988) is a measure of everyday life events designed for a middle-aged population. Participants rate 53 items on a 4-point scale ranging from 0 (none or not applicable) to 3 (a great deal) based on the past month. Each item is rated based on the degree to which it is a hassle, as well as the degree to which it is an uplift. Items are words or phrases and address various life domains including work, family, and finances. The scale shows adequate validity and reliability (DeLongis, Reference DeLongis1985). Separate summed scores were calculated for hassles and uplifts, as well as a difference score (other studies have used such a difference score, e.g., Madu & De Jong, Reference Madu and De Jong2002; Weller & Avinir, Reference Weller and Avinir1993).
Social Support Questionnaire (SSQ)
The SSQ (Sarason, Levine, Basham, & Sarason, Reference Sarason, Levine, Basham and Sarason1983) is a 27-item measure that asks examinees to list the people they can count on in 27 hypothetical situations, and then to rate from 1 to 6 how satisfied they are with their overall level of support in this situation. The measure has been shown to have adequate validity and reliability (Sarason et al., Reference Sarason, Levine, Basham and Sarason1983). A composite score was created by multiplying the average number of supports by the average satisfaction for each item.
Affective Reading Span Task (ARST)
The ARST (Bruce & Arnett, Reference Bruce and Arnett2005) is a performance-based measure designed to assess memory bias for affective words. The test is a modified version of a widely used working memory task (Daneman & Carpenter, Reference Daneman and Carpenter1980). Mildly and moderately depressed MS patients have been shown to have a negative memory bias on this task, while non-depressed patients show a positive bias (Bruce & Arnett, Reference Bruce and Arnett2005). Scores used for this measure were created by combining memory bias Z scores during the task and after a delay. At each time point, the number of negative words recalled was subtracted from the number of positive words recalled. Higher positive scores indicate more positive memory bias. This task and index were chosen because prior work has shown that they are most highly correlated with depression indices in MS (Bruce & Arnett, Reference Bruce and Arnett2005). Thus, the task does appear to be sensitive to negative biases present in depressed MS patients. We, therefore, used the task in the present study so that we could at least partially control for the influence of such biases on self-report measures like those used in our study.
Because depressed individuals have been shown to have negative memory and reporting biases (Gilboa & Gotlib, Reference Gilboa and Gotlib1997; Timbremont & Braet, Reference Timbremont and Braet2004), we entered participants’ ARST scores into the second step of the regression analyses (described below in the “Data Analysis” section) as a way of attempting to control for the influence of this bias on self-report measures. We also ran the same regression analyses without controlling for ARST performance, in case this removed meaningful variance in depression.
Expanded Disability Status Scale (EDSS)
The EDSS is a commonly used disability measure based on ambulation and neurologic symptoms (Kurtzke, Reference Kurtzke1983). Participants are rated from 0 to 10, with higher ratings indicating greater disability. A 0 rating corresponds to no physical disability or disturbance in functional systems, a 9.5 corresponds with extreme functional system disturbance (inability to communicate or eat), and a 10 corresponds with death due to MS. A self-report measure used in other studies (Arnett, Higginson & Randolph, Reference Arnett, Higginson and Randolph2001) was administered. This self-report measure was derived from the EDSS in consultation with a board-certified neurologist. Self-report measures of EDSS have been found to have high intraclass correlations with independent ratings made by neurologists (.84; Solari et al., Reference Solari, Amato, Bergamaschi, Logroscino, Citterio and Bochicchio1993). An experienced neuropsychologist with expertise in MS (P.A.) made the EDSS rating after receiving instruction from a neurologist specializing in MS.
The Hassles and Uplifts Questionnaire, Social Support Questionnaire, and self-report EDSS questionnaire were sent to participants one week before testing and were completed as part of a larger questionnaire packet. Questionnaires were ordered the same way in every packet sent out. The Chicago Multiscale Depression Inventory and the Affective Reading Span were given on the same day as testing and in the same order for all participants.
Data Analysis
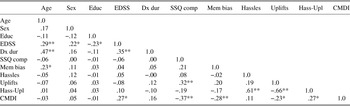
The CMDI Mood and Evaluative scores were converted to t-scores using Nyenhuis et al.’s (Reference Nyenhuis, Rao, Zajecka, Luchetta, Bernardin and Garron1995) healthy controls as the reference point and then averaged. Because the CMDI was found to be non-normally distributed in our sample (Kolmogorov-Smirnov test; p < .01), CMDI scores were transformed using a negative inverse function and this variable was used for correlational and regression analyses. This transformation was used instead of a log transformation because the log transformation did not achieve normality. The total hassles, total uplifts, and composite social support variables were consistent with a standard normal distribution. Relationships among demographic and disease-related variables and depression were assessed, including age, sex, education, gender, diagnosis duration, and EDSS rating (see Table 2). If any demographic or illness variables were significantly associated with the CMDI they were entered into the first step of the regression equation to control for variance associated with these variables. The EDSS was the only variable significantly correlated with the CMDI (.27; p < .05); therefore, it was entered into the first step of the regressions. Depression did not differ significantly between the two most common MS course types.
Correlations among demographic and study variables

Note
Correlations are Pearson’s, unless otherwise specified. EDSS = Expanded Disability Status Scale; SSQ = Social Support Questionnaire; CMDI = Chicago Multiscale Depression Inventory. *p < .05; **p < .01
Separate regression analyses were conducted as follows, with depression as the dependent variable (combined CMDI Mood and Evaluative score): Step 1: Relevant demographic and illness variables; Step 2: ARST memory bias score; Step 3: SSQ composite score; Step 4: Hassles, Uplifts, or difference score; Step 5: Interaction term (hassles × social support, uplifts × social support, or difference × social support). Multicollinearity statistics were examined for the regression models and these suggested that multicollinearity was not problematic. The Variable Inflation Factors (VIF) ranged from 1.0 to 1.2 (should not be greater than 6 or 7) and tolerance values ranged from .86 to .99 (values should be near 1).
RESULTS
Regression Analyses
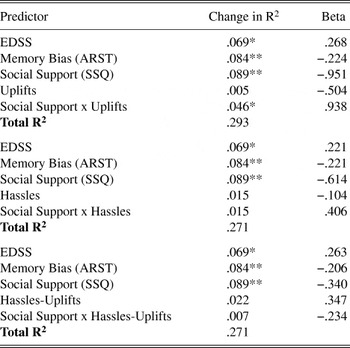
The results of the regression analyses are shown in Table 3. The EDSS score explained 6.9% of the variance in depression, memory bias an additional 8.4% and social support an added 8.9%. All represented significant increments in variance accounted for. Uplifts, hassles, and the difference score did not explain significant amounts of variance in depression. Although the interaction of social support with hassles or the difference score was not significant, the same interaction with uplifts was, and accounted for nearly an additional 5% of the variance in depression scores. The same pattern of findings was found when Z scores of hassles and uplifts were used instead of raw scores. The same regression analyses were run without controlling for ARST response bias and the same pattern of results was found, with no significant changes in R2 change for the main effects of hassles, uplifts, the difference score or the interaction terms.
Regression analysis of the effects of uplifts/hassles and social support on depression

Note
Since it is possible that controlling for Memory Bias removed some meaningful variance from depression, the same regression was run without controlling for Memory Bias and the pattern of results and general significance levels did not change.
*p < .05; **p < .01
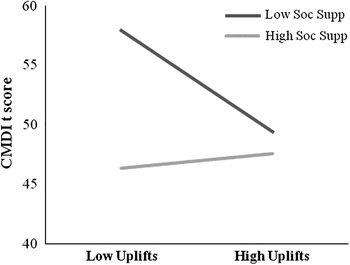
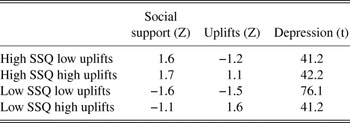
A graph of the interaction was created by plotting two regression lines; one that was one standard deviation above the mean on social support and one that was one standard deviation below the mean (see Figure 1). The data points for these lines were one standard deviation above and below the mean of uplifts. As demonstrated by the graph, patients who reported high uplifts showed low levels of depression (below a t-score of 50) regardless of their level of social support. However, patients who reported low uplifts who also reported low social support were significantly more depressed. This fits our hypothesis that social support would act as a buffer against low uplifts. See Table 4 for data from four specific individuals that illustrate further the relationship between these measures. These individuals’ scores demonstrate that a low level of uplifts is only detrimental in the face of low social support, and that it is this combination of low uplifts and low social support that is uniquely associated with depression.
Interaction between uplifts and social support. CMDI = Chicago Multiscale Depression Inventory.

Uplifts, social support, and depression scores for four selected participants

Note
SSQ = Social Support Questionnaire.
DISCUSSION
This study was designed to examine whether social support buffered the negative effects of stress and a lack of positive experiences in MS patients. The first hypothesis was that higher hassles, lower uplifts, and higher hassles than uplifts would correlate with higher depression scores. While uplifts and the difference between hassles and uplifts were correlated with depression, hassles alone were not. This suggests that in this sample, a participant’s report of uplifts was particularly related to depression and their report of hassles was most important in terms of its relative level compared with uplifts. However, as is seen in the regression analyses, these corelations were no longer significant after controlling for EDSS, ARST, and Social Support (see Table 3). The second hypothesis was that social support would buffer the detrimental effects of high hassles, low uplifts, and higher hassles than uplifts. We found that, although social support did not interact with hassles or the difference between hassles and uplifts, it did interact significantly with uplifts to predict depression.
This latter finding is inconsistent with past findings of social support buffering stress (Cohen & Wills, Reference Cohen and Wills1985) and uplifts only affecting positive mood (Maybery, Reference Maybery2004). However, it does fit with past studies reporting that social support was more related to positive than negative life events (Sarason et al., Reference Sarason, Levine, Basham and Sarason1983). Sarason and colleagues suggested that “people high in social support are more optimistic about their current life situation than those low in social support.” However, such a finding might be due to a reporting bias, given that measures of social support and optimism in their study involved self-report and thus both could be affected by the same bias.
In contrast, the present study attempted to control for possible subjective bias by entering the objective memory bias score from the ARST, our performance-based measure of affective bias, in the regression before examining the other effects. Given that we controlled for this and still found significant effects, it is more likely that patients high in social support actually perceive their daily life as being more uplifting, and are not just preferentially remembering positive events due to a self-report memory bias. It is also possible that individuals who have or perceive more positive experiences are more likely to seek out social support or at least to perceive themselves as having more, and more satisfying, supports. Similarly, it is possible that individuals who are more depressed might seek out or perceive less social support or seek out or perceive fewer uplifting events. As in any correlational study design, we are not able to infer causality from our analyses. However, we believe that by controlling for scores on a performance-based measure like the ARST we have taken an additional methodologically rigorous step that, to our knowledge, no prior studies have taken. While we most likely did not control for all recall biases with this task, this step does make us more confident that the results are not solely due to bias inherent in self-report measures.
Our findings may also reflect patients’ level of engagement with the environment; high levels of uplifts may reflect involvement and low uplifts disengagement. Thus, if patients are not engaged with their environment, and also do not have social supports, they might be more likely to be depressed. But if they already have social supports with which they are satisfied, it may be less important for them to seek out other positive experiences. Furthermore, patients who are low in both uplifts and social supports might have the lowest level of engagement, suggesting the highest risk for depression. This could be important clinically, as it would indicate the use of strategies that facilitate behavioral activation and engagement as a useful tool for treating depression in these patients. This is supported by previous studies showing the utility of cognitive behavioral therapy in this population (Mohr & Goodkin, Reference Mohr and Goodkin1999; Mohr et al., Reference Mohr, Hart, Julian, Catledge, Honos-Webb and Vella2005; Moran & Mohr, Reference Moran and Mohr2005). Clinicians working with this population might be more comfortable using cognitively based treatments that involve improving coping skills in response to stressors, and might even be hesitant to use behavioral techniques because of their awareness of patients’ disease-related limitations. However, our results suggest that it may be important for clinicians to also consider behavioral approaches that encourage patients to actively seek out positive experiences and to engage with their environment.
The current study has several limitations. For one, the EDSS was scored by self-report and not by a neurologist; however, other studies have also used this method (Arnett et al., 2001), and self-report measures of the EDSS more generally have been shown to correlate as highly with neurologist ratings as the latter correlate with one another (Solari et al., Reference Solari, Amato, Bergamaschi, Logroscino, Citterio and Bochicchio1993). Depression was also measured via self-report and not with a structured diagnostic interview. However, reporting biases were controlled for using the ARST and the CMDI is a well-validated measure that allows for the removal of potentially confounded vegetative symptoms. Recruitment through a newsletter and support groups raises the possibility of selecting participants who are more involved in the MS community and more socially active; however, there was still meaningful variance in the social supports measure and patients were also recruited using flyers. Finally, subjects excluded from the analyses due to missing data were found to have significantly higher EDSS scores and were more likely to be male than those included in the analyses. Participants who were more impaired might have had more trouble completing all of the questionnaires and tasks because of fine motor writing limitations, fatigue or other disease-related factors. This non-random missing data might limit the generalizability of our findings to more severely disabled male patients.
In summary, the current study highlights the importance of studying positive experiences along with stress and negative events in MS (see MacLeod & Moore, Reference MacLeod and Moore2000 for an argument for a two-dimensional approach to research and therapy in healthy individuals). Our study also demonstrates one possible strategy for controlling for negative reporting biases in depressed patients that might artifactually result in associations between self-report measures, by using an objective performance-based measure to control for such bias. Methods such as these might prove most useful in studies that otherwise rely solely on self-report measures.
ACKNOWLEDGMENTS
Special thanks to Dr. Brian Alstrom and other neurologists in Central Pennsylvania who contributed their time to verifying MS diagnoses and ratings of course for the MS participants in the project. We also thank Fiona Barwick, Amanda Rabinowitz, Jared Bruce, Erica Eber, Kristin King, Andrae Laws, Sopheavy Lim, Dawn Polen, Megan Smith, Erin Stover, Lauren Strober, and Megan Wagner for their help with various aspects of the project. These data, in part, were presented at the 37th annual meeting of the International Neuropsychological Society in Atlanta, Georgia. The authors have no financial disclosures.