It is an honor and a pleasure to discuss the future of economic history as we celebrate the 75th anniversary of the Economic History Association. It is surely foolhardy to speculate on where the profession will go in the next 75 years other than to state the obvious—“into the past.” Let me instead focus on a slightly less heroic prediction and offer some perspective on what we will likely see over the next decade.
One could imagine several ways to think about future directions for the field, such as who will participate, how we will relate to other fields, what will the demand for our skills be, and what sorts of questions will interest economic historians. Although these are all worthy of conjecture, I have chosen to focus on methodology because I anticipate that new technologies are changing methodology in ways that will leave an indelible mark on our future output—that is, the papers we will be writing. Even with respect to how we carry out our craft, I will only focus on empirical methods since this is likely where technological breakthroughs hold out the most promise for revolutionizing our profession. That said, as we know from our field's own past, theory was the capable and necessary partner of “metrics” in the Cliometric Revolution that began in the 1950s, and it surely will be an equal partner in the future.Footnote 1 It would be illuminating to ruminate on the how new theories will also shape our field, but discussing both is beyond the scope of this brief note.
My primary conjecture is that we are entering a new era of empirical economic history that may be just as revolutionary as the original Cliometric Revolution, what I will call 4D economic history, Digitally-Driven Data Design. 4D economic history is already upon us, so let me outline what it is and how I think it will shape our practice and understanding of economic history. It is empirical research drawing on the use of large collections of digitized historical records coupled with a keener use of our econometric toolkit to answer causal questions and counterfactuals. The Cliometric Revolution ushered in an era of massive methodological change within the field of economic history, demonstrating how quantitative analysis and economic theory could be combined to advance our understanding of history. Increased computing power, more sophisticated software and improved technique allowed researchers to examine history in new ways. I believe we are now entering a second era—when technological change will once again revolutionize the way we carry out our craft. The declining costs of the mass digitization of maps, government reports, probates, censuses, and many other archival documents alongside improved algorithms for searching these records and viewing data spatially is changing the way we conduct our research as well as the expectations about what we can discover about the past.
Large-scale digitization involved resources, time and research budgets, that put it beyond the reach of the average economic historian. Economic historians are quite familiar with IPUMS, the integrated public use microdata series. This represents the pinnacle of the era of high-cost digitization. Indeed, we are still reaping enormous gains from IPUMS as more U.S. censuses become available, as individual household records are linked together through time, and as researchers further develop toolkits that help us navigate the ever-expanding supply of census data.Footnote 2 IPUMS and the research projects it has spawned serve as harbingers as to how 4D economic history will re-shape our field. However, the reach of 4D economic history has the potential to be much broader and aid economic historians who work on subject areas outside of IPUMS traditional domain, including (but not limited to) financial history, trade, and macroeconomics. What makes this possible is the dramatic decline in the costs of digitization. They are falling quickly enough that 4D economic history will be within the reach of most economic historians by the end of the decade, if it is not already. We are beginning to observe how economic historians are taking advantage of the era of mass digitization by applying new methods and techniques to these massive digital data sets to study issues as diverse as transportation networks and plagues.Footnote 3 These forces will only gain momentum over the next decade.Footnote 4
Some will argue that this is simply “Big Data.” It is true that Big Data contains some of what I have in mind, in so far as it lets us re-imagine just how big “n” (units, households, etc.) and “t” (time) can be through the utilizing enormous amounts of online information. In addition, it will eventually be the case that as households' economic and social activities have a more visible web presence, and Big Data will allow economic historians to look back at this current period of history as well as future ones with new found precision.Footnote 5 However, I am not sure that Big Data, version 1.0, fully encompasses what economic historians do and what economic historians seek to learn. At least as it is currently practiced outside of academia, today's Big Data typically employs vast amounts of information from the web to reveal simple correlations, declare “truth” (at least for the 24 hours the results are still fresh), and then move onto the next question du jour. No doubt there are some current practitioners who warrant the title “data scientists,” but since economic historians have long been the guardians of careful and thoughtful data collection and analysis, since we care about context, and since we look to unearth answers to questions of enduring interest, I am not quite ready to hitch my horse to today's Big Data chariot and will proceed, for at least a few more years, with this distinction in nomenclature.
So what is the utility of 4D economic history? Given the diversity of topics and sub-fields we aim to understand in economic history, the question will surely differ for each practitioner. Thus, let me attempt to discuss its utility by illustrating how it is re-shaping how I think about research. I will draw on some examples from macroeconomic and financial history, areas in which I conduct research. These examples illustrate two of its important properties. First, as I stated earlier, returns to practicing 4D economic history will not simply accrue to those interested in microeconomics, where applications might seem more readily apparent. Second, this new era represents more than just big “n” or big “t” analysis. To illustrate its utility and these properties, I will discuss a few examples of recent or ongoing research.
One clear application of digitally-driven data design is to examine classic questions with new data tools and technique, and harness technology in a way that previous generations of scholars could have only dreamed of doing. For example, consider one of the most famous conjectures from macroeconomic history—Milton Friedman and Anna Schwartz's thesis on the Great Depression, found in the Monetary History of the United States. More than 50 years ago, they made use of narrative evidence from contemporary newspaper reports as well as macroeconomic time series data to argue that banking distress contributed to a decline in monetary aggregates, thus worsening the Great Depression by causing prices and output to decline. They argued that a “contagion of fear” swept the country, with depositors running banks in increasing numbers once panics began in the fall of 1930, and that if the Federal Reserve System had provided liquidity to these distressed banks and stopped the panics, monetary aggregates would have not declined by as much and the Depression would have been less severe.
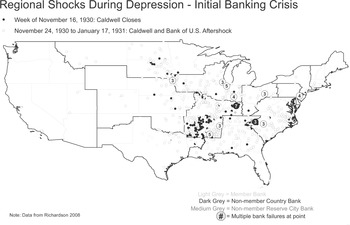
Their book launched numerous follow up studies, with some scholars disputing the degree to which the banking distress itself, rather than declining income, was responsible for the contraction in economic activity.Footnote 6 These debates have remained unresolved, in part because the evidence mustered at the time was insufficient to show whether contagion was an important source of banking distress. In ongoing work with Gary Richardson, we are using digitally-driven data design—4D economic history—to revisit this debate. We have digitized bank examiners' reports for banks that suspended operations during the 1930s, and have created geographically-specific information on the location, timing, and causes of banking distress for the Great Depression. Using algorithms that take advantage of the geographic information, we can determine if these bank suspensions were part of local, regional, or national panics, allowing us to pinpoint banks that fit the type of distress Friedman and Schwartz discussed much more accurately than the aggregate series they employed.Footnote 7 Figure 1, showing the Caldwell Panic of 1930, illustrates how the decline in the costs of digitization enables us, and researchers more generally, to assemble data in new ways and that re-examine historical episodes with new tools. Digitized examiners reports and GIS-coded data allow us to distinguish: (1) which banks suspended (as opposed to failed); (2) why and when they suspended; and (3) whether they were involved in bank runs and panics. Combining this information with econometric analysis will enable us to provide more precise estimates of how much of the decline in the money multiplier, and therefore the decline in monetary aggregates, is directly attributable to abrupt changes in depositor behavior, i.e., that associated with the contagion of fear they discussed. Revisiting previous scholarship has always been an important part of scholarly activity, but 4D economic history will allow scholars to do so in new and creative ways.
BANK SUSPENSIONS DURING THE FIRST BANKING CRISIS OF THE GREAT DEPRESSION

4D economic history also helps us re-imagine the past. Periods of dramatic upheaval are important for understanding history as well as economic development, but they pose unique challenges to quantitative researchers who want to examine data in a consistent way. The problem becomes tractable with 4D economic history as digitization of historical maps and Geographic Information Systems (GIS) software allow researchers to interpret or re-interpret historical boundaries. Researchers can use now “freeze” boundaries that existed prior to upheaval, and then create maps based on geographical units that can be used consistently to trace economic benchmarks over time and to pose spatial as well as econometric counterfactuals. For some applications of these techniques to history, see Saumitra Jha, Kris James Mitchener, and Masanori Takashima (Reference Jha, Mitchener and Takashima2015) on the transition from feudal to Meiji Japan and Christoph Koenig (Reference Koenig2015) on Imperial and Weimar Germany.
4D economic history also lends itself to new types of interdisciplinary collaboration. Our tribe has been particularly adept at drawing on metaphors, tools, and theory from a variety of disciplines. As my final example illustrates, however, the possibilities are much broader and could encompass researchers from fields as diverse as epidemiology, archaeology, political science, and law. Indeed, a team of researchers is using computational linguistics to ask new questions about macroeconomic policymaking. We can teach computers to recognize patterns in language, “learn” those patterns, and generate new data sets of interest. With vast amounts of recorded transcripts now at our disposal, we are able to revisit the discussions of market participants and policymakers in ways we could never have imagined doing even 20 years ago.
To be concrete, theoretical and empirical macroeconomics has been rather mute in exploring critical aspects of how the design of central banks might affect policy rates (i.e., short-term interest rates). While macroeconomists examine changes in these rates, the composition of the committees that make these decisions and the environment under which they meet and discuss policy have been relatively underexplored. Given how much attention financial markets pay to central bank interest-rate deliberations, it is somewhat surprising that academics have not devoted more attention to opening this black box and quantifying which aspects matter.
Stephen Hansen, Michael McMahon, and Andrea Prat (Reference Hansen, McMahon and Prat2015) are using digitized versions of the Federal Open Market Committee (FOMC) deliberations and computational linguistics to understand issues related to institutional design of central banks, and in particular, the role of transparency in interest-rate deliberations. Their toolkit allows them to analyze the effect of changing the amount of transparency, something that would have been extremely difficult to quantify relying on a purely narrative approach, and without interdisciplinary collaboration, mass digitization, and new empirical methods. As the authors point out, a tradeoff may exist between discipline and conformity: transparency makes policymakers work harder and behave better but it can also stifle discussion.
To analyze this issue, they exploit a natural experiment—a historical accident—that led to a full reporting of FOMC transcripts in two periods—one when policymakers had no idea their verbatim discussions were being recorded or eventually made public (prior to November 1993) and one when they knew that their discussions would eventually be made public (thereafter). To test for the effect of changing the amount of transparency, they apply computational linguistic algorithms, such as Latent Dirilecht Allocation. This particular algorithm allows them to examine unlabeled text from the digitized FOMC records, search for hidden themes, and construct measures of communication that can serve as their dependent variables in their analysis.Footnote 8
Let me conclude by conjecturing that digitally-driven data design offers the potential to reinvigorate our field, make startlingly new observations about the past, and allow thousands of more flowers to bloom. 4D economic history has the possibility of drawing in scholars from other fields to study of the past and attracting a broader range of students interested in studying our discipline.