Introduction
Thermal stability is one of the most important attributes of any material used in manufacturing of electronic devices. Thermal stability is even more important in various nanotechnologies, as the nanomaterials are typically characterized by lower melting points compared to their counterpart bulk materials.[Reference Navrotsky1, Reference Alarifi, Atiş, Özdoğan, Hu, Yavuz and Zhou2]
Two-dimensional (2D) titanium carbides Tin+1Cn are relatively new nanomaterials that belong to a large family of MXenes—transition metal carbides and nitrides with a thickness from 3 atomic layers and more.[Reference Naguib, Kurtoglu, Presser, Lu, Niu, Heon, Hultman, Gogotsi and Barsoum3] Recent studies have revealed extraordinary electrical and electrochemical properties of MXenes, which, together with their unique 2D structure and hydrophilicity make them promising materials for supercapacitors, Li and beyond lithium batteries, hydrogen storage, optical and THz applications[Reference Dong, Chertopalov, Maleski, Anasori, Hu, Bhattacharya, Rao, Gogotsi, Mochalin and Podila4, Reference Li, Kushnir, Dong, Chertopalov, Rao, Mochalin, Podila and Titova5] and environment sensing,[Reference Chertopalov and Mochalin6] triboelectric energy generation and harvesting, etc.[Reference Er, Li, Naguib, Gogotsi and Shenoy7–Reference Dong, Mallineni, Maleski, Behlow, Mochalin, Rao, Gogotsi and Podila12] Besides this, due to their high mechanical properties, namely high Young's modulus[Reference Lipatov, Lu, Alhabeb, Anasori, Gruverman, Gogotsi and Sinitskii13–Reference Ning, Yu, Sanaz and Mohsen Asle16] and bending rigidity exceeding that of monoatomic layer materials such as graphene or hexagonal boron nitride,[Reference Kurtoglu, Naguib, Gogotsi and Barsoum14, Reference Borysiuk, Mochalin and Gogotsi17] MXenes are advantageous for applications in composites, sensors, and resonators where high frequency of vibrations is required. Thus, the investigation of thermal properties and determination of the range of temperatures where MXenes preserve their 2D structure is an important task.
Experimental studies of thermal stability of Ti2C and Ti3C2 MXenes are presented in Refs. Reference Li, Du, Huo, Wang and Cui18 and Reference Li, Wang, Sun, Zhang, Liu, Hu and Zhou19, where authors studied thermal stability, phase transformations, and oxidation of MXenes terminated with F and OH surface functional groups during heating under oxygen and argon atmospheres. According to Ref. Reference Li, Wang, Sun, Zhang, Liu, Hu and Zhou19 Ti3C2 MXene with F/OH surface terminations is stable under argon atmosphere at temperatures up to 800°C. At the same time, the authors reported that at 200°C under oxygen atmosphere MXene was partially oxidized forming anatase nano-crystals distributed on Ti3C2 layers. At 1000°C under oxygen atmosphere, complete oxidation of MXene layers and transformation of anatase phase to rutile were observed. Experimental studies of Ti2C MXene reported in Ref. Reference Li, Du, Huo, Wang and Cui18 show the formation of anatase TiO2 on Ti2C MXene at lower temperature (500 K), followed by transformation to rutile at higher temperatures.
However, no data on thermal stability of pristine bare Tin+1Cn MXenes with exact determination of the temperature stability range were reported so far.
In this paper we present an in silico study of the thermal behavior of three Tin+1Cn MXenes with n = 1, 2, 3 using classical molecular dynamics (MD) simulations. MD simulations are widely used for investigation of thermal behavior of various nanomaterials such as metallic nanoparticles,[Reference Alarifi, Atiş, Özdoğan, Hu, Yavuz and Zhou2, Reference Yang, Yang and Xu20] carbon nanotubes,[Reference Zhang, Stocks and Zhong21] and 2D crystals[Reference Los, Zakharchenko, Katsnelson and Fasolino22, Reference Singh, Neek-Amal, Costamagna and Peeters23] as they provide unique atomistic level insights into the melting processes that occur at the nanoscale.
Until recently, the main problem with classical MD simulations of MXenes was the absence of the reliable forcefield that would accurately reproduce interactions between the atoms of elements typically found in MXenes (e.g., Ti, C, O, H, F). Recent parameterization of the Reactive Force Field (ReaxFF)[Reference Osti, Naguib, Ostadhossein, Xie, Kent, Dyatkin, Rother, Heller, van Duin, Gogotsi and Mamontov24–Reference Lotfi, Naguib, Yilmaz, Nanda and van Duin26] now allows precise description of chemical bonding in MXenes, however ReaxFF is quite complex, and thus modeling of large samples requires significant investments in computational power. In the proposed study we used a simpler approach formulated in Refs. Reference Borysiuk, Mochalin and Gogotsi15 and Reference Borysiuk, Mochalin and Gogotsi17 based on the combination of interatomic potentials, which allows inexpensive large-scale MD simulations of Tin+1Cn MXenes. To detect the phase changes and estimate the range of thermal stability of the samples, quantitative structural parameters such as Lindeman indexes[Reference Zhang, Stocks and Zhong21] were calculated in the considered range of temperatures. To validate obtained data, the temperature dependencies of the potential energies and radial distribution functions (RDF) were also computed.
It is worth mentioning that oxidation of Ti3C2 MXene with surface groups at various temperatures and in different environments was recently studied by ReaxFF MD simulation,[Reference Lotfi, Naguib, Yilmaz, Nanda and van Duin26] which allows for formation and breaking of chemical bonds accompanying chemical and physical transformations in the system. Within our simulations we did not consider phase transformations and formation of new compounds during heating, as our aim was to detect the range of temperatures within which the Tin+1Cn samples preserve their 2D sheet-like structure. Even though we used simple MD approach, our study provides new data that may become a useful first-order approximation for further investigations of thermodynamic properties of MXenes and for the design of novel electrical and mechanical devices incorporating these 2D materials.
Simulation setup
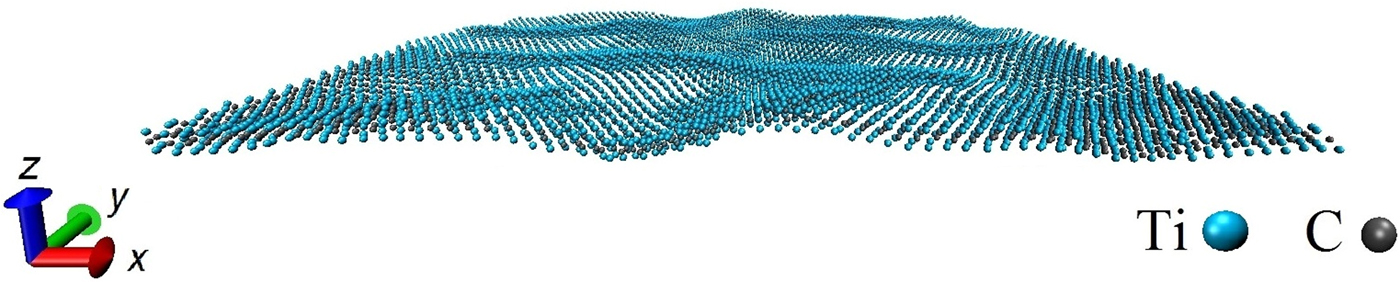
We consider rectangular Tin+1Cn nanosheets with n = 1, 2, 3 and lateral size 20×17 nm in a Cartesian coordinate box with periodic boundary conditions in the xy direction and free boundary condition in the z direction. An example typical configuration of the system is shown in Fig. 1 (all MD snapshots in this paper were produced using Visual Molecular Dynamics software[Reference Humphrey, Dalke and Schulten27]). Previously developed in-house code for parallel computing was employed to calculate the interatomic forces between atoms in the samples during heating. Detailed description of the developed approach and corresponding interatomic potentials can be found in Refs. Reference Borysiuk, Mochalin and Gogotsi15, Reference Borysiuk, Mochalin and Gogotsi17 and Reference Oymak and Erkoc28, Reference Zhou, Wadley, Johnson, Larson, Tabat, Cerezo, Petford-Long, Smith, Clifton, Martens and Kelly29, respectively.
Typical configuration of Ti2C nanosheet at T = 300 K used in this study.

Heating of the Tin+1Cn nanosheets was simulated by increasing temperature using Berendsen thermostat,[Reference Berendsen, Postma, Vangunsteren, Dinola and Haak30] according to the scheme described in Ref. Reference Alarifi, Atiş, Özdoğan, Hu, Yavuz and Zhou2. Temperature of the samples was increased from the initial value of 300 K in 50 K increments. Similar to Ref. Reference Alarifi, Atiş, Özdoğan, Hu, Yavuz and Zhou2, at each particular temperature the system was simulated for 100,000 MD steps ( ≈ 20 ps), during which all data required for calculation of the structural parameters were recorded. Then the temperature was increased to the next value and the procedure repeated. Around the thermal degradation point the temperature increment was reduced to 10 K for a better accuracy.
To characterize MXene stability and thermal degradation we calculated the Lindeman indexes. Lindemann index is a commonly used parameter in MD simulations of melting processes. It indicates changes in crystal structure of the sample due to thermal disorder. The local Lindemann index q i of an atom i is defined as[Reference Zhang, Stocks and Zhong21]:
 $$q_i = \displaystyle{1 \over {N-1}}\sum\limits_{\,j\ne i} {\displaystyle{{\sqrt {\langle{r_{ij}^2} \rangle -{\langle{r_{ij}} \rangle} ^2}} \over {\langle{r_{ij}} \rangle}}}, $$
where r ij is a distance between atoms i and j, and angle brackets indicate time average at constant temperature. Lindemann index q of a sample consisting of N atoms can be estimated by averaging over all atoms in the system.
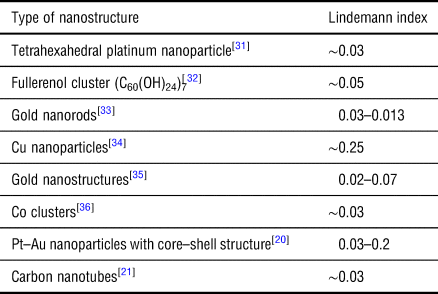
The melting point of the sample can be determined from the critical value of the Lindeman index q c. The range of values q c ≈ 0.1–0.15 is typically used as a melting criterion for bulk solid structures. However, in recent studies of nanomaterials, a significantly lower value q c ≈ 0.03 was proposed for determination of the melting points of nanosized samples, e.g., carbon nanotubes.[Reference Zhang, Stocks and Zhong21] Moreover, in MD simulations of melting of various nanostructures presented in the literature, the melting points were observed at values close to q c ≈ 0.03 (see Table 1 and related references), thus it seems reasonable to use this value as an indicator of thermally induced degradation for Tin+1Cn nanosheets. Besides the actual value of the Lindemann index, its temperature dependence also provides information about melting of the sample. It is known that at low temperatures the Lindemann index is small and slowly increases in nearly linear manner with the temperature. At the onset of melting, q is expected to switch to nonlinear increase with temperature. Thus, examining the magnitude and critical behavior of the Lindeman index obtained from Eq. (1), it is possible to estimate the melting point of the sample. To further elucidate structural changes, temperature dependences of the potential energy and RDF below and above the thermal degradation temperature were also calculated.
Approximate values of Lindemann indexes for various nanostructures near their melting points

Results and discussion
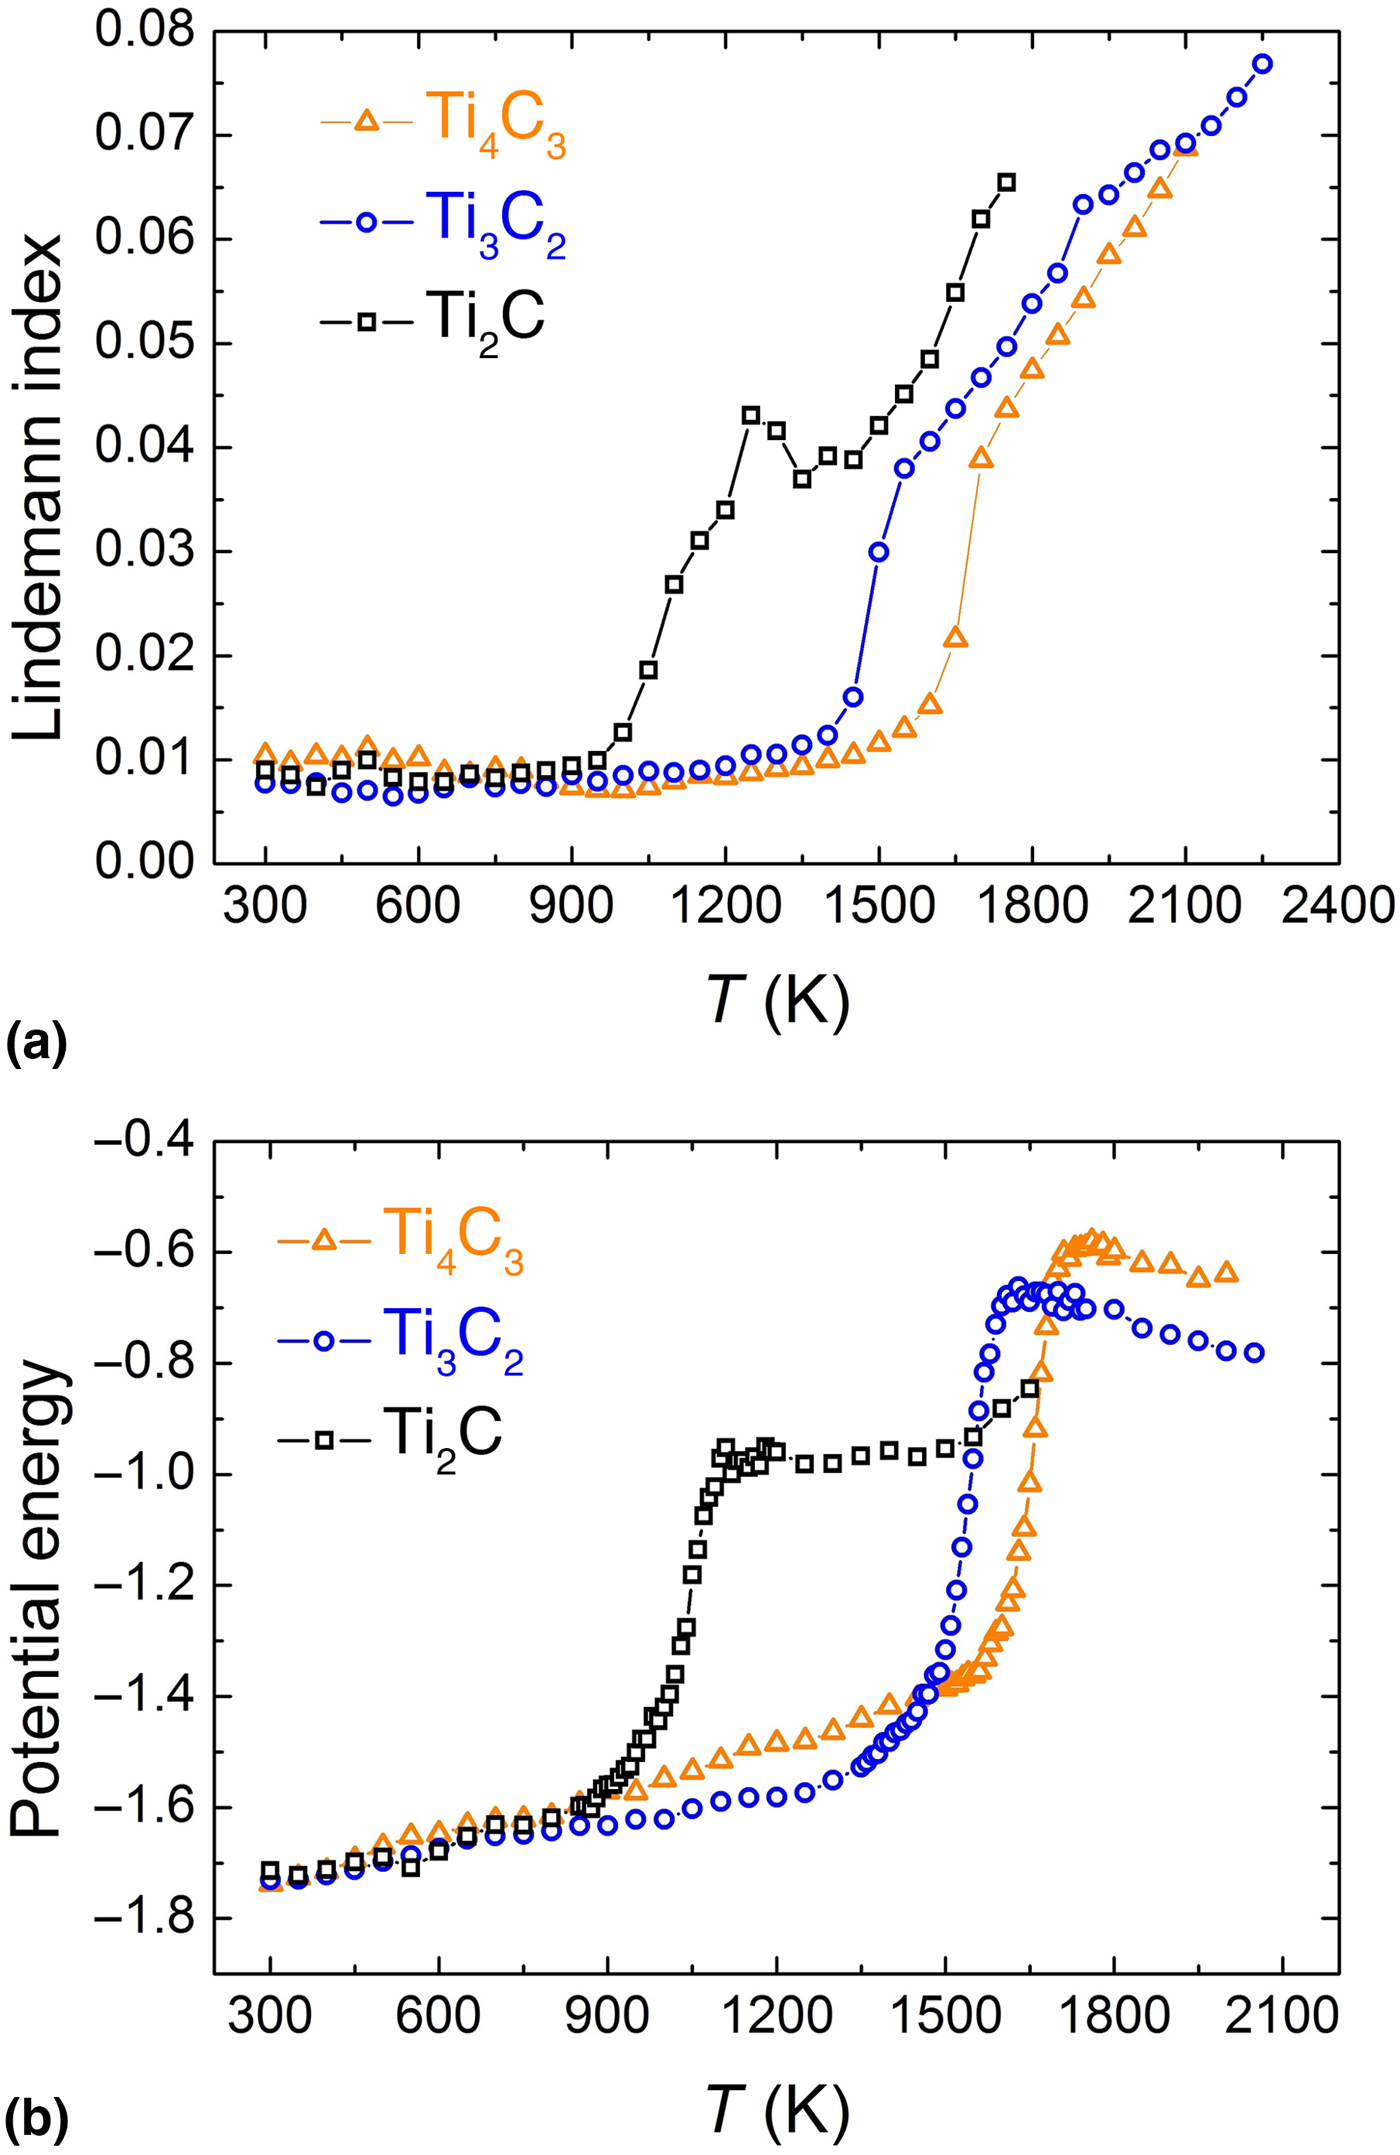
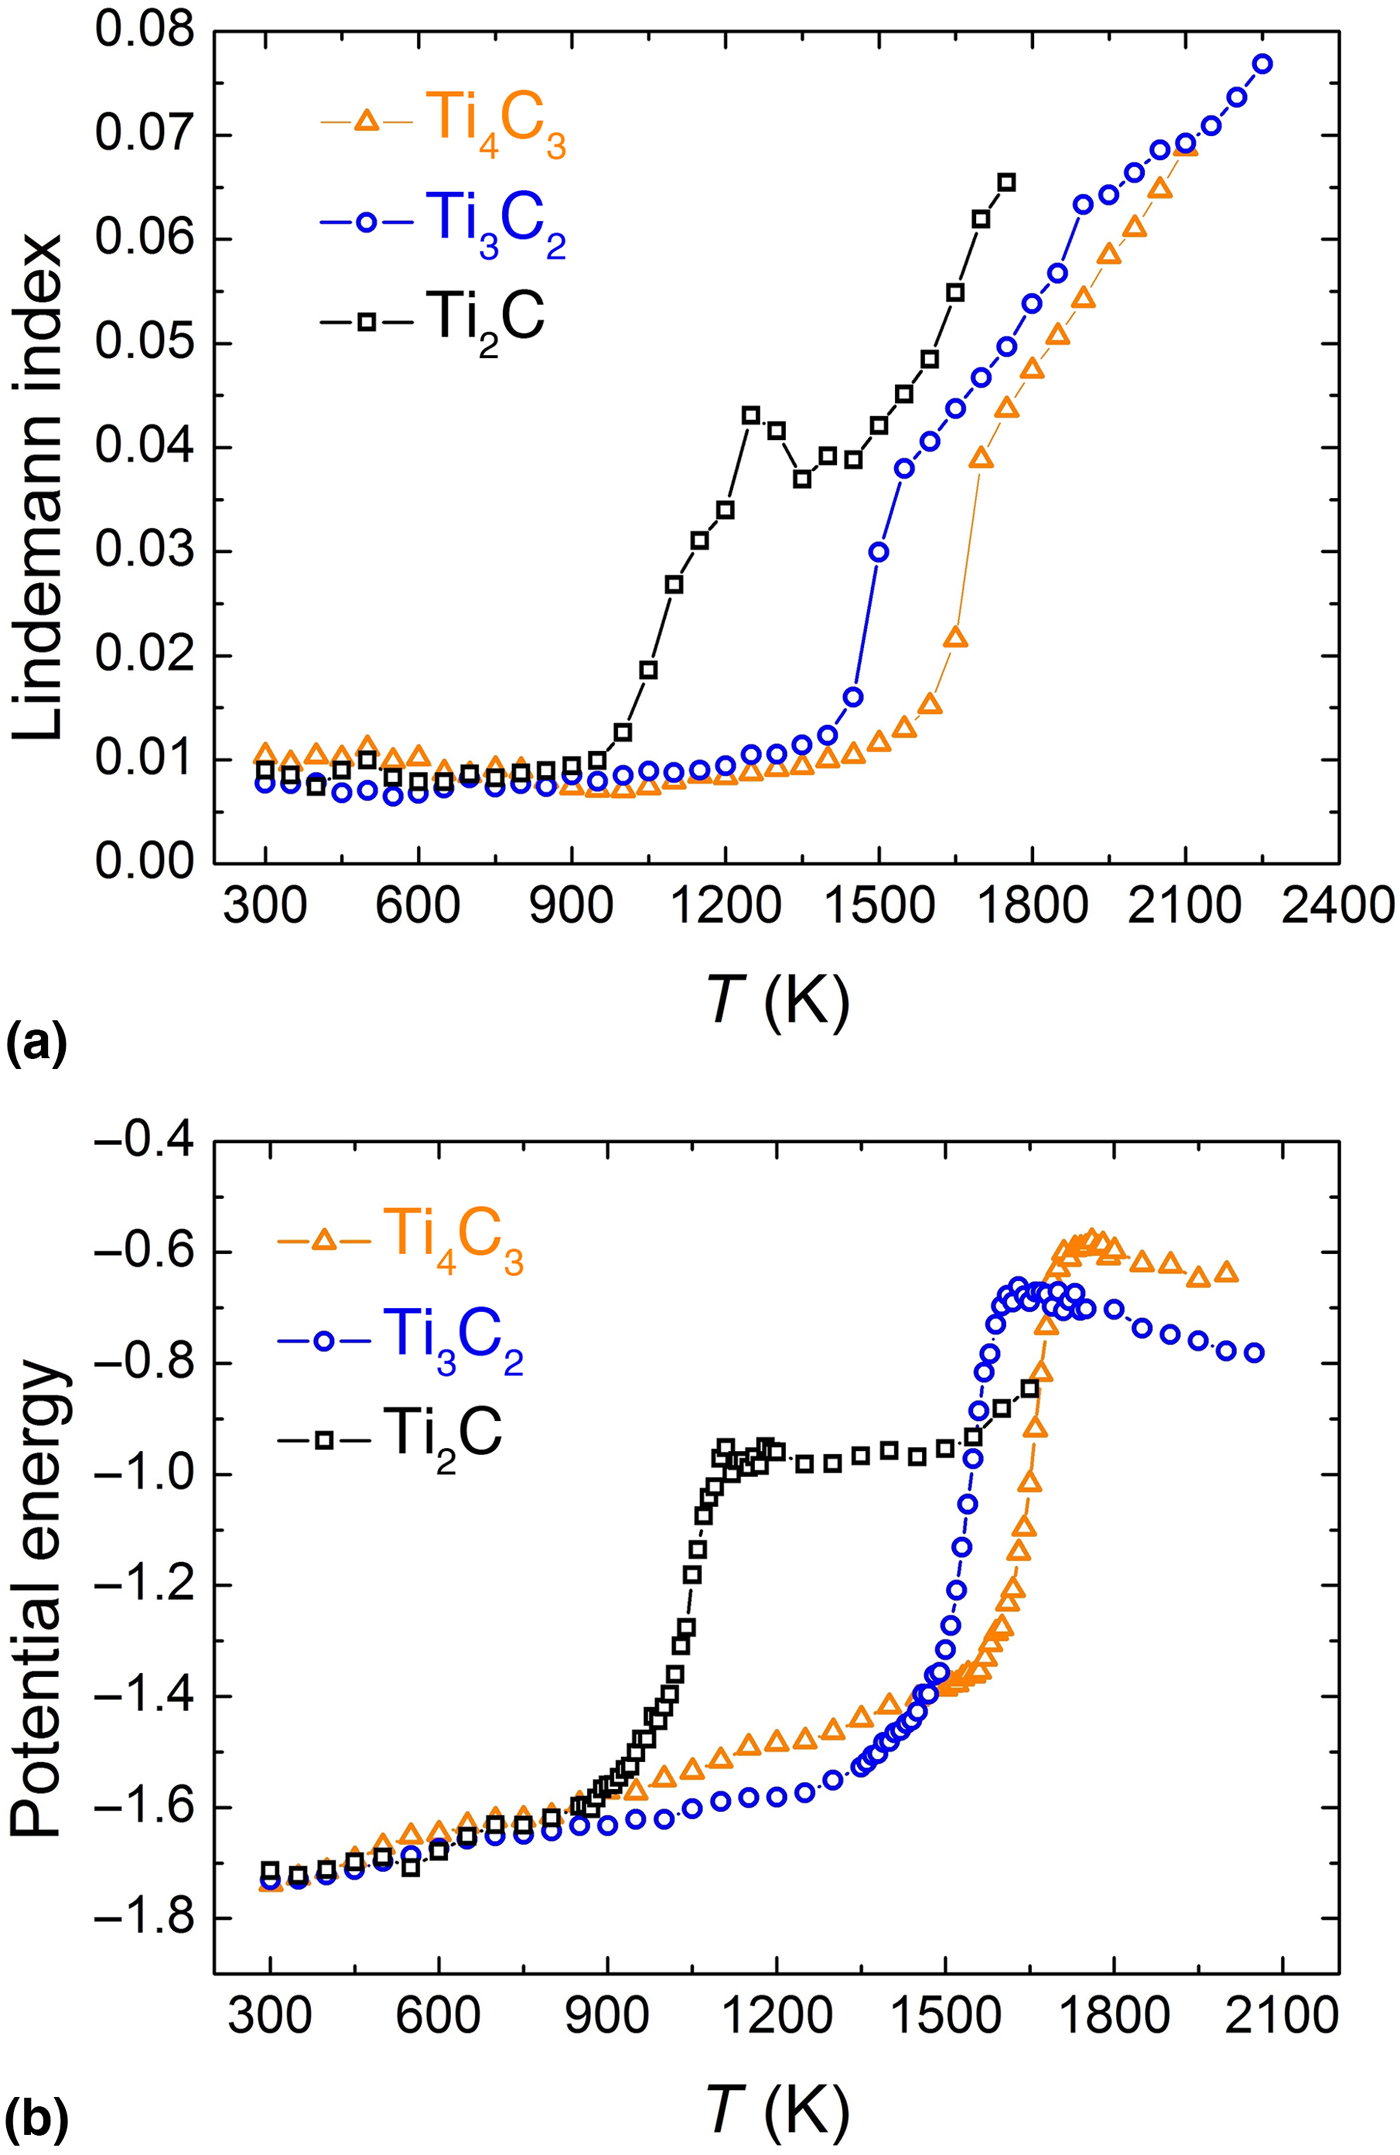
The results of MD simulations are presented in Figs. 2–5. Figure 2 presents the temperature dependence of Lindeman indexes (Fig. 2a) and averaged potential energy (Fig. 2b) for Ti2C, Ti3C2, and Ti3C4 samples, calculated from atomistic configurations. As follows from the figure, Lindeman index q exceeds the critical value q c = 0.03 at approximately 1050, 1500, and 1700 K for Ti2C, Ti3C2, and Ti3C4 respectively. These temperatures correspond to abrupt changes in q(T) dependencies from slow to very fast growth, which further confirms the thermally induced degradation processes. It is worth noting that the corresponding degradation temperatures increase with the thickness of the MXene samples. Temperature dependencies of the average potential energy calculated around the degradation points (Fig. 2b) also exhibit behavior typical for the melting process with the regions of slow and rapid growth prior to phase transition that results in slowdown of the potential energy growth. Similar trends in potential energy versus temperature have been observed in various MD simulations of the melting processes of other nanostructures.[Reference Alarifi, Atiş, Özdoğan, Hu, Yavuz and Zhou2, Reference Yang, Yang and Xu20, Reference Zhang, Stocks and Zhong21]
Temperature dependencies of Lindeman index (a) and average potential energy (b) for 2D Ti2C, Ti3C2, and Ti3C4.
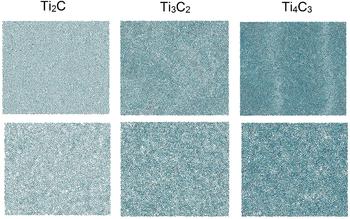
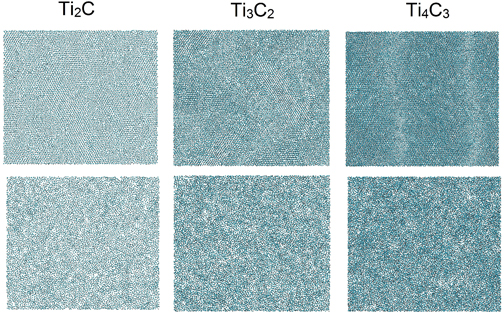
Top view of typical atomistic configurations of 2D Ti2C, Ti3C2, and Ti3C4 during heating. Top and bottom panels show the samples with crystal (lower temperature) and amorphous (higher temperature) structures respectively. Corresponding temperatures of the samples (top and bottom snapshots) are 1000 and 1120 K for Ti2C, 1450 and 1650 K for Ti3C2, and 1650 and 1710 K for Ti3C4.

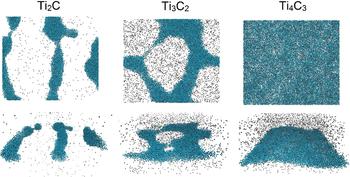
Top (top panel) and side (bottom panel) views of the MXene samples after complete thermal decomposition.

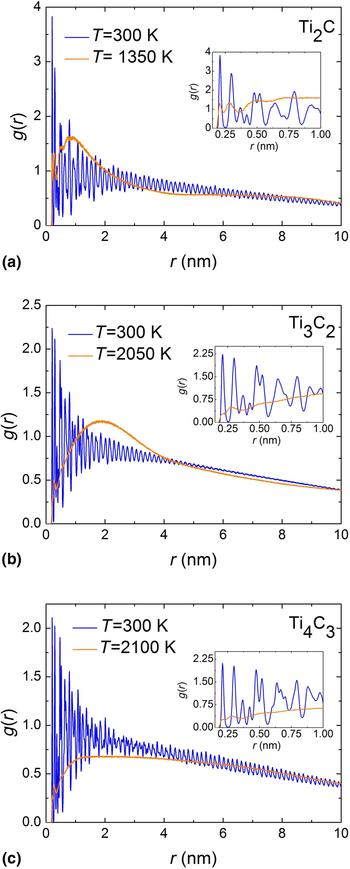
Atomic RDF of the samples at initial and maximal simulated temperature (inner panels show detailed RDF at small distances) for Ti2C (a), Ti3C2 (b), and Ti3C4 (c).

Snapshots of the systems at two different temperatures (right before the degradation starts and at the point when the degradation is clearly visible), indicating the changes in the atomic structure due to transition from crystal to amorphous configurations are shown in Fig. 3. The top panel represents clearly visible long-range ordered crystal structures of all three MXene samples at the temperatures below the onset of thermal degradation. Snapshots in the bottom panel, taken at higher temperatures, reveal local regions of the amorphous phases, indicating the thermal degradation process.
Top and side views of the atomistic configurations of the samples at maximum simulated temperatures are shown in Fig. 4. As can be seen from the figure, after complete MXene degradation most of the carbon atoms have been vaporized from the samples and move around freely in the simulation box. Titanium atoms tend to form continuous (due to periodic boundary conditions in the xy plane) rod-shaped nanostructures for Ti2C and Ti3C2, while for Ti4C3 sample Ti atoms largely retain the original shape of a rectangular sheet without voids. This difference may be explained by a larger thickness of Ti4C3 sample. Another reason may be due to a greater number of the particles involved in simulations in case of Ti3C4, which need more time to re-arrange into a more stable configuration. The fact that carbon atoms do not form any particular structure after the structure degradation, whereas titanium atoms tend to arrange into a kind of a structure, is most likely related to the form of interatomic potentials for carbon and titanium used in our simulations and may be an artifact. Whereas titanium atoms, described by embedded atom method potential, exhibit typical metallic behavior forming nanoparticle-like amorphous structures, carbon atoms interact with titanium and with each other through simple Lennard-Jones potential and thus do not form any specific configurations.
It is important to note that a recent MD simulation with ReaxFF[Reference Lotfi, Naguib, Yilmaz, Nanda and van Duin26] showed that Ti and C atoms in Ti3C2 MXene rearrange into cubic titanium carbide TiC at 1500 K in vacuum. As we used simpler approach that does not capture chemical bonding, we only observed the thermal degradation of 2D Ti3C2 sample at approximately the same temperature of 1500 K instead of transition to TiC carbide. Thus our approach correctly reproduces the resistance of the 2D Ti3C2 MXene structure to heating until the point where the samples no longer maintain planar 2D configuration. At the same time, thermal degradation temperatures for Ti2C and Ti4C3 MXenes obtained in this work are respectively lower (1050 K) and higher (1700 K) than the transition temperature of Ti3C2 into cubic TiC reported in Ref. Reference Lotfi, Naguib, Yilmaz, Nanda and van Duin26. This may be due to the inaccuracy of the used approach or due to the size effects, as Ti2C and Ti4C3 are relatively thinner and thicker, correspondingly, than Ti3C2.
For quantitative characterization of the atomic configurations, we calculate RDF at initial and maximal simulated temperatures (Fig. 5). RDF for initial MXene samples (blue lines in the figure) have the shape typical for crystal structures with clearly visible narrow peaks related to equilibrium interatomic distances, indicative of the long-range ordering. Above the degradation point (orange lines in the figure), the RDF shows only short-range ordered structures. Thus, the RDF data confirm the amorphous structure of the samples at the temperatures above their thermal degradation points.
It is worth mentioning that the melting points of other 2D materials obtained from atomistic simulations have been reported at 4510 K (graphene)[Reference Los, Zakharchenko, Katsnelson and Fasolino22] and 3700 K (MoS2)[Reference Singh, Neek-Amal, Costamagna and Peeters23] respectively. Thus all examined in this paper MXenes have much lower thermal stability compared to graphene and 2D MoS2.
In general, to obtain more precise values of melting temperatures from MD simulations, it is critical to use a more accurate force field that reproduces breaking and formation of chemical bonds, depending on the external conditions. Other factors to take into consideration when comparing calculated thermal degradation temperatures to experimental ones are ideal vacuum conditions and the absence of surface functional groups, as well as defects in MXene models in our simulations, whereas experimental results (see e.g., Refs. Reference Li, Du, Huo, Wang and Cui18 and Reference Li, Wang, Sun, Zhang, Liu, Hu and Zhou19) are produced with non-ideal vacuum, often under argon or oxygen atmospheres and the real MXene samples are always terminated with surface functional groups and contain structural defects.
Conclusions
The results of classical large-scale MD simulations of the thermal behavior of the 2D titanium carbides were reported. From these data, the approximate values of thermal degradation temperatures 1050, 1500, and 1700 K for Ti2C, Ti3C2, and Ti3C4 MXenes have been estimated using the Lindeman index as a melting criterion. The obtained data have been validated by temperature dependencies of the potential energy, snapshots of atomistic configurations, and calculated RDF. Comparison of degradation temperatures of the MXenes with melting points of other typical 2D materials led us to conclude that amorphization and degradation of MXenes (melting) occur at significantly lower temperatures compared to graphene and MoS2. This needs to be taken into consideration when developing MXenes for nanoelectronics where local heating can be quite severe.
Even though we used simple approach and did not take into account formation of chemical bonds during heating, we believe that our simulations provide a reasonable first-order approximation that can be used in further investigations on the thermodynamic properties of MXenes.
Nomenclature
- T
The temperature of the sample
- q i
Lindemann index of an atom i
- q
Lindemann index of the sample
 $q_{\rm c}$
Critical value of the Lindemann index
- r ij
The distance between atoms i and j
- N
The total number of atoms in the sample

Acknowledgments
VB is grateful to Ministry of Education and Science of Ukraine for financial support (Project No. 0117U003923).