




No CrossRef data available.
Article contents
Everyday functioning in relation to cognitive functioning and neuroimaging in community-dwelling Hispanic and Non-Hispanic older adults
Published online by Cambridge University Press: 01 May 2004
Abstract
The purpose of this study was to examine how a specific informant-based measure of everyday functioning, the Informant Questionnaire on Cognitive Decline in the Elderly (IQCODE; Jorm & Korten, 1988) relates to cognition and structural neuroimaging in a large multicultural, multilingual sample of Caucasians and Hispanics. Cognitive variables included selected subtests from the Spanish and English Neuropsychological Assessment Scales (SENAS; Mungas et al., 2000): Verbal Memory, Object Naming, Verbal Attention Span, Verbal Conceptual Thinking, and Pattern Recognition. The association between the IQCODE and selected neuroimaging variables, hippocampal volume and white matter hyperintensity, was evaluated in a subsample of English- and Spanish-speaking Hispanic individuals. The cognitive variables showed strong bivariate relationships with the IQCODE, although only Verbal Memory and Object Naming independently predicted level of functional ability. Verbal Memory was the strongest predictor of functional status, accounting for 23% of the variance in the IQCODE. White matter hyperintensity was also independently related to the IQCODE, accounting for 18% of the variance. Hippocampal volume was related to the IQCODE in a simple bivariate analysis, but was not an independent predictor of reported functional status after controlling for age. The relationships between cognitive variables and functional status, as well as between the imaging variables and the IQCODE, did not differ across language-ethnic groups. (JINS, 2004, 10, 342–354.)
Information
- Type
- Research Article
- Information
- Journal of the International Neuropsychological Society , Volume 10 , Issue 3 , May 2004 , pp. 342 - 354
- Copyright
- © 2004 The International Neuropsychological Society
INTRODUCTION
Cognitive impairment and dementia are increasingly common with age, and place older persons at increased risk for declines in everyday functioning that result in elevated levels of dependency and reduced quality of life. Because of the personal, social, and economic consequences, it is important to understand the factors associated with decline of everyday functioning. There is a growing body of research supporting the association between declines in cognition and declines in everyday functioning among older adults. Early studies demonstrated a relationship between global cognitive impairment, as assessed by screening measures such as the Mini Mental State Exam (MMSE; Folstein et al., 1975), and measures of functional status (Reed et al., 1989; Skurla et al., 1988). More recent studies have addressed associations between impairments in specific cognitive domains and measures of functional capacity. Several studies have shown memory impairments to be strongly associated with functional losses (Dunn et al., 1990; Goldstein et al., 1992; McCue et al., 1990; Richardson et al., 1995), while other studies have emphasized the importance of executive functioning (Cahn-Weiner et al., 2000; Nadler et al., 1993).
The relationship between neurobiological markers and everyday functioning within geriatric populations has been the focus of less research, though there have been a few recent studies addressing these relationships. Cahn and colleagues (Cahn et al., 1996) reported relationships between subcortical hyperintensities (SH) on magnetic resonance imaging (MRI), neuropsychological performance, and everyday functioning in 30 elderly depressed inpatients. They suggested that SH may result in impaired executive function due to disruption of frontal subcortical circuits, and that these executive deficits may be particularly important in functional impairment. There is also evidence that medial temporal lobe atrophy may be associated with functional status. Henon and colleagues (1998) studied a group of individuals with acute stroke (some of whom had preexisting dementia) and found that medial temporal lobe atrophy on computerized tomography (CT) was related to daily functioning as measured by the Informant Questionnaire on Cognitive Decline in the Elderly (IQCODE; Jorm & Korten, 1988—see below for description).
Assessment of cognitive and functional impairment in minority populations presents special challenges due to the potentially confounding effects of language, culture, and in some cases low levels of education. The IQCODE has considerable potential for assessing everyday behavior associated with cognitive decline in older persons from minority groups. It differs from many other functional measures in several important ways. First, although it assesses some of the more typical instrumental activities of daily living (IADL) such as financial management, it focuses primarily on discrete everyday behaviors dependent on specific cognitive abilities often affected by dementia. This may increase sensitivity to very subtle changes that occur in the early or preclinical stages of dementia where an affected individual, although evidencing subtle functional changes, is still able to function fairly independently. Additionally, some research has shown that after controlling for the effects of age, gender, and education, the IQCODE may be more sensitive to mild dementia than cognitive screening measures such as the MMSE (Morales et al., 1995; 1997). Another unique aspect of the IQCODE is that it specifically assesses whether there has been a change in the person's functioning. That is, informants are asked to rate the patient's current level of everyday behavior relative to his or her level of functioning 10 years earlier. This approach theoretically controls for potential biases that could affect baseline and current status equally, for example, cultural variables or low education. In fact, the IQCODE has been shown to be minimally related to education, and has demonstrated utility in detecting signs of dementia in a variety of different ethnic groups including Spanish-speaking individuals (Del-Ser et al., 1997). Because of the paucity of reliable, well-validated functional instruments suitable for use with Spanish speaking older adults, this is an important advantage of the IQCODE.
Currently, it is unclear whether rates of reported functional impairment differ as a function of race or ethnicity. For example, a study by Carrasquillo et al. (2000) examined racial and ethnic group differences in self-reported functional and cognitive disabilities among Hispanics and non-Hispanic individuals. After adjusting for age, gender, and education, Hispanic participants tended to report greater functional impairment than non-Hispanic Whites. In contrast, Ren and Amick (1996) found no differences between Whites and Hispanics in self-reported functional impairments. Loewenstein and colleagues (1995) compared groups of Spanish-speaking and English-speaking demented and non-demented older adults on a comprehensive performance-based functional assessment battery. Despite equivalent levels of cognitive impairment, Spanish-speaking dementia patients evidenced more difficulties on some functional tasks relative to demented English-speaking patients. However, there were no differences in functional abilities between the non-demented English- and Spanish-speaking individuals. Further, when ethnicity was entered into a stepwise regression equation, it accounted for a very modest amount of variance (2%) in only one out of the seven functional domains assessed.
The purpose of the present study was to examine how a specific informant-based measure of everyday behavior associated with cognitive decline, the IQCODE, relates to cognition and structural neuroimaging and to examine if such relationships differ across ethnic/language groups. In a large sample, we first examined the association between the IQCODE and various neuropsychological tests across groups of English- and Spanish-speaking Hispanics, and Caucasians. Based on previous research, a moderate association between measures of neuropsychological functioning and reported everyday functioning in both groups was predicted. To assess the particular cognitive domains most important to everyday functioning, we included neuropsychological measures that sampled the major cognitive domains: attention, language, memory, visuospatial abilities, and concept formation (one aspect of executive functioning). Given that the IQCODE has a particularly heavy emphasis on assessing everyday behavior related to memory, the neuropsychological measure of memory was hypothesized to be most associated with the IQCODE. The neuropsychological scales selected for this study were taken from the Spanish and English Neuropsychological Assessment Scales (SENAS; Mungas et al., 2000), which were specifically developed to have matched psychometric properties both across and within English and Spanish versions. As such, it was further hypothesized that the relationship between these neuropsychological measures and reported everyday functioning would be similar across ethnic/language groups. Using a subgroup of the larger sample, we further examined the contribution of neuroimaging variables to reported functional impairment. Measures of hippocampal volume (HC Vol) and white matter hyperintensities (WMH) were examined because of previous literature showing these to be relevant to cognitive and functional impairment, and dementia.
METHOD
Research Participants
All study participants were individuals 60 years of age and older who were fluent speakers of English or Spanish. The primary sample (the “cognitive sample”) was composed of 932 individuals and was used to examine the relationship between everyday functioning, measured by the IQCODE, and neuropsychological test performance. The cognitive sample included three groups defined by ethnicity and language of test administration: Hispanics tested in Spanish (Hisp-Span, n = 481), Hispanics tested in English (Hisp-Eng, n = 259), and non-Hispanics (all Caucasians) tested in English (non-Hisp-Eng, n = 192). A portion of this sample also received neuroimaging (the “imaging subsample”, n = 103), and was used to assess the association between reported everyday functioning and MRI measures. Only Hispanics received MRI scans and so were available for this part of the study (Hisp-Span, n = 49; Hisp-Eng, n = 54).
Participants were recruited from two community surveys. The majority of Hispanic participants were recruited as part of the Sacramento Area Latino Study on Aging (SALSA). A community survey in Woodland, California, was used to recruit all Caucasian and some Hispanic participants. The SALSA project is an epidemiological, longitudinal cohort study of cognitive and functional impairment in older Hispanics that is being conducted in the Sacramento, California area. SALSA methods are described in Haan et al. (Haan et al., 2003). Briefly, SALSA recruitment targeted Census tracts of Sacramento County and neighboring counties with proportional densities of Hispanics greater than 5% based on updated 1990 U.S. Census information. The recruitment method was designed to enumerate all Hispanic households within the targeted Census tracts. A multi-tier approach involved mailing Hispanic households information regarding SALSA, which was followed by a telephone call. Households that could not be contacted by telephone or mail were visited by technicians. Community-outreach methods were used to increase community awareness of the study, and to create a receptive environment to SALSA. A total of 1789 Hispanics age 60 and over were enrolled in the SALSA study; 82.2% of those contacted participated in the SALSA study.
SALSA participants in this study all received detailed neuropsychological testing from which the cognitive and functional measures were derived. Three different subgroups of SALSA participants who completed neuropsychological testing were included: (1) a 20% random sample of all SALSA participants (n = 280; Hisp-Span = 152 & Hisp-Eng = 128), (2) a group who met screening criteria for cognitive impairment in the SALSA survey (n = 336; Hisp-Span = 220 & Hisp-Eng = 116), and an additional group (n = 83; Hisp-Span = 80, Hisp-Eng = 3) who had normal cognitive screening results and were selected for testing as part of the ongoing development of the SENAS. Cognitive impairment at screening was defined as a score, statistically adjusted for the effects of age, education, gender, and language of test administration, on the Modified Mini-Mental State Exam (Teng & Chui, 1987) or the delayed-recall trial of the Spanish and English Verbal Learning Test (González et al., 2001; Mungas et al., 2000) that fell below the 20th percentile of the overall normative sample (Mungas et al., 2000). Rationale and methods for statistical adjustment of test scores are presented elsewhere (González et al., 2001; Mungas et al., 2000). Neuropsychological testing was completed by 82.6% of SALSA participants referred for testing.
The Woodland sample consisted of community-dwelling individuals age 60 and over who were recruited using a commercially obtained list of individuals living in Woodland, a city of about 50,000 near Sacramento. Individuals on the list were categorized according to whether they had Latino surnames. Caucasians were included in the non-Hisp-Eng group (n = 192); those with Latino surnames were included in the Hispanic groups (Hisp-Span—n = 29, Hisp-Eng—n = 12) if they met SALSA criteria for Hispanic ethnicity (Haan et al., 2003). Randomly selected individuals from the list were first mailed a letter describing the study. They were then contacted by telephone and invited to participate. For those with non-Latino surnames, 31.7% of the list could not be contacted, had died, or were not eligible (were under 60 years of age or did not speak English or Spanish). Of those who were contacted and eligible to participate, 60.5% completed testing. For those with Latino surnames, 50.5% could not be contacted, were deceased, or were ineligible; 54.9% of those who were contacted and eligible completed testing.
Hispanic participants were predominantly of Mexican–American ancestry. Summary statistics for demographic characteristics and Modified Mini-Mental State Exam (3MS) scores for the cognitive sample by language-ethnicity group are presented in Table 1. The three groups significantly differed according to gender (χ2[N = 932] = 20.4, df = 2, p < .0001), mean age (F = 11.7, df = 2, 929, p < .0001), mean years of education (F = 426.4, df = 2, 929, p < .0001), and mean 3MS score (F = 90.4, df = 2, 888, p < .0001). There was a higher percentage of males in the non-Hisp-Eng group than in the two Hispanic groups. All pairwise group differences for education and 3MS were statistically significant. Mean age for the Hisp-Eng group was younger than for both other groups, which did not significantly differ. The mean differences in age were relatively small, and the group variable, while highly statistically significant in this large sample, accounted for only 2.5% of the variance in age. The group education differences were very substantial, with group accounting for 47.9% of the variance in education. The Hisp-Span group, especially, had very low overall levels of education. The group effect accounted for 16.9% of the variance in the 3MS. All pairwise comparisons among the three groups were significant for both education and the 3MS (p < .0001). The non-Hisp-Eng group had highest education and 3MS scores, Hisp-Eng was intermediate, and Hisp-Span had the lowest values.
Demographic characteristics and global cognitive functioning of the cognitive sample by ethnicity/language group

Demographic and global cognitive characteristics for the imaging subsample are presented in Table 2. Group differences in mean years of education (F = 47.0, df = 1, 101, p < .0001) and 3MS (F = 12.7, df = 1, 101, p < .0006) were highly significant, but differences related to gender and age were not statistically significant.
Demographic characteristics and global cognitive functioning of the imaging subsample by ethnicity/language group

Informants
Characteristics of informants are presented in Table 3. Nearly 70% of informants were females, and there was no difference in informant gender across the ethnicity/language group. There were significant group differences in informant age, education, and relationship to the patient (spouse/significant other vs. non-spouse). Informants for non-Hisp-Eng were significantly older than for both Hispanic groups, and were more likely to be spouses (72.3% vs. 52.3% and 45.1%).
Characteristics of informants for the cognitive sample by ethnicity/language group

Measures
Demographic and linguistic variables
Gender, age in years, and years of education were included as basic demographic variables. In addition, each participant was asked to self-rate his or her fluency in English and Spanish using a simple 4-point rating scale: 0—not able to speak language at all, 1—some limited fluency, 2—speaks well, and 3—speaks very well. These simple self-report English and Spanish fluency ratings were validated in a previous study (unpublished manuscript) in comparison with objective language measures, and were shown to be important determinants of ethnic group differences. English and Spanish fluency were shown to be important determinants of ethnic group differences in a previous study (unpublished manuscript). The Acculturation Rating Scale for Mexican–Americans–Version II (ARSMA–II; Cuellar et al., 1995) was included in secondary analyses. This instrument asks participants about which language they prefer, whether they prefer Spanish or English media, and about contacts with their country of origin and with people of Latino and Anglo backgrounds. It is widely used to assess degree of assimilation of Mexican–Americans into the Anglo culture.
Functional assessment
Change in everyday behavior associated with cognitive decline was assessed using the IQCODE (Jorm et al., 1991; Jorm & Jacomb, 1989; Jorm & Korten, 1988). This is a 26-item interview-based questionnaire completed by an informant familiar with the participant. Each informant is asked to compare the participant's current level of functioning with how he or she was functioning 10 years earlier. Each of the 26 items assess specific, day-to-day activities dependent upon memory and cognitive functions which are rated according to a five-point scale: 1—much better than 10 years earlier, 2—somewhat better, 3—no change, 4—somewhat worse, and 5—much worse. The final score consists of the average of all completed items. Both the English and Spanish versions of the IQCODE have been published in their entirety elsewhere (Jorm, 1994; Morales et al., 1995). The IQCODE has been shown to have high internal consistency, with alphas ranging from .93 to .95 (Jorm & Jacomb, 1989) and good test–retest reliability, both over a few day period (r = .96) and over 1 year (r = .75) (Jorm & Jacomb, 1989; Jorm et al., 1991). The IQCODE also has limited association with education (Fuh et al., 1995; Jorm & Jacomb, 1989). A number of studies have shown that it is a sensitive indicator of dementia (sensitivity = .86 and specificity = .80) (Jorm, 1997; Jorm et al., 1991; Morales et al., 1997) and correlates with brief cognitive screening measures such as the MMSE (r = −.65) (Flicker et al., 1997). Examples of IQCODE items are included in the Appendix.
Cognitive measures
Cognitive tests were all taken from the Spanish and English Neuropsychological Assessment Scales (SENAS; Mungas et al., 2000). This is a neuropsychological test battery developed using psychometric methods associated with item response theory (IRT) (Baker, 1985; Hambleton & Swaminathan, 1985; Hambleton et al., 1991). The overriding goal for the SENAS project was to construct a battery of psychometrically matched tests that are clinically relevant for the neuropsychological evaluation of older English- and Spanish-speaking persons. The goal of psychometric matching called for highly similar measurement properties of the English and Spanish versions of the same scale, but also for similar measurement properties of all scales within each language version.
Five separate measures of cognitive ability taken from the SENAS were used in this study. These measures were included in the neuropsychological evaluation protocol for the SALSA study, and represent important domains for the neuropsychological assessment of older persons. These scales were (1) Verbal Memory, (2) Object Naming, (3) Verbal Attention Span, (4) Verbal Conceptual Thinking, and (5) Pattern Recognition. The Verbal Memory measure was derived from the Spanish and English Verbal Learning Test (SEVLT; González et al., 2001), a component of the SENAS. The SEVLT uses a 15-word list that is presented for five learning trials in a standard word-list learning test format, followed by presentation of a distractor task, and then by free recall of the initial list. The Verbal Memory measure was a composite measure combining scores from the learning trials and delayed-recall trials such that psychometric characteristics were matched to the other non-memory SENAS scales. Object Naming is a confrontation naming task that assesses ability to name objects depicted in colored pictures and drawings. Verbal Attention Span assesses forward digit span. Verbal Conceptual Thinking is a verbal abstraction task that requires the participant to identify which of six words is conceptually different from the other five. Pattern Recognition is a match to sample task requiring the participant to identify the one design out of six choices that is an exact match to the sample.
SENAS development and validation are described in detail elsewhere (González et al., 2001). Development occurred in two cycles and was based upon 200 English- and 200 Spanish-speaking older participants in phase 1, and independent samples of more than 500 per group in phase 2. Very close psychometric matching of English and Spanish versions of all five measures used in this study was achieved. Scales were strongly related to independent measures of global cognitive ability and these relationships did not differ across language and ethnic groups. Further, the SENAS scales used in this study were not significantly affected by ethnicity independent of the effects of education and levels of English and Spanish fluency.
The Modified Mini-Mental State Exam (3MS; Teng & Chui, 1987) was used to measure of global cognitive functioning. This is a 100-point scale that was designed to expand the range of measurement and increase the sensitivity of the MMSE (Folstein et al., 1975). It is widely used in epidemiological studies.
Imaging measures
All participants in the imaging subsample received a MRI scan of the brain. Two measures were used in this study: (1) Hippocampal Volume (HC Vol), and (2) White Matter Hyperintensity (WMH). MRI methods are described in detail elsewhere (Wu et al., 2002). Hippocampal volumes were computer generated based upon manually traced outlines of the hippocampus on contiguous 1.6-mm coronal slices. Intrarater reliability was high with intraclass correlations exceeding .95. HC Vol was normalized to total intracranial volume.
WMH in MRI images was rated using a semiquantitative scale. Ratings were made on contiguous 2.5-mm axial proton density images using an analog rating scale, a 100-mm straight line on which the origin was labeled “none” and the terminus “very severe”. The rater examined each slice of the brain and drew a vertical line on the scale corresponding to the assessment of the total volume of WMH as a percent of total white matter. The percent of WMH was then quantified by measuring the distance from the vertical line to the origin of the scale. The scale was supplemented with a series of eight reference images that were quantified for percent of WMH. All ratings were performed by a single rater with high intrarater reliability, ICC (intraclass correlation) = .97. The validity of the scale was tested by comparing these semiquantitative ratings with WMH determined quantitatively by a computerized segmentation program on a different series of 20 brains. The volumes of WMH determined quantitatively by the segmentation program and the rater were highly correlated (r = .94).
Procedures
The study was reviewed and approved by the U.C. Davis Institutional Review Board and informed consent was obtained from all participants. Participants were included in the study only if they clearly were competent to consent. Potential participants were excluded if they did not speak English or Spanish, did not have an informant who could complete the IQCODE, or were unwilling or unable to tolerate testing. In all cases, the SENAS scales were administered in the participant's home by a trained, bilingual psychometrist. All attempts were made to minimize distractions during testing (there were no known systematic differences in the testing environment across the groups included in this study). At the time of testing, the psychometrist identified an informant for the participant, and then interviewed this informant (not in the presence of the participant) to obtain the IQCODE data. Imaging was scheduled after completion of the neuropsychological testing.
Language of test administration was determined by an algorithm that utilized information about the participant's preferred language as well as which language was used in a variety of situations. Briefly, the participant was asked to indicate his/her preferred language, to rate his/her fluency in English and Spanish, and to indicate which languages he or she used in day to day activities such as conversations inside and outside the home, reading, and listening to the radio or watching TV. Language of test administration was the preferred language unless there was equivalent fluency in the other language and the other language was used more for daily activities. Bilingual was defined as speaking both English and Spanish well or very well. The language of administration was the preferred language in 96.7% of the Hispanic participants, and was the first language learned for 71.1%. For English administration Hispanics, 83.5% were bilingual, 3.2% were monolingual English, and 13.3% had some limited Spanish proficiency; 18.0% of Spanish administration participants were bilingual, 42.2% were monolingual Spanish, and 39.8% spoke some English. Informants were allowed to self-select language for IQCODE administration.
Data Analysis
Because a community-based sample was used in this study, the IQCODE had a highly skewed distribution with the majority of values clustering around a score of 3.0 (indicating no change), with higher scores progressively tailing off. This nonnormality could not be corrected using a variety of transformations and makes this measure unsuitable as a dependent variable in least-squares regression analyses. Therefore, the IQCODE was recoded into an ordinal variable (IQCODE-ORD). The initial intent was to recode this variable into four uniformly distributed levels based upon quartiles of the continuous IQCODE distribution in the total cognitive sample. This distribution could not be achieved exactly because approximately 30% of the sample had scores of 3.0, so an approximation was established based upon visual inspection of the distribution. Coding for IQCODE-ORD was as follows: (1) IQCODE = 3.00 or less, (2) IQCODE greater than 3.00 but less than or equal to 3.15, (3) IQCODE greater than 3.15 but less than or equal to 3.30, and (4) IQCODE greater than 3.30. The distribution of IQCODE-ORD in the cognitive sample was (1) 31.7%, (2) 25.8%, (3) 20.0%, and (4) 22.6%. Use of an ordinal scale provided greater information than a simple dichotomous outcome representing impaired versus normal, but also yielded reasonable n values for analyses examining IQCODE-ORD levels.
Ethnicity/language group differences on SENAS scales, the 3MS, and MRI variables were first evaluated using a simple analysis of variance with the group variable as the lone independent variable and the SENAS scales, 3MS, or MRI measures were dependent variables. A subsequent model added education, gender, age, English fluency, and Spanish fluency as independent variables along with group (education, gender, and age for MRI variables).
The primary analysis consisted of an ordinal logistic regression in which IQCODE-ORD was the dependent variable. Age, education, gender, and group (Hisp-Span, Hisp-Eng, and non-Hisp-Eng for the cognitive sample; Hisp-Span and Hisp-Eng for the subsample) were independent variables in the baseline, stage 1 model. Each of the five neuropsychological test scores was added individually as an independent variable along with stage 1 variables in a stage 2 model for the cognitive sample, and the two imaging measures were added individually as independent variables in the stage 2 model for the imaging subsample. Neuropsychological test scores were entered jointly in a stage 3 model for the cognitive sample and imaging variables were entered jointly for the imaging subsample. A stage 4 model added terms to model the interaction of the group variable with the cognitive or imaging variables included in the stage 3 analysis.
Secondary analyses were performed to estimate the strength of association and clarify the relationship between the IQCODE-ORD and cognitive and imaging variables. These analyses were performed using the imaging subsample so that relative effects for cognitive and imaging variables could be directly compared using the same subject sample. Consequently, these results pertained to Hispanics but not Caucasians. For these analyses, IQCODE-ORD was the independent variable and cognitive test scores and imaging variables were dependent variables. This was done so that quantitative estimates of simple bivariate effect sizes (R2) could be calculated. First, a simple analysis of variance was performed with IQCODE-ORD as the independent variable and each individual cognitive and imaging variable as dependent variables. The R2 values associated with these analyses, which quantify the percent of variance in the dependent variables shared with IQCODE-ORD, were used to estimate strengths of association. Finally, means of dependent variables associated with IQCODE-ORD levels were then examined. Post-hoc contrasts were used to compare differences in means associated with each adjacent pair of IQCODE-ORD levels (1 vs. 2, 2 vs. 3, 3 vs. 4), and a Bonferroni corrected p value of .013 (.05/3) was used to determine statistical significance of these comparisons.
RESULTS
Ethnicity/Language Group Differences on Cognitive and MRI Measures
There were significant ethnicity/language group differences in the cognitive sample for all five SENAS scales and the 3MS (p < .0001); all pairwise group comparisons (Bonferroni corrected) were statistically significant, and the general pattern was that performance was highest in the non-Hisp-Eng group, lowest in Hisp-Span, and intermediate in Hisp-Eng. Group differences on MRI variables were not significant (F < 1.0). Group differences adjusted for effects of education, gender, age, and language fluency are presented in Table 4. Group differences were no longer statistically significant for Object Naming (F = 2.1, df = 2, 917, p = .13) and were marginally significant for Verbal Conceptual Thinking (F = 3.1, df = 2, 917, p = .05). Bonferroni corrected pairwise comparisons for the latter variable were not significant. Non-Hisp-Eng means were significantly higher than Hisp-Eng means for the other three SENAS variables and the non-Hisp-Eng mean was higher than Hisp-Span for Verbal Attention but not for Pattern Recognition or Verbal Memory. Hisp-Eng scored significantly lower than Hisp-Span on Pattern Recognition, but did not differ for the other variables. These results indicate that there were still significant group differences on some variables after controlling for other demographic variables and language fluency. The Hisp-Eng group showed the poorest performance and non-Hisp-Eng was generally best, though this group did not significantly differ from Hisp-Span for four of the five variables. For the 3MS, the non-Hisp-Eng mean was significantly higher than the other two means, which did not significantly differ. Hisp-Eng and Hisp-Span did not significantly differ on MRI variables adjusted for age, gender, and education.
Adjusted ethnicity/language group means (standard errors) for SENAS scales (n = 932), 3MS (n = 890), and MRI measures (n = 103)

Demographic and Cultural Effects on IQCODE-ORD
IQCODE-ORD was significantly predicted by age (χ2 = 37.9, df = 1, p < .0001), group (χ2 = 15.0, df = 2, p = .0005), and education (χ2 = 10.2, df = 1, p = .001), but not gender (χ2 = 3.5, df = 1, p = .06) in the stage 1 analysis for the cognitive sample. Older age and lower education were associated with higher IQCODE-ORD (more functional decline). The group effect is presented in Figure 1. For the non-Hisp-Eng group, progressively fewer individuals scored in higher/more impaired IQCODE ranges. The two Hispanic groups showed relatively equal distributions across the four IQCODE ranges. Hisp-Span participants scored significantly higher than Hisp-Eng participants, but the magnitude of differences was small. The ARSMA–II Acculturation Scale was not significantly related to IQCODE in a simple bivariate analysis (p > .25).

Distribution of IQCODE-ORD scores by language/ethnicity group. Percent of individuals in each ethnicity/language group scoring within each IQCODE-ORD level are indicated. (IQCODE-ORD level 1—IQCODE average score ≤ 3.0, level 2–3 < IQCODE average score ≤ 3.15, level 3—3.15 < IQCODE average score ≤ 3.30, level 4—IQCODE average score > 3.30. NHE = Non-Hispanic, English test administration, HE = Hispanic, English test administration, HS = Hispanic, Spanish test administration).
Informant Characteristics and IQCODE-ORD
IQCODE-ORD was significantly associated with informant gender (p < .0001) and education (p = .008), but was not related to informant age or relationship to the patient (p > .60). IQCODE scores generated by female informants were relatively uniformly distributed across IQCODE-ORD level, but were disproportionately lower for male informants (Level 1—41.9%, 2—25.1%, 3—17.2%, and 4—15.8%). Participants with higher/more impaired IQCODE scores tended to have informants with slightly less education (Level 1 mean (years)—10.7, 2—11.3, 3—10.0, and 4—9.6).
Neuropsychological Performance and IQCODE-ORD
The entire sample of 932 participants was used to examine the relationship between the neuropsychological scales and the IQCODE. All five SENAS scales were strongly related to IQCODE-ORD (Verbal Attention—p = .0003, Verbal Conceptual Thinking—p = .0006, p < .0001 for others) when entered individually into the stage 2 model along with demographic variables from the stage 1 model. The five cognitive tests were then entered jointly into the stage 3 model along with the demographic variables. Age remained a significant predictor of IQCODE-ORD membership (χ2 = 5.5, df = 1, p < .02), but education (p = .76) and group (p = .25) no longer had significant effects independent of all the other variables in the model. Verbal Memory (χ2 = 39.3, df = 1, p < .0001) and Object Naming (χ2 = 5.0, df = 1, p = .03) were significant independent predictors but Verbal Attention Span (p = .12), Verbal Conceptual Thinking (p = .55) and Pattern Recognition (p = .49) were not independently associated. Results were essentially unchanged when informant gender and education were added as independent variables; Verbal Memory and Object Naming were still significant predictors and the strength of relationships was essentially the same. Group by cognitive variable interaction terms were added in the stage 4 model. None of these interaction terms were statistically significant (p > .33), suggesting that the relationship between the cognitive measures and the IQCODE did not differ across language-ethnic groups. Adding informant gender and education did not change these results. Group by cognitive variable interaction terms were added in the stage 4 model. None of these interaction terms were statistically significant (p > .33), suggesting that the relationship between the cognitive measures and the IQCODE did not differ across language-ethnic groups. Adding informant gender and education did not change these results. A secondary analysis involving bilingual and monolingual Spanish, Hispanic participants examined how bilingual status affected IQCODE level, and if it moderated the relationship between cognitive scores and the IQCODE. Neither the bilingual status main effect nor interaction effects of bilinguality with cognitive variables were statistically significant (p > .22).
Neuroimaging and IQCODE-ORD
The imaging subsample was used to examine the relationship between HC Vol and WMH and the IQCODE. In the stage 2 model for the imaging subsample (gender, education, age, group, plus WMH or HC), WMH was related to IQCODE-ORD (χ2 = 8.2, df = 1, p < .004), while HC Vol was not significantly related (p = .15). The stage 3 model for the imaging subsample yielded statistically significant effects for age (χ2 = 6.8, df = 1, p < .009) and WMH (χ2 = 7.0, df = 1, p < .008), but not HC Vol (p = .38). Interaction terms added in the stage 4 model were not statistically significant for either WMH or HC Vol (p > .17).
Strength of Neuroimaging, Neuropsychological Effects on IQCODE-ORD
Secondary analyses were performed (again using only the imaging subsample) to better describe the relationship between the IQCODE-ORD and the cognitive and imaging variables. R2 values for each dependent variable were: Verbal Memory—.23, Object Naming—.22, Verbal Conceptual Thinking—.18, Pattern Recognition—.14, Verbal Attention Span—.12, WMH—.18, and HC Vol—.20.
HC Vol was not significantly related to IQCODE-ORD in the primary analysis, but there was a strong bivariate relationship between these two variables in the secondary analysis. This discrepancy appeared to be due to moderating effects of age. Age was strongly related to both IQCODE-ORD and HC Vol (p < .0001 for simple univariate analyses). When age was dropped from the stage 2 model, HC Vol significantly predicted IQCODE-ORD (χ2 = 7.6, df = 1, p = .006) independent of the other demographic variables (gender, education, group). Age did not moderate the relationship of WMH and IQCODE.
Post-hoc comparisons of means of participants in IQCODE-ORD levels 1 versus 2, 2 versus 3, and 3 versus 4 showed a consistent pattern. Levels 1, 2, and 3 were not associated with significant differences for any cognitive or imaging variable, but level 4 differed from level 3 for all variables. Means associated with the four IQCODE-ORD levels are presented in Figure 2 (Object Naming and Verbal Memory), Figure 3 (WMH), and Figure 4 (HC Vol).

Mean performance (with standard errors) for SENAS Object Naming and Verbal Memory Scales by IQCODE-ORD level. (IQCODE-ORD level 1—IQCODE average score ≤ 3.0, level 2–3 < IQCODE average score ≤ 3.15, level 3 = 3.15 < IQCODE average score ≤ 3.30, level 4—IQCODE average score > 3.30).

Mean performance (with standard errors) for White Matter Hyperintensity Rating by IQCODE-ORD level. (IQCODE-ORD level 1—IQCODE average score ≤ 3.0, level 2–3 < IQCODE average score ≤ 3.15, level 3—3.15 < IQCODE average score ≤ 3.30, level 4—IQCODE average score > 3.30).

Mean performance (with standard errors) for Hippocampal Volume (normalized to total intracranial volume) by IQCODE-ORD level. The relationship of HC with IQCODE-ORD was not statistically significant when age was added to the model. (IQCODE-ORD level 1—IQCODE average score ≤ 3.0, level 2–3 < IQCODE average score ≤ 3.15, level 3—3.15 < IQCODE average score ≤ 3.30, level 4—IQCODE average score > 3.30).
DISCUSSION
Demographic variables were associated, to varying degrees, with everyday functioning as measured by the IQCODE. Older participants were more likely to evidence functional impairment. Level of education was weakly associated with reported functional status, with low education associated with a greater likelihood of functional impairment. When the cognitive variables were added to models to predict IQCODE levels, education was no longer a significant predictor of reported functional status, but age continued to be related. All cognitive variables showed relatively strong bivariate relationships with the IQCODE score, but only Verbal Memory and Object Naming independently predicted level of reported functional ability when all cognitive variables were jointly entered into the regression model. WMH was related to the IQCODE independent of demographics, while HC Vol showed a more complex relationship that was moderated by age effects (i.e., it did not independently predict IQCODE ratings when age was included in the model).
There was a clear relationship in the simple bivariate analysis between the IQCODE and ethnicity/language group membership. Spanish- and English-speaking Hispanic participants were fairly evenly distributed among the different IQCODE levels while the Caucasian group had progressively fewer individuals falling in the higher IQCODE ranges, suggesting higher rates of reported functional decline in the Hispanic groups. Group differences were present in a model including other demographic variables as independent variables, but the group effect was not significant when cognitive variables were added to the model. This pattern of results suggests that higher IQCODE scores in the Hispanic groups may have been linked to greater cognitive impairment, which is supported by the finding that both Hispanic groups performed more poorly on a measure of global cognitive function (the 3MS) after adjusting for demographics and language fluency.
There are several potential explanations for increased cognitive and reported functional impairment in the Hispanic groups. First, a higher risk for dementia in minority groups has been reported (Gurland et al., 1999) and has been hypothesized to relate to such factors as decreased access to health, lower levels of education, and various other lifestyle differences. In the SALSA study (Haan et al., 2003), overall dementia prevalence estimates for Hispanics were quite similar to those reported for Caucasian populations, but low education was a risk factor for dementia, as it has been in many other studies. Second, members of ethnic minorities are more likely to care for their elderly family members at home rather than place them in a nursing home (Salive et al., 1993; Yaffe et al., 2002). Hence the higher rate of cognitive and reported functional impairment in the community-dwelling Hispanics in this study may reflect more impaired Hispanic individuals being cared for at home.
Third, other noncognitive factors could also have played a role in the lower cognitive and functional scores in the Hispanic groups. For example, the IQCODE has been shown to be affected by informants' level of depression and anxiety (Jorm et al., 1994), as well patients' level of depression (Starr et al., 2000). Various neuropsychological functions can also be somewhat reduced as a result of depression (Danion et al., 1991; Denny & Hunt, 1992). There is evidence of a higher rate of depression among older Hispanics as compared on Caucasians (Black et al., 1998). Differential prevalence rates for depression could have contributed to group differences in IQCODE scores. Acculturation is another potentially relevant noncognitive variable that might relate to IQCODE scores, but showed no relationship to the IQCODE in this study.
The nature or quality of the relationship between the older adult participants and informants merits consideration as it may have been different in the Hispanics and Caucasians. However, as the cognitive test scores were also lower in the Hispanic groups, it appears likely that differences in the IQCODE in these groups were not solely the result of informant characteristics. Another potential reason for an increased rate of both cognitive and reported functional decline in the Hispanic groups may relate to the increased prevalence of risk factors for cerebrovascular disease found in these groups (i.e., non-insulin-dependent diabetes) (Jagust et al., 2002). Unfortunately, imaging data was not available for the non-Hispanic sample; therefore a direct comparison of the imaging data across groups could not be done. It is possible that the Hispanic groups had more structural neuroimaging abnormalities that may be accounting for both the increased degree of cognitive and functional impairment.
When the relationship between the IQCODE and cognitive measures was examined, memory was most strongly and independently related to reported everyday functioning. This finding is consistent with several previous studies (Dunn et al., 1990; McCue et al., 1990; Nadler et al., 1993; Richardson et al., 1995). Expressive language (Object Naming) showed the second strongest and only other independent relationship with the IQCODE. The other cognitive measures, although showing univariate relationships with reported everyday functioning, did not show relationships with the IQCODE independent of other cognitive variables. Given that the IQCODE is heavily weighted toward assessing everyday behaviors related to memory functioning, it makes theoretical sense that the memory scale was most strongly and independently associated with the IQCODE.
Some studies have found that measures of executive function are most associated with everyday functioning (Cahn-Weiner et al., 2000; Nadler et al., 1993). The measure of executive functioning used in the current study (Verbal Conceptual Thinking) did not independently predict ratings on the IQCODE. However, the domain of executive functioning includes many disparate abilities, and it may be that conceptual thinking is a different executive ability than used in previous studies. The fact that we used psychometrically matched neuropsychological scales allows us to be more confident that the pattern of associations found in this study was not influenced by nonspecific measurement artifacts of these tests, but further study with a broader range of executive measures would be helpful.
When the imaging variables were used to predict functional status, white matter abnormalities and hippocampal volume were related to the IQCODE in simple bivariate analyses. However, the hippocampal volume effect was not present when age was jointly added with hippocampal volume. Hippocampal volume was negatively related to age (r = −.45), and thus, there was a complex relationship among age, hippocampal volume, and the IQCODE. A likely interpretation is that the relationship between age and everyday functioning may be partially explained by aging-related decline in hippocampal volume. The effect of white matter hyperintensity, in contrast, was simpler and was independent of demographic variables including age. Such findings support other research that also showed significant relationships between WMH and functional measures (Cahn et al., 1996).
The results of this study indicate that, although there were some differences in reported functional status across ethnic-language groups (which seems to be associated with greater cognitive impairment in the Hispanic groups), the cognitive and imaging variables that predicted the IQCODE were similar across language-ethnicity groups. Such findings suggests that there may be a similar pattern of cognitive declines (i.e., verbal memory and expressive language) and imaging variables that predict declines in everyday functioning in both Hispanic and Caucasian older adults.
It is worth noting that, even though the IQCODE score distribution was divided into four ordinal levels for the purpose of this study, it was the category with the highest level of functional decline that was associated with abnormal cognitive and neuroimaging results. A cutoff score of 3.30 seemed to be indicative of clinically significant change, and it appears to be reasonable to dichotomize the IQCODE score to assess clinically significant functional decline. This is consistent with another study that found a score of >3.31 predicted subsequent development of dementia (Louis et al., 1999). It should be noted that the 3.30 cutoff in this study was empirically determined and was not guided by the Louis et al. study.
This study supports the utility of the IQCODE in the assessment of reported everyday functioning in English- and Spanish-speaking Hispanic and Caucasian individuals. This instrument appears to have similar relationships to cognitive abilities and structural brain changes in English- and Spanish-speaking Hispanics and Caucasians. Given the dearth of measures of everyday functioning available for use in minority and non-English speaking populations, the IQCODE appears to have significant cross-cultural applications. There are some limitations to this and other functional measures which rely solely on information obtained from an informant rather than performance-based measures of everyday behaviors (e.g., Direct Assessment of Functional Status, Loewenstein et al., 1989). However, it also has many advantages over such performance-based measures including ease and brevity of administration, as well as cost efficiency.
There are a number of strengths and limitations to this study. This study utilized a large sample (particularly the cognitive sample) that likely provided relatively good statistical power for detecting group differences and relationships between the cognitive measures and the IQCODE. To our knowledge this is the first study that has examined the relationship between imaging variable and reported functional status in an ethnically diverse sample. One of the limitations of the study was that a measure of depression was not included. Future studies should examine how depression may moderate the relationship between functional status and both cognition and imaging variables across different ethnic groups.
ACKNOWLEDGMENTS
This study was supported in part by grants AG10220, AG10129, and AG12975 from the National Institute on Aging, Bethesda, MD and the California Department of Health Services. Esther Lara and Teresa Ortiz supervised recruitment and data collection. Carmen Chavez, Theresa Perez-Laschaw, Stella Garcia, and Nancy Gubbins served as psychometrists. Jesus Cervantes assisted with data collection and test scoring.
Appendix

References
REFERENCES
Baker, F.B.
(1985).
The basics of item response theory.
Portsmouth, New Hampshire:
Heineman Publishing.
Black, S.A.,
Markides, K.S., &
Miller, T.Q.
(1998).
Correlates of depressive symptomotolgy among older community
dwelling Mexican Americans: The Hispanic EPESE.
Journal of Gerontology of the British Psychiatric Science Society,
53,
198–208.Google Scholar
Cahn, D.,
Malloy, P.,
Salloway, S.,
Rogg, J.,
Gillard, E.,
Kohn, R.,
Tung, G.,
Richardson, E.D., &
Westlake, R.
(1996).
Subcortical hyperintensities on MRI and activities of daily living
in geriatric depression.
Journal of Neuropsychiatry and Clinical Neuroscience,
8,
404–411.Google Scholar
Cahn-Weiner, D.,
Malloy, P.F.,
Boyle, P.A.,
Marran, M., &
Salloway, S.
(2000).
Prediction of functional status from neuropsychological tests in
community-dwelling elderly individuals.
Clinical Neuropsychologist,
14,
187–195.Google Scholar
Carrasquillo, O.,
Lantigua, R.A., &
Shea, S.
(2000).
Differences in functional status of Hispanic versus
non-Hispanic White elders: Data from the Medical Expenditure Panel
Survey.
Journal of Aging and Health,
12,
342–361.Google Scholar
Cuellar, I.,
Arnold, B., &
Maldonado, E.
(1995).
Acculturation Rating Scale for Mexican Americans–II: A
revision of the original ARSMA Scale.
Hispanic Journal of Behavioral Sciences,
17,
275–304.Google Scholar
Danion, J.W.,
Willard-Schroeder, D.,
Zimmerman, M.A.,
Schlienger, J.L., &
Singer, L.
(1991).
Explicit memory and repetition priming in depression: Preliminary
findings.
Archives of General Psychiatry,
48,
707–711.Google Scholar
Del-Ser, T.,
Morales, J.M.,
Barguero, M.S.,
Canton, R., &
Bermejo, F.
(1997).
Application of the Spanish version of the “Informant
Questionnaire on Cognitive Decline in the Elderly” in the
clinical assessment of dementia.
Alzheimer's Disease and Associated Disorders,
11,
3–8.Google Scholar
Denny, E.B. &
Hunt, R.R.
(1992).
Affective valence and memory in depression: Dissociation of recall
and fragment completion.
Journal of Abnormal Psychology,
101,
575–580.Google Scholar
Dunn, E.J.,
Searight, H.R.,
Grisso, T.,
Margolis, R.B., &
Gibbons, J.L.
(1990).
The relation of the Halstead-Reitan Neuropsychological Battery to
functional daily living skills in geriatric patients.
Archives of Clinical Neuropsychology,
5,
103–117.Google Scholar
Flicker, L.,
Logiudice, D.,
Carlin, J.B., &
Ames, D.
(1997).
The predictive value of dementia screening instruments in clinical
populations.
International Journal of Geriatric Psychiatry,
12,
203–209.Google Scholar
Folstein, M.,
Folstein, S., &
McHugh, P.R.
(1975).
Mini-mental state: A practical method for grading the cognitive
state of patients for the clinician.
Journal of Psychiatric Research,
12,
189–198.Google Scholar
Fuh, J.L.,
Teng, E.L.,
Lin, K.N.,
Larson, E.B.,
Wang, S.J.,
Liu, C.Y.,
Chou, P.,
Kuo, B.I., &
Liu, H.C.
(1995).
The Informant Questionnaire on Cognitive Decline in the Elderly
(IQCODE) as a screening tool for dementia for a predominantly
illiterate Chinese population.
Neurology,
45,
92–96.Google Scholar
Goldstein, G.,
McCue, M.,
Rogers, J., &
Nussbaum, P.D.
(1992).
Diagnostic differences in memory test based prediction of
functional capacity in the elderly.
Neuropsychological Rehabilitation,
2,
307–317.Google Scholar
González, H.M.,
Mungas, D.,
Reed, B.R.,
Marshall, S., &
Haan, M.
(2001).
A new verbal learning and memory test for English- and
Spanish-speaking older people.
Journal of the International Neuropsychological Society,
7,
544–555.Google Scholar
Gurland, B.,
Wilder, D.,
Lantigua, R.,
Stern, Y.,
Chen, J.,
Killeffer, E., &
Mayeux, R.
(1999).
Rates of dementia in three ethnoracial groups.
International Journal of Geriatric Psychiatry,
14,
481–493.3.0.CO;2-5>CrossRefGoogle Scholar
Haan, M.N.,
Mungas, D.M.,
Ortiz, T.A.,
Acharya, A.,
González, H.M., &
Jagust, W.J.
(2003).
Prevalence and determinants of dementia in older Mexican Americans.
Journal of the American Geriatrics Society,
51,
169–177.Google Scholar
Hambleton, R.K. &
Swaminathan, H.
(1985).
Item response theory. Principles and applications.
Boston, Massachusetts:
Kluwer-Nijhoff Publishing.
Hambleton, R.K.,
Swaminathan, H., &
Rogers, H.J.
(1991).
Fundamentals of item response theory.
Newbury Park, California:
Sage Publications.
Henon, H.,
Pasquier, F.,
Durieu, I.,
Pruvo, J.P., &
Leys, D.
(1998).
Medial temporal lobe atrophy in stroke patients: Relation to
pre-existing dementia.
Journal of Neurology, Neurosurgery, and Psychiatry,
65,
641–647.Google Scholar
Jagust, W.J.,
Eberling, J.L.,
Wu, C.C.,
Finkbeiner, A.,
Mungas, D.,
Valk, P.E., &
Haan, M.N.
(2002).
Brain function and cognition in a community sample of elderly
Latinos.
Neurology,
59,
378–383.Google Scholar
Jorm, A.F.
(1994).
A short form of the Informant Questionnaire on Cognitive Decline in
the Elderly (IQCODE): Development and cross-validation.
Psychological Medicine,
24,
145–153.CrossRefGoogle Scholar
Jorm, A.F.
(1997).
Methods of screening for dementia: A meta-analysis of studies
comparing an informant questionnaire with a brief cognitive test.
Alzheimer's Disease and Associated Disorders,
11,
158–162.Google Scholar
Jorm, A.F. &
Korten, E.
(1988).
Assessment of cognitive decline in the elderly by informant
interview.
British Journal of Psychiatry,
152,
209–213.Google Scholar
Jorm, A.F. &
Jacomb, P.A.
(1989).
The informant questionnaire on cognitive decline in the elderly
(IQCODE): Socio-demographic correlates, reliability, validity and some
norms.
Psychological Medicine,
19,
1015–1022.Google Scholar
Jorm, A.F.,
Scott, R.,
Cullen, J.S., &
MacKinnon, A.J.
(1991).
Performance of the informant questionnaire on cognitive decline in
the elderly (IQCODE) as a screening test for dementia.
Psychological Medicine,
21,
785–790.Google Scholar
Jorm, A.F.,
Christensen, H.,
Henderson, A.S.,
Korten, A.E.,
Mackinnon, A.J., &
Scott, R.
(1994).
Complaints of cognitive decline in the elderly: A comparison of
reports by subjects and informants in a community survey.
Psychological Medicine,
24,
365–374.Google Scholar
Loewenstein, D.A.,
Amigo, E.,
Duaran, R.,
Guterman, A.,
Hurwitz, D.,
Berkowitz, N.,
Wilkie, F.,
Weinberg, G.,
Black, B.,
Gittelman, B., &
Eisdorfer, C.
(1989).
A new scale for the assessment of functional status in
Alzheimer's disease and related disorders.
Journal of Gerontology,
44,
P114–P121.Google Scholar
Loewenstein, D.A.,
Rubert, M.P.,
Arguelles, T., &
Duara, R.
(1995).
Neuropsychological test performance and prediction of functional
capacities among Spanish-speaking and English-speaking patients with
dementia.
Archives of Clinical Neuropsychology,
10,
75–88.Google Scholar
Louis, B.,
Hardwood, D.,
Hope, T., &
Jacoby, R.
(1999).
Can an informant questionnaire be used to predict the development
of dementia in medical inpatients.
International Journal of Geriatric Psychiatry,
14,
941–945.Google Scholar
McCue, M.,
Rogers, J.C., &
Goldstein, G.
(1990).
Relationship between neuropsychological and functional assessment
in elderly neuropsychiatric patients.
Rehabilitation Psychology,
35,
91–99.Google Scholar
Morales, J.M.,
Gonzalez-Montalvo, J.I.,
Bermejo, F., &
Del-Ser, T.
(1995).
The screening of mild dementia with a shortened Spanish version of
the “Informant Questionnaire on Cognitive Decline in the
Elderly”.
Alzheimer's Disease and Associated Disorders,
9,
105–111.Google Scholar
Morales, J.,
Bermejo, F.,
Romero, M., &
Del-Ser, T.
(1997).
Screening of dementia in community-dwelling elderly through
informant report.
Journal of Geriatric Psychiatry,
12,
808–816.Google Scholar
Mungas, D.,
Reed, B.R.,
Marshall, S.C., &
González, H.M.
(2000).
Development of psychometrically matched English and Spanish
neuropsychological tests for older persons.
Neuropsychology,
14,
209–223.Google Scholar
Nadler, J.D.,
Richardson, E.D.,
Malloy, P.F.,
Marran, M.E., &
Hostetler Brinson, M.E.
(1993).
The ability of the Dementia Rating Scale to predict everyday
functioning.
Archives of Clinical Neuropsychology,
8,
449–460.Google Scholar
Reed, B.R.,
Jagust, W.J., &
Seab, J.P.
(1989).
Mental status as a predictor of daily function in progressive
dementia.
The Gerontologist,
29,
804–807.Google Scholar
Ren, X.S. &
Amick, B.C.
(1996).
Racial and ethnic disparities in self-assessed health status:
Evidence from the national survey of families and households.
Ethnicity and Health,
1,
293–303.Google Scholar
Richardson, E.D.,
Nadler, J.D., &
Malloy, P.
(1995).
Neuropsychologic prediction of performance measures of daily living
skills in geriatric patients.
Neuropsychology,
9,
565–572.Google Scholar
Salive, M.E.,
Collins, K.S.,
Foley, D.J., &
George, L.K.
(1993).
Predictors of nursing home admission in a biracial population.
American Journal of Public Health,
83,
1765–1767.Google Scholar
Skurla, E.,
Rodgers, J.C., &
Sunderland, T.
(1988).
Direct assessment of activities of daily living in Alzheimer's
disease.
American Geriatric Society,
36,
97–103.Google Scholar
Starr, J.M.,
Nicolson, C.,
Anderson, K.,
Dennis, M.S., &
Deary, I.J.
(2000).
Correlates of informant-rated cognitive decline after stroke.
Cerebrovascular Disease,
10,
214–220.Google Scholar
Teng, E.L. &
Chui, H.C.
(1987).
The Modified Mini-Mental State (3MS) Examination.
Journal of Clinical Psychiatry,
48,
314–318.Google Scholar
Wu, C.C.,
Mungas, D.,
Petkov, C.I.,
Eberling, J.L.,
Zrelak, P.A.,
Buonocore, M.H.,
Brunber, J.A.,
Mangus, C.C., &
Jagust, W.J.
(2002).
Brain structure and cognition in a community sample of elderly
Latinos.
Neurology,
59,
383–391.Google Scholar
Yaffe, K.,
Fox, P.,
Newcomer, R.,
Sands, L.,
Lindquist, K.,
Dane, K., &
Covinsky, K.E.
(2002).
Patient and caregiver characteristics and nursing home placement in
patients with dementia.
Journal of the American Medical Association,
287,
2090–2097.Google Scholar
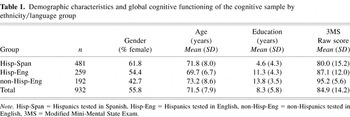
Demographic characteristics and global cognitive functioning of the cognitive sample by ethnicity/language group
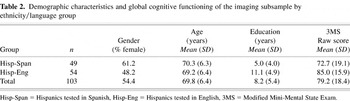
Demographic characteristics and global cognitive functioning of the imaging subsample by ethnicity/language group
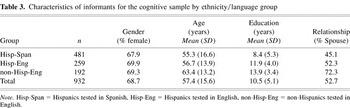
Characteristics of informants for the cognitive sample by ethnicity/language group
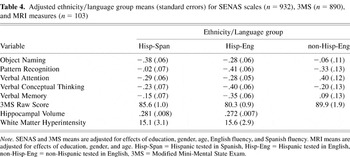
Adjusted ethnicity/language group means (standard errors) for SENAS scales (n = 932), 3MS (n = 890), and MRI measures (n = 103)
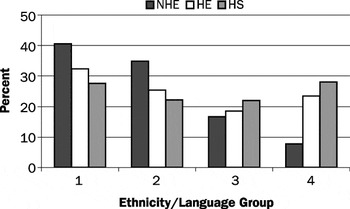
Distribution of IQCODE-ORD scores by language/ethnicity group. Percent of individuals in each ethnicity/language group scoring within each IQCODE-ORD level are indicated. (IQCODE-ORD level 1—IQCODE average score ≤ 3.0, level 2–3 < IQCODE average score ≤ 3.15, level 3—3.15 < IQCODE average score ≤ 3.30, level 4—IQCODE average score > 3.30. NHE = Non-Hispanic, English test administration, HE = Hispanic, English test administration, HS = Hispanic, Spanish test administration).
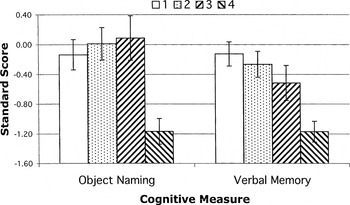
Mean performance (with standard errors) for SENAS Object Naming and Verbal Memory Scales by IQCODE-ORD level. (IQCODE-ORD level 1—IQCODE average score ≤ 3.0, level 2–3 < IQCODE average score ≤ 3.15, level 3 = 3.15 < IQCODE average score ≤ 3.30, level 4—IQCODE average score > 3.30).
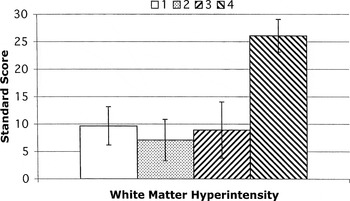
Mean performance (with standard errors) for White Matter Hyperintensity Rating by IQCODE-ORD level. (IQCODE-ORD level 1—IQCODE average score ≤ 3.0, level 2–3 < IQCODE average score ≤ 3.15, level 3—3.15 < IQCODE average score ≤ 3.30, level 4—IQCODE average score > 3.30).
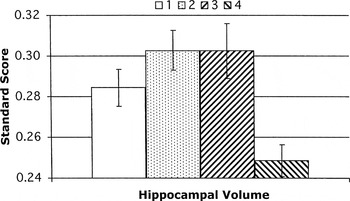
Mean performance (with standard errors) for Hippocampal Volume (normalized to total intracranial volume) by IQCODE-ORD level. The relationship of HC with IQCODE-ORD was not statistically significant when age was added to the model. (IQCODE-ORD level 1—IQCODE average score ≤ 3.0, level 2–3 < IQCODE average score ≤ 3.15, level 3—3.15 < IQCODE average score ≤ 3.30, level 4—IQCODE average score > 3.30).
 You have
Access
- 55
- Cited by