INTRODUCTION
In aquatic ecosystems, plankton dynamics and the overall food web structure are strongly linked to protist size structure (Chisholm, Reference Chisholm, Falkowski and Woodhead1992; Azam & Worden, Reference Azam and Worden2004). Because of high surface to volume ratios, small cells easily uptake nutrients which reach numerous assimilation surface points with low energy costs (Agawin et al., Reference Agawin, Duarte, Agusti and Vaqué2004), and thus outcompete large cells (Aleya, Reference Aleya1989; Sin & Wetzel, Reference Sin and Wetzel2000). Therefore, size fractionation of plankton communities have been extensively investigated in both freshwater (Aleya & Amblard, Reference Aleya and Amblard1989; Pirlot et al., Reference Pirlot, Vanderheyden, Descy and Servais2005), and marine (Tada et al., Reference Tada, Nakano, Takemura and Montani2003) systems, and showed quantitative as well as metabolic dominance of small-sized pico- and nanoplanktonic primary producers. Yet, heterotrophic flagellates and ciliated protozoans (Cuevas & Morales, Reference Cuevas and Morales2006) can feed on small detritus, bacteria, and the dominating pico- and nanoplanktonic species (Laybourn-Parry, Reference Laybourn-Parry1992; Dupuy et al., Reference Dupuy, Ryckaert, Le Gall and Hartmann2007), conveying thus the organic matter from small particles to copepods and other mesozooplankton that are the food of larval fish (Hartmann et al., Reference Hartmann, Taleb, Aleya and Lair1993; Brett & Müller-Navarra, Reference Brett and Müller-Navarra1997). In extreme ecosystems, such as man-made solar salterns, the salinity gradient from the first to the crystallizer pond may complicate predictive responses of size-fractionated plankton to the saline stress. Several data from saline ponds have been reported on bacteria and Archaea (Pedrós-Alió et al., Reference Pedrós-Aliò, Calderon-Paz, MacLean, Medina, Marrasé, Gasol and Guixa-Boixereu2000; Gasol et al., Reference Gasol, Casamayor, Joint, Garde, Gustavson, Benlloch, Díez, Schauer, Massana and Pedrós-Alio2004; Bardavid et al., Reference Bardavid, Ionescu, Oren, Rainey, Hollen, Bagaley, Small and McKay2007), phytoplankton (Estrada et al., Reference Estrada, Peter, Gasol, Casamayor and Pedrós-Alió2004; Ayadi et al., Reference Ayadi, Abid, Elloumi, Bouaïn and Sime-Ngando2004), ciliates (Gunde-Cimerman et al., Reference Gunde-Cimerman, Oren and Plemenitaš2005; Elloumi et al., Reference Elloumi, Carrias, Ayadi, Sime-Ngando, Boukhris and Bouaïn2006), zooplankton (Quintana, Reference Quintana2002; Guermazi et al., Reference Guermazi, Elloumi, Ayadi, Bouaïn and Aleya2008a), and showed a drastic collapse in species diversity with increasing salinity of the system. However, data on the relative contribution of several size fractions to the whole microplankton community are scarce or absent. It is therefore of interest to investigate whether saline gradients of five ponds of the Sfax solar saltern (Tunisia) have the potential to affect the dynamics and biomass of phototrophic and heterotrophic microorganisms and which taxa exhibit the most efficient metabolic flexibility to acclimate to the salt stress in arid zones.
MATERIALS AND METHODS
Study site
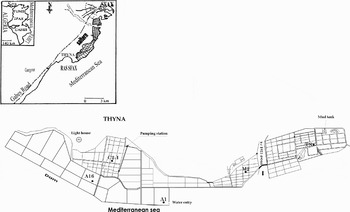
The study was conducted in a solar saltern located in the central-eastern coast of Sfax (34° 39′ N 10° 42′ E), and consisted of interconnecting shallow ponds (20–70 cm deep) extending over an area of 1500 ha (Figure 1). The saltern is separated from the sea by an artificial red silt seawall (height: 4 m). The input of seawater and the circulation between the various ponds are entirely controlled depending on the meteorological conditions in order to ensure an annual yield of about 300,000 tonnes of halite and 25,000 tonnes of bittern brine.
General map of the study site and localization of the sampling ponds (A1, A16, C2-1, M2 and TS) in the Sfax saltern.

Sampling
Sampling was carried out in the central part of five ponds A1, A16, C2-1, M2 and TS (Figure 1) in January, February and March 2006 (15 samples). Water samples (200 ml) were collected 20 cm below the surface with a Van Dorn bottle and filtered through a nylon net of 100 µm to remove large zooplankton.
Physical and chemical factors
Salinity as total dissolved salts (TDS) was estimated by the dry residue method, which consists of evaporating a 50 ml sample (24 hours, 120°C) in a previously sterilized crystallizing dish (by heating at 550°C for 1 hour), and calculating the salt content (‰ = g · l−1) from the difference in weight before and after evaporation. The total weight of major ions generally constitutes over 99% of total salinity (Wetzel & Likens, Reference Wetzel and Likens2000). Concentration of suspended matter (SM) was determined by measuring the dry weight of the residue after water filtration through a Whatman GF/C membrane. The filters were rinsed to remove salts. Total nitrogen Kjeldhal (TNK) and total phosphorus (TP) concentrations were assessed by ionic chromatography and spectrophotometry, respectively (Murphey & Riley, Reference Murphy and Riley1962).
Cell enumeration
Bacteria and phototrophic picoplankton (PP): on the basis of morphological and natural fluorescence characteristics, picophytoplankton consisted of picocyanobacteria (containing phycoerythrine) and eukaryotic picoplankton. Cells were counted by epifluorescence (Porter & Feig, Reference Porter and Feig1980). Samples (2 to 5 ml) were fixed with 2 ml of 4% formaldehyde for 30 minutes or more at room temperature. 1 ml of an appropriate dilution of the mixture was stained with 4,6-diamidino-2-phenylindole (DAPI, Sigma) and filtered on a polycarbonate filter (Millipore, pore size: 0.2 µm) at low vacuum (<13 kPa). 1000 cells were counted on 15 to 20 fields with a Leica DM LS2 microscope, and cell dimensions and biovolumes were determined.
Nanoplankton: formalin-fixed samples were analysed under light microscope using Mallassez cells. The mean number of total nanoplankton was then estimated from triplicate counts. In addition, sub-samples were stained with primulin and collected onto 0.8 µm-pore-size black Nucleopore filters to discriminate between pigmented and colourless nanoplanktonic cells. Filters were mounted within glass slides and cover slips using non-fluorescent immersion oil. Slides were examined at 1250 magnification by epifluorescence microscopy in a dark room using a Leica DM LS2 microscope. Nanoplanktonic biomass was estimated from mean biovolumes assuming a carbon content of 220 fg C · mm−3 (Børsheim & Bratbak, Reference Børsheim and Bratback1987). Phytoplankton and ciliates: water samples (200 ml) were fixed by Lugol's iodine solution (I2, KCL; CH3COOH) and counted under an inverted microscope using the Uthermöhl (Reference Uthermöhl1958) method. Algal biovolumes were estimated from cell dimensions according to Lohman (Reference Lohman1908) and converted to fresh weight biomass (FW) using the formula 106 µm3 = 1 µg (FW). Carbon biomass was obtained by assuming that organic cell carbon represents 12% of FW biomass. For ciliates, at least 200 ciliates were counted for each sample and were identified to genus or species level by consulting the works of Petz (Reference Petz and Boltovsky1999), Alder (Reference Alder and Boltovsky1999) and Strüder-Kypke & Montagnes (Reference Strüder-Kypke and Montagnes2002). The dimensions of 20–40 individual cells for each taxon were measured by image analysis at ×1250 magnification. Mean biovolumes were estimated from appropriate geometric shapes.
Statistical analysis
The data recorded in this study were submitted to a normalized principal component analysis (PCA) (Legendre & Legendre, Reference Legendre and Legendre1998; Chessel et al., Reference Chessel, Dufour and Thioulouse2004). Physical, chemical and biological parameters were considered. The discrimination between months was assessed by examining the projection of plots of the extracted factors on the factorial plane consisting of the statistically significant axes of the PCA analysis. Simple log (x+1) transformation was applied to data in order to correctly stabilize the variance (Frontier, Reference Frontier1973).
Mean and standard deviation (SD) are reported when appropriate. The potential relationships between variables were tested by Pearson's correlation coefficient. Computing and graphical display were done using the packages ADE 41.4.2 (Chessel et al., Reference Chessel, Dufour and Thioulouse2004).
RESULTS
Physical and chemical environment
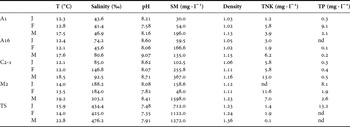
Table 1 shows the values of physico-chemical factors. The highest temperature coincided with the highest salt concentration. Because of the shallowness of the lagoons (<1 m), the waters in the Sfax saltern showed no vertical thermal stratification. Water salinity increased progressively from pond A1 which receives seawater to the crystallizer pond TS. The pH was high in the first ponds where phototrophic microorganisms developed, however it decreased in pond TS, due to the degradation of gypseous crust by sulphato-reducing bacteria (Amit & Bentor, Reference Amit and Bentor1971; Bardavid et al., Reference Bardavid, Ionescu, Oren, Rainey, Hollen, Bagaley, Small and McKay2007). Total nitrogen (TNK) concentrations were high in ponds C2-1 and M2. The lowest TNK were recorded in the crystallizer pond. Total phosphorus (TP) concentrations were high in ponds A1, M2 and TS but were not detected in ponds A16 and C2-1.
Physical and chemical parameters in the five ponds of the saltern (T, temperature; SM, suspended matter; TNK, total nitrogen Kjeldahl; TP, total phosphorus; nd, not detected).

J, January; F, February; M, March.
Heterotrophic bacteria
Cellular morphology determination by phase-contrast microscopy enabled the discrimination of four bacterial types: filaments, Vibrio, cocci and rod-shaped bacteria. Cocci had the smallest biovolume (0.07±0.04 µm3) and filaments the biggest (0.65±0.67 µm3). Biovolumes of filaments and cocci bacteria decreased as salt concentration increased, in contrast to Vibrio and rod-shaped bacteria which showed bigger biovolumes in the saltiest ponds.
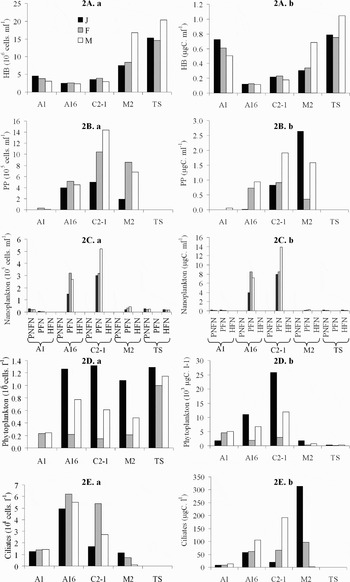
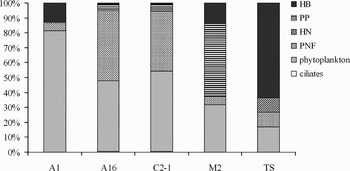
The bacterial density increased with both salinity and temperature gradients from 2.5 × 10⁶ cells · ml−1 in the second pond A16 (January) to 20.4 × 10⁶ cells · ml−1 in the crystallizer pond, March (7.5±6.2 × 10⁶ cells · ml−1). In the first ponds A1, A16, C2-1, the bacterial density was low and never exceeded 5 × 10⁶ cells · ml−1 (Figure 2A, a). Bacterial biomass varied from 0.12 (January, pond A1) to 1.05 µgC · ml−1 (March, pond TS) (Figure 2A, b). On average, the highest biomass was recorded in the hyper-saline ponds where Vibrio and rod-shaped bacteria amounted to 50% of total heterotrophic bacterial biomass. The contribution of bacteria to carbon biomass of the particulate (0.2–100 µm) fraction varied from 0.62% to 58% (18.13±24.42) (Figure 3).
Profiles of abundance (a) and biomass (b) of HB: heterotrophic bacteria (A), PP: phototrophic picoplankton (B), nanoplankton (C), note the different abscissa i.e: PNFN, phototrophic non-flagellated nanoplankton; PFN, phototrophic flagellated nanoplankton; HFN, heterotrophic flagellated nanoplankton, phytoplankton (D) and ciliated Protozoa (E) for three sampling dates in the different ponds.

Mean relative carbon biomass of prokaryotic and eukaryotic planktonic communities in the Sfax saltern. Values are the mean of the three sampling dates.

Phototrophic picoplankton
Phototrophic picoplankton (PP) was absent in the crystallizer pond but reached 14.4 × 10⁵ cells · ml−1, in pond C2-1, in March. Substantial densities were also found in both ponds A16 and M2 (Figure 2B, a). In pond A1, PP density was low (0.31 × 10⁵ cell · ml−1). Cells were spherical with a size ranging between 1.7 and 3.2 µm (mean = 2.5 µm) and a mean biovolume of 5.1 µm3. The highest biomass was recorded in pond M2 (2.65 µgC · ml−1, January) (Figure 2B, b).
The contribution of PP to carbon biomass of the particulate (0.2–100 µm) fraction varied from 0 to 54.17 % (11.32±23.9) (Figure 3).
Heterotrophic flagellated nanoplankton (HFN)
The density of heterotrophic flagellated nanoplankton (HFN) was very low (500 cells · ml−1) in the four ponds A1, A16, C2-1 and M2, but increased in the crystallizer pond TS where it varied from 1.6 to 2.2 × 10⁴ cells · ml−1 (1.8±0.3 × 10⁴ cells · ml−1) (Figure 2C, a). The biovolumes averaged 32±22 µm3 and the highest biomass was 0.15 µgC · ml−1 (Figure 2C, b). The contribution of HFN to total carbon biomass of the particulate (0.2–100 µm) fraction reached 11.38% in pond TS (Figure 3).
Phototrophic flagellated nanoplankton (PFN)
Three pigmented phototrophic nanoplankton cells were observed: phototrophic non-flagellated nanoplankton (PNFN) which dominated in pond A1 with abundance averaging 2.3±0.4 × 10⁴ cells · ml−1, and a mean biovolume of 27 µm3. In the other ponds, PNFN was absent (Figure 2C, a). The second group consisted of phototrophic flagellated nanoplankton (PFN) which were most abundant (100% of total PFN) in ponds A16 and C2-1 with mean abundances of 24.6±8.8 × 10⁴ cells · ml−1 and 3.8±1.21 × 10⁵ cells · ml−1, respectively (Figure 2C, a). The third group was formed by flagellates which proliferated in the hyper-saline ponds M2 (34±11.13 × 10³) and TS (24.7±3.8 × 10³). The biomass of phototrophic nanoplankton varied from 0.12 µgC · ml−1 (February, in pond TS) to 13.84 µgC · ml−1 (March, in pond C2-1) (Figure 2C, b). The contribution of PFN to carbon biomass of the particulate (0.2–100 µm) fraction varied from 2.44 to 26.27 % (14.8 ±9.7%) (Figure 3).
Phytoplankton
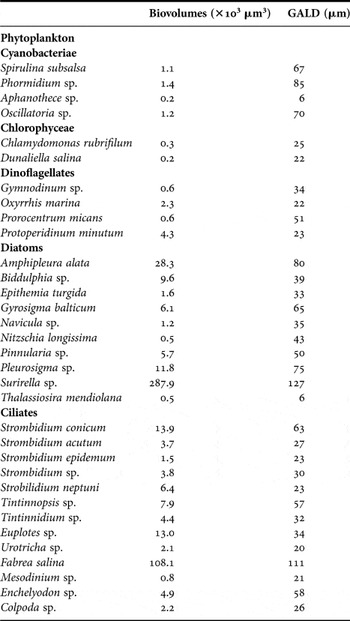
The phytoplankton abundance varied from 9.02 × 10⁴ (pond A1, January) to 1.31 × 10⁶ cells · l−1 (pond C2-1, January) (Table 2). The highest density was found in the hyper-saline pond TS where the Chlorophyceae Dunaliella salina developed abundantly (8.4 × 10⁵ cells · l−1) (Figure 2D, a). Phytoplankton taxa were present in all the sampled ponds. In pond A1, the diatoms (e.g. Navicula sp., Nitzschia sp. and Thalassiosira sp.) were major contributors (61%) to phytoplankton density, followed by dinoflagellates (chiefly, Gymnodinium sp. and Protoperidinium sp.) (36%) and the Cyanobacterium Spirulina sp. which represented a very low percentage (0.03%). In pond A16, the phytoplankton community shifted to dinoflagellate dominance (Gymnodinium sp.) (77%) followed by diatoms (Nitzschia sp, Navicula sp.) (23%). In pond C2-1 where salinity was close to 130‰, the diatom Nitzschia sp. contributed 57% of total phytoplankton density whereas the dinoflagellates Gymnodinium sp. and Oxyrrhis marina represented 43%. In the hyper-saline pond M2 where salinity reached 210‰, the Chlorophyceae Dunaliella salina and Chlamydomonas dominated the phytoplankton community (82.3%). The Cyanobacteriae Phormidium and Aphanothece were also present at substantial numbers (9.6%) followed by the dinoflagellate Gymnodinium (3.8%). In the crystallizer TS, the phytoplankton community was monospecific (D. salina: 99%), and the other species declined as they were unable to overcome the detrimental extreme saline environment of this pond.
Biovolumes and GALD (great axial linear dimension) of the major cyanobacteria and eukaryotic microorgnisms of the Sfax saltern.

In terms of carbon, the biomass varied from 201.4 µgC · l−1 in pond TS in February to 25.8 × 10³ µgC · l−1 in pond C2-1 in January (Figure 2D, b). There was an inter-pond variability in the relative contribution of the microplanktonic fraction to total carbon biomass (i.e. 0.2–100 µm), with 63.7%, 72.5%, 74%, 37.2% and 19.15% in ponds A1, A16, C2-1, M2 and TS, respectively. We recorded high biomasses in ponds A1, A16, C2-1 associated with the big-sized diatoms Surirella, Amphipleura, Pleurosigma and Gyrosigma, and the Dinophyceae Protoperidinium and Oxyrrhis marina, whereas the biomass in the hyper-saline ponds M2 and TS related to D. salina dominance.
Ciliated Protozoa
Ciliates were found in all the ponds of the saltern except in the crystallizer pond TS. The highest ciliate density (6.1 × 10⁴ cells · l−1) was recorded in February in pond A16 concomitant to the strong proliferation of the Prostomatid Urotricha sp. The ciliate density showed both temporal and spatial variabilities, with high values in February in pond A16 (5.5±0.6 × 10⁴ cells · l−1) and February in C2-1 (3.2±1.9 × 10⁴ cells · l−1) and low densities in January in pond A1 (1.3±0.1 × 10⁴ cells · l−1) and in March in pond M2 (0.6±0.5 × 10⁴ cells · l−1) (Figure 2E, a). In pond A1 (which exhibits marine characteristics), oligotrichous ciliates dominated the protozoan community whereas in ponds A16, C2-1 and M2, Prostomatids were dominant, and were accompanied by Hypotrichida and Heterotrichida. These latter became quantitatively more important in M2 (salinity close to 270‰), but always accompanied by Prostomatids. The ciliate carbon biomass varied from 0 to 313.2 µgC · l−1 in pond M2 in January. The highest abundance occurred in February, but the biomass was greatest in May. A similar pattern of biomass and abundance was observed among sampling times in pond A16 (r = 0.53, P < 0.05) (Figure 2E, b). The spatial distribution of the biomass of the different ciliated groups observed in this study differed strongly from that of abundance especially in ponds A16, C2-1 and M2, where Heterotrichida which were mainly represented by Fabrea salina dominated the ciliate community (63, 87, 100%, of total biomass respectively). However, the contribution of ciliates to total carbon (0.2–100 µm) biomass did not exceed 0.38% (Figure 3).
Statistical analysis
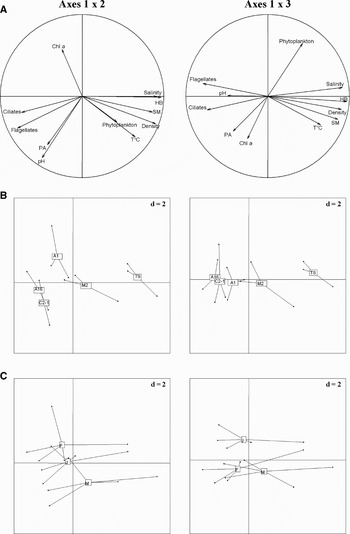
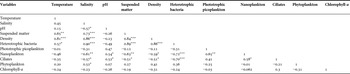
Sixty-eight per cent of the total variation is explained by the three first components of the PCA made on data related to biological communities and physico-chemical factors (Figure 4). We found two groups around the F1 axis. The first selected negatively heterotrophic bacteria, temperature, suspended matter, water density, salinity and phytoplankton. Heterotrophic bacteria were influenced by both temperature (r = 0.57, P < 0.01, df = 13) and salinity (r = 0.90, P < 0.001, df = 13) (Table 3). However, salinity was only correlated with phytoplankton abundance (r = 0.52, P < 0.001, df = 13). Figure 4 also indicates that the variation between ponds (A16, C21, M1, M2 and TS) seems to be larger than between months (January, February and March). Indeed, temperature was correlated but not significantly with ciliates (r = −0.35, P < 0.05, df = 13), nanoplankton (r = −0.46, P < 0.05, df = 13), and autotrophic picoplankton (r = −0.01, P < 0.05, df =13).
Results of the principal component analysis. (A) correlation circles; (B) projection of sample vectors 1 and 2; (c) projection of sample vectors 1 and 3.

Correlation matrix for physical, chemical and biological variables studied in the Sfax saltern. In bold significant relations (*P < 0.05, **P < 0.01, ***P < 0.001, df = 13).

DISCUSSION
Heterotrophic bacteria
The results indicate that among the microorganisms sampled in this study, heterotrophic bacteria showed the most obvious increase in both abundance and biomass with the salinity gradient. Biovolumes of only Vibrio and rod-shaped bacteria exhibited the same pattern as total bacterial abundance. The predominance of big-sized bacteria in the Sfax saltern has also been reported for other hyper-saline environments (Oren, Reference Oren, Withon and Potts2000). Bacterial density was close to that reported for various saline ponds (Gasol et al., Reference Gasol, Casamayor, Joint, Garde, Gustavson, Benlloch, Díez, Schauer, Massana and Pedrós-Alio2004), but much higher than that found in marine ecosystems (Sherr & Sherr, Reference Sherr and Sherr1991) and in oligotrophic to eutrophic freshwater ecosystems (Aleya et al., Reference Aleya, Marvalin and Devaux1988; Domaizon et al., Reference Domaizon, Viboud and Fontvieille2003). Heterotrophic bacteria were most abundant in the crystallizer pond TS as already reported by Pedrós-Alió (Reference Pedrós-Alió and Ventosa2003). The currently available data which reported enhanced proliferation of Archaea in extreme saline environments, and their capability to develop in-between halite crystals (Ionescu et al., Reference Ionescu, Lipski, Altendorf and Oren2007) suggest that the strong increase of bacterial abundance throughout the salinity gradient may be attributable to these extremophiles. Indeed, phase-contrast microscopy enabled us to observe square flat cells that feature in literature, named Haloquadratum walsbyi and Salinibacter, the two dominant prokaryotes in crystallizer ponds worldwide (Gunde-Cimerman et al., Reference Gunde-Cimerman, Oren and Plemenitaš2005, Bardavid et al., Reference Bardavid, Ionescu, Oren, Rainey, Hollen, Bagaley, Small and McKay2007). Overall, prokaryotes proliferated in the hyper-saline ponds as there was a decrease in the grazing pressure from bacterivorous flagellates and ciliates which were unable to survive the high salt stress (Oren, Reference Oren1999). Also, prokaryotes were favoured by the enhanced concentrations of dissolved organic carbon deriving from dead cells, and both from phytoplankton (mainly from the Chlorophyceae D. salina) and the anostracan Artemia salina which was found in high numbers in the hyper-saline ponds of the Sfax saltern (Guermazi et al., Reference Guermazi, Elloumi, Ayadi, Bouaïn and Aleya2008a).
Phototrophic picoplankton
Our results were much higher than those found in the Arabian Sea (S = 36 ‰, <7.5 × 10³ cells · ml−1, Garrison et al., Reference Garrison, Gowing, Hughes, Campbell, Caron, Dennett, Shalapyonok, Olson, Landry and Brown2000), the China Sea (North Pacific, 6 × 10³ cells · ml−1, Jiao et al., Reference Jiao, Yang, Hong, Ma, Harada, Koshikawa and Watanabe2005), an Italian saline lake (salinity > 62 ‰, mean = 27 × 103 cells · ml−1, Zippel & Schimmele, Reference Zippel and Shimmele1999), and Spanish salterns (0.3 × 10³ cells · ml−1, Estrada et al., Reference Estrada, Peter, Gasol, Casamayor and Pedrós-Alió2004). The highest densities were recorded in ponds A16, C2-1 and M2 (salinity range: 70–200‰). PP cells in the Sfax salterns were spherical in shape with a size ranging between 1.7 and 3.2 µm (mean = 2.5 µm), and were overall bigger than marine picoplanktonic cells (1.5 µm). The dynamics of these microorganisms have been shown to be governed by the fluctuations of nutrient concentrations (Drakare et al., Reference Drakare, Blomqvist, Bergström and Jansson2003), mainly nitrogen and phosphorus concentrations which may be density-controlling factors (Takamura & Nojiri, Reference Takamura and Nojiri1994; Bell & Klaff, Reference Bell and Klaff2001). Furthermore, the high salinity was deleterious for PP growth. Although we did not undertake grazing experiments, the reversed pattern between the nanoplanktonic heterotrophic flagellates and PP added to the similar distribution of both total nanoplanktonic flagellates and ciliates may suggest that PP was mainly grazed by heterotrophic flagellates. Our assumption is supported by Evans et al. (Reference Evans, Arts and Robarts1996) who showed a reduction of the picophytoplankton biomass due to predation by heterotrophic flagellates in the saline Redberry lake (Canada) (salinity: 20 ‰). Similar findings were also reported in various aquatic ecosystems (Szelag-Wasielewska, Reference Szelag-Wasielewska2004).
Phototrophic non flagellated nanoplankton (PNFN)
PNFN was dominated by diatoms (8 µm length, 2.5 µm width). In the Mediterranean Sea, small diatoms have been shown to contribute 87% of the <20 µm size fraction (Edwards et al., Reference Edwards, Burkill and Sleigh1998). The density of PNFN in the Sfax saltern was higher than that recorded in the English Channel (Brandt & Sleigh, Reference Brandt and Sleigh2000) and in a newly flooded French reservoir (168±92 × 103 cells · l−1, Thouvenot et al., Reference Thouvenot, Debroas, Richardot and Devaux1999).
Phototrophic flagellated nanoplankton (PFN)
The density of PFN was higher than that recorded in marine (Agawin et al., Reference Agawin, Duarte and Agustí2000) and freshwater (Domaizon et al., Reference Domaizon, Viboud and Fontvieille2003) ecosystems. The density of big-sized flagellates (D. salina and Chlamydomonas) increased with the salinity gradient (r = 0.52, P < 0.05, df = 13), and the reverse was found for small cells. This corroborates the results of Pedrós-Alió et al. (Reference Pedrós-Aliò, Calderon-Paz, MacLean, Medina, Marrasé, Gasol and Guixa-Boixereu2000) and Estrada et al. (Reference Estrada, Peter, Gasol, Casamayor and Pedrós-Alió2004) recorded in Spanish salterns.
Heterotrophic flagellated nanoplankton (HFN)
HFN of the Sfax slatern were larger (8–12 µm) than those found in marine (2–5 µm, Sherr & Sherr, Reference Sherr and Sherr1991), estuarine (4 µm, Gilbert, Reference Gilbert2001) and freshwater (2 and 6 µm, Domaizon et al., Reference Domaizon, Viboud and Fontvieille2003) ecosystems. The highest density of HFN was recorded in the hyper-saline ponds where they contributed 50% of total nanoplankton contrary to Pedrós-Alió et al. (Reference Pedrós-Alió and Ventosa2003) who showed that HFN decreased with salinity and disappeared when salt concentration was higher than 300‰. The density of HFN found in the saltern (0.00–2.2 × 10⁴ cell · ml−1, mean = 1 × 10⁴ cells · ml−1) was higher than that recorded in both marine (Sherr & Sherr, Reference Sherr and Sherr1991) and estuarine (Muylaert et al., Reference Muylaert, Van Mieghem, Sabbe, Tchx and Vyverman2000) environments, in a bay (Artolozaga et al., Reference Artolozaga, Ayo, Latatu, Azúa, Unanue and Iriberri2000) and freshwater (Karrasch et al., Reference Karrasch, Parra, Cid, Mehrens, Pacheco, Urrutia, Valdovinos and Zaror2005) ecosystems. Furthermore, our results showed that HFN adapted to extreme salinity contrary to both PFN and PNFN.
Phytoplankton
The sequential changes in the physical–chemical conditions and phytoplankton groups along the salinity gradient in salterns have been repeatedly described (Rodriguez-Valera, Reference Rodríguez-Valera and Rodríguez-Valera1988). Both diatoms and dinoflagellates dominated the phytoplankton community (>90% of total abundance) in the first ponds A1, A16, C2-1, but drastically declined (9%) as salinity reached 200‰ to be substituted by Chlorophyceae mainly D. salina which was dominant at the highest salt concentration as already reported by Estrada et al. (Reference Estrada, Peter, Gasol, Casamayor and Pedrós-Alió2004).
Ciliates
In pond A1 which had marine characteristics, the ciliate community was dominated by Oligotrichida (Strobilidium sp., Strombidium psp., Tintinnides psp.). In ponds A16 and C2-1, the Prostomatida Urotricha sp. became the dominant taxon, but in the hypersaline pond M2, the ciliate community shifted to the dominance of Heterotrichida (Fabrea salina and Blepharisma sp.), Hymenostomata (Uronema sp.) and Gymnostomatida (Encheylodon sp.). These ciliates have been shown to adapt easily to the high salt concentration (Esteban & Finlay, Reference Esteban and Finlay2003) and may be good bio-indicators of hyper-saline ponds. The ciliates Strobilidium psp., Strombidium psp., Tintinnides, Euplotes sp., Mesodinium sp., Balanion sp. and Urotricha sp. found in the Sfax saltern, were also reported in marine (Lovejoy et al., Reference Lovejoy, Legendre, Martineau, Bâcle and Quillfeldt2002), and lacustrine (Aleya et al., Reference Aleya, Hartmann and Devaux1992) environments. Ciliates were missing in the crystallizer pond. Several authors reported a decrease in species richness and diversity of ciliates with salinity gradient in Mediterranean saltworks (Pedrós-Alió et al., Reference Pedrós-Alió and Ventosa2003) and Antarctic saline lakes (Laybourn-Parry, Reference Laybourn-Parry1992). Small species of Prostomatids which dominated the ciliate community in the ponds having a salinity range of 50–100‰ are known to occur in a very wide spectrum of aquatic ecosystems. In the Sfax saltern, the opportunistic strategy of these ciliates together with their predation on nanoplankton (Hahn & Höfle, Reference Hahn and Höfle2001) may explain such dominance.
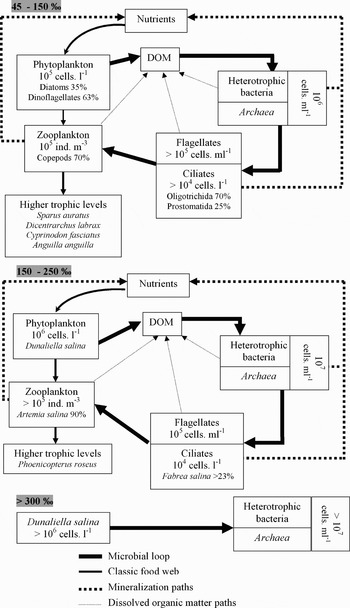
In conclusion, it seems to be obvious that prokaryotes and eukaryotes are important components of the Sfax saltern's food web, and the microbial loops play dominant roles in creating a sustained cycle of production and decomposition of organic matter (Figure 5). This role became crucial in the saltiest ponds (>300‰) in which heterotrophic bacteria are physiologically adapted to the highest salt concentration, and their growth was stimulated by increased temperature. Salinity also influenced the phytoplankton abundance. In ponds with salinity approaching that of seawater, diatoms and dinoflagellates dominated the phytoplankton community. The Chlorophyte Dunaliella salina and the Cyanobacteriae Aphanothece sp. and Phormidium sp. dominated the phytoplanktonic community in the saltiest ponds (190–476‰). The phytoplankton of the crystallizer pond TS (>300‰) was entirely composed of D. salina. However, salinity is not the only deterministic factor of species development. In this sense, the pioneer development of diatoms in pond A1 was chiefly governed by temperature. Thus, the effects of salinity on community structure in saline ecosystems located in arid zones are less significant than has been assumed (Williams, Reference Williams1998). Ciliates have a high biomass and are certainly major predators of bacteria and phytoplankton, as has been clearly demonstrated in other aquatic environments. They occur throughout the salinity gradient, and some genera are physiologically adapted to the highest salinities (pond M2). The taxon Fabrea salina dominated the halophile ciliate community and we have shown that it is an effective competitor of the anostracan Artemia salina for obtaining food resources (Guermazi et al., Reference Guermazi, Elloumi, Ayadi, Bouain and Aleya2008b). Overall, the abundance and species diversification of aquatic microorganisms decreased as the salt concentration increased. Only a few species, mainly prokaryotes, survive the high salt concentration suggesting a simplification of the food web along the salinity gradient (Figure 5).
Simplified diagram of the Sfax saltern's food web showing the dominant role of the microbial loop along the salinity gradient.

ACKNOWLEDGEMENTS
We gratefully acknowledge support from the staff of the Sfax saltern company. This work was conducted as part of a collaborative project between the University of Sfax (Tunisia) and the University of Franche-Comté UMR CNRS 6249 Chrono-Environnement (France, Besançon).